Erwin Geiss
Bavarian Geological Survey, Hess-Str. 128,
80797 Muenchen, Germany, tel (+49 89)1213-2629 fax (+49
89)1213-2647, erwin.geiss@gla.bayern.de
Abstract
The Bavarian
Geological Survey is responsible for statewide
geoscientific data collection, their evaluation and
availability to the public. Today GIS technology is used
for data analysis and the deduction of thematic maps in
almost every department of the survey. Also the
cartographic production of the geoscientific standard
maps is now carried out by digital methods.
Of increasing importance is the establishment of a
general soil information system for interdisciplinary
evaluation, prediction of dangers and risks and working
out proposals for soil protecting actions. A common
database of point data and related laboratory
measurements was already set up. A database for spatial
data is under development.
INTRODUCTION
With an area of approximately
70.000 km² Bavaria is the largest state of the Federal
Republic of Germany. The Bavarian Geological Survey is
one of the oldest institutions of its kind and
responsible for statewide systematic geoscientific data
collection, their evaluation and availability to the
public. The size of the area in combination with new
challenges and decreasing personal resources stresses the
need for efficient use of technical tools for spatial
data analysis.
THE USE OF
GIS-TOOLS IN SELECTED DEPARTMENTS
In the framework of a research
project on erosional risk evaluation Esri’s ArcInfo
was used in 1991 for the first time. In the meantime the
use of GIS technology became a standard tool for the
production of thematic maps in almost every department
(regional geology, hydrogeology, mineral resources,
engineering geology, soil science). Examples are given
below.
Soil science
The use of GIS-tools has become a standard procedure
within this department. Besides the computation of
erosional risk, there is a wide range of applications. A
main focus is the production of soil maps at the scale of
1: 200,000 which are generated in a semi-automatic way
using GIS- based conceptual maps (64 maps 1: 25,000 for
each map sheet 1: 200,000). A very important part of this
project is the establishment of a general map legend for
all soil maps. Another project focuses on the data
acquisition immediately in the field. For this purpose
rugged field computers with GIS functionality are used.
They allow the user to orientate himself with a digital
map, collect profile descriptions and perform basic tests
on the plausibility of the data which can then be
uploaded into the common data base of the survey.
Other GIS based projects concern city soils and the
programming of specific evaluation methods (mainly with
AML).
Soil protection
For soil protection, the spatial coverage and
visualisation of relevant parameters is of extreme
importance. By detailed analysis of existing data a map
series of background values of anorganic substances (e.g.
heavy metals) in Bavarian soils could be produced. This
atlas contains maps of the interpolated content of 12
different elements in 3 soil layers (Scale 1: 1,300,000;
publication in preparation).
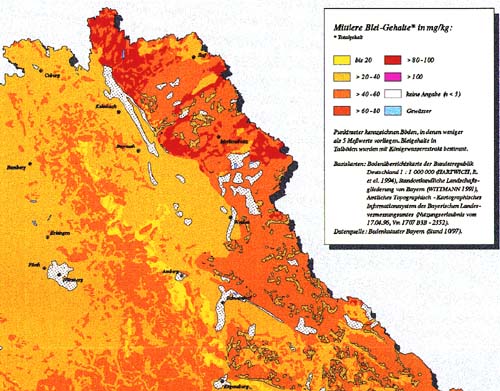
Figure 1
Part of a map of natural lead-content in bavarian soils.
Hydrogeology
Using ArcInfo, a map series was started, displaying the
protective function of the groundwater covering strata.
The working scheme is explained and illustrated in
Diepolder (1995, 1996). Another essential result of this
work was the deduction of a hydrogeological reference
legend for use within the whole information system.
Mineral deposits
ArcView is used to visualize the data material acquired
during reconnaissance trips and laboratory analysis. An
application was prepared using Avenue to inform the user,
about objects which provide additional information and
allows easy access to this material via hot-links.
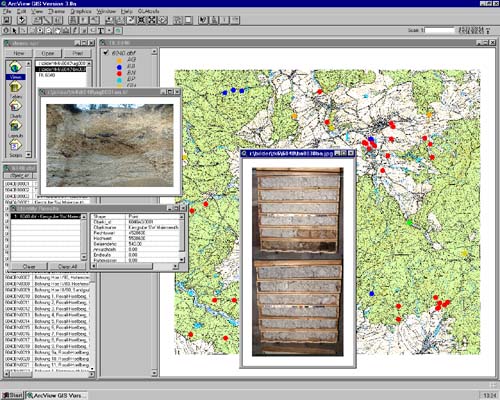
Figure 2
ArcView-Screen with photographs of outcrops and drill
cores.
Geological mapping
The regional geological mapping (scale 1: 25,000) is the
classical task of the survey. At present, the preparation
of the field map is still done the traditional way, but
more and more digital information is available at the
geologist’s desk. The aim is, however, to start with
the digital mapping already in the field, where
additional information is provided to the geologist.
GIS AND
CARTOGRAPHY
During the last years the
cartographic production of the geoscientific standard
maps was shifted towards digital methods.
1993 the Bavarian Geological Survey started a project
„digital geological maps of Bavaria". The first
completely digitally produced map was a sheet of the 1:
25,000 map series (Bayerisches Geologisches Landesamt,
1995). Then, as a major milestone, in 1997 the
„Geological Map of Bavaria 1: 500,000" was
published. It was produced exclusively with ArcInfo.
This very ambitious and complex map with more than 22,000
single areas and over 120 different legend units clearly
demonstrated the capabilities of ArcInfo for high-end
cartography (Geiss et al., 1995; Bayerisches Geologisches
Landesamt, 1996). In the meantime almost all new
geological maps of the survey are produced digitally from
the geologist’s manuscript map to the color
separations for printing.
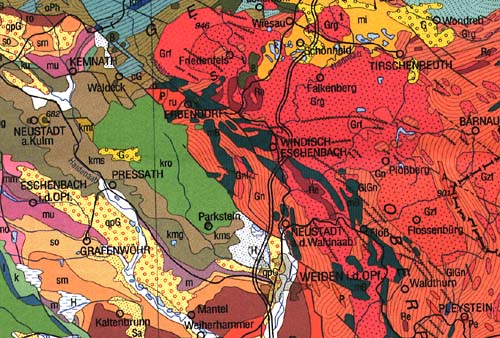
Figure 3
Part of the geological map of Bavaria 1:500,000.
The easy use makes the classically
printed map still irreplacable for field work. Therefore,
it will certainly be published in the traditional way
with a high quality claim over the next years.
On the other hand an important field of activity will be
the publication of our maps on electronic media. The
digital geological map 1: 500,000 (along with
explanations) on CD-ROM will be released this autumn.
Much time has still to be invested to generate the
specific symbols and shadesets for the maps. It is our
aim to establish a standard legend for the cartography,
that is closely related to the general geological key
used in our database system. However, as long as it is
not possible to import complex shadesets directly from
ArcInfo into ArcView, much double work is necessary to
ensure the same familiar appearance of the maps in
different systems.
There is still a great demand for digital vector data
– topographic data from the land surveying authority
as well as geological data and others. To reduce this
problem, the published topographic and geoscientific maps
were scanned and are now provided to our internal users
as georeferenced raster maps.
An important and yet unsolved issue is the close
relationship between the mapping of the geoscientific
content and the topographic base map at the time of the
field work. While a traditional printed map merges the
two information layers inseperable, a digital information
system allows and facilitates the combination of -
possibly incompatible - data sets. To make the potential
user aware of possible problems, a careful and detailed
documentation of each information layer (metadata) is
necessary.
THE BAVARIAN SOIL
INFORMATION SYSTEM – STATUS AND PLANS
Of increasing importance is the
establishment of interactive information systems. In 1988
the Bavarian Government decided to create a „soil
information system" to collect data on soils and the
deeper underground for interdisciplinary evaluation,
prediction of dangers and risks and to work out proposals
for soil protecting actions. As a first response the
Geological Survey set up a common database of point-data
and related laboratory measurements. This database and
its applications provide users of every department with
all necessary information (base data, profile
descriptions) on point locations (including wells,
boreholes, outcrops) and related analytical data.
At present the database for spatial data is under
development. The aim is, to use this tool for structuring
the geo-data, establish the data base for attributes and
organize the geometries. An important functionality of
the system will be the management of data history and
interpretations. This is of fundamental significance for
geoscientific data sets and was successfully implemented
within the data base of point and laboratory data.
A further task for the future will be the integration of
the large amount of information that is presently located
in traditional paper and microfilm archives. First
attempts to integrate complex, descriptive data
(graphics, photographs) have been successfully made with
ArcView.
The use of GIS systems will more and more spread out to
untrained, occasional users. Therefore the user interface
is gaining increasing importance. The systems must become
more user friendly, allow access to all kinds of data
(including metadata) and provide standardized methods as
well as tools for individual analysis. Another
requirement is the possibility to comfortably create
reports and maps.
Today, the common GIS-frontend at the Geological Survey
is ArcView, but other solutions (using Internet/Intranet
techniques) are also under consideration.
Our experience showed, that the interdisciplinary
unification of the data model and processing methods is
necessary. Due to the longevity of most of the geodata,
quality assurance is an important task. Therefore
meta-data have to be provided to inform potential users
on the basic properties of geo-objects (e.g. spatial
extent, time and quality of registration, history of
modifications, data source).
In general, we observe a continuous change of the focus
of information systems. While in former years people
concentrated on using the geopotential, today the
main orientation is towards the protection of the
geopotential. Our soil information system is part of
Bavaria’s Agenda 21 and plays a major role in soil
protection laws, that will take effect in 1999. This
implies also, that our information system in no longer
only a tool for internal use, but will be more and more
in the focus of the public. Geoscientific data and
information – presented fast, appropriate and clear
- will be increasingly used for far-reaching decisions.
GIS tools will play a major role in achieving this aim.
REFERENCES
- Bayerisches Geologisches
Landesamt (ed.), (1995), „Geologische Karte
von Bayern 1:25 000, Blatt Nr. 7234
Ingolstadt." Bearbeitet von H. Jerz und H.
Schmid-Kaler, München.
- Bayerisches Geologisches
Landesamt (ed.), (1996), „Geologische Karte
von Bayern, 1:500 000", München.
- G.W. Diepolder, (1995),
„Schutzfunktion der Grundwasserüberdeckung.
Grundlagen – Bewertung – Darstellung in
Karten." In: GLA-Fachberichte, Bd. 13, p. 5
– 79, 4 App.
- G.W. Diepolder (1996),
„Protective Function of Groundwater
Covering." In: Esri (ed.): Esri Map Book,
volume eleven, pp. 36 & 37, Redlands, USA.
- E. Geiss, E. Poitner, M.
Mehren & A. Schneider (1995), „The
Digital Geological Map of Bavaria at 1:
500,000." In: Esri (ed.): Esri Map Book,
volume ten, p 34, Redlands, USA.
|