 |
| GIS APPLICATION FOR PROVISION OF POPULATION SAFETY UNDER EMERGENCY SITUATIONS |
| Victor Belogurov Emergency Rescue Service of Kharkov, Uborevich St.h.12 fl.204, Kharkov 310144, Ukraine, tel. (+380-0572) 672282, fax (+380-0572) 455047, e-mail: belogur@online.kharkiv.net Sergey
Kosolapov Abstract Two problems (population evacuation and determination of territory flooding), having the greatest interest for the civil defence staff of Kharkov region of Ukraine, are considered. GIS application is presented as two demonstration projects. These projects have been elaborated with the help of Network Analyst and Spatial Analyst modules. INTRODUCTION In Ukraine the Ministry of
Emergency Situations and its local organs - the Civil
Defence Staffs - are dealing with problems of safety
under conditions of natural disasters, accidents and
other dangerous events. Safety of municipal property is
under stuardship of municipal organs. Nonetheless, the
safety of population cannot be considered as ensured. As
a result, in some cities NGOs rescue services have been
created. They give first aid to casualties and perform
rescue work on voluntary basis. In Kharkov there is such
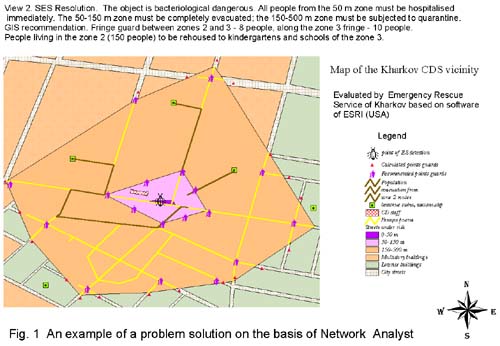
NGO called the Emergency Rescue Service (ERS). DEMONSTRATION PROJECT 1. The assumed situation: a bacteriological hazard around Civil Defence Staff site. The evacuation problem was solved by application of the Network Analyst module and ArcView GIS v3.0a with the help of digitiser, an author’s program and the script-file written for this project. At the Kharkov city streets network three types of problems were solved: finding the best route between two arbitrary assigned points, determination of the route to the nearest point from other theme, and determination of zones by given distances from a network point. Results are presented as three views. View 1. Assumed situation. Civil Defence Staff (CDS) duty officer has detected an unidentified object with a liquid. A rapid analysis indicates to its acute toxicity. GIS RECOMMENDATIONS: transfer the object to the nearest sanitary and bacteriological laboratory, and the duty officer to a hospital. View 2. Conclusion of the Sanitary and Epidemiological Station (SES): the object is a bacteriological dangerous. Immediate hospitalisation of all people from 50 m zone, evacuation all people from 50-150 m zone to the quarantine zone (150-500 m). GIS RECOMMENDATIONS: guards between zone 2 and 3 - 16 men, along zone 3 boundary - 40 men. 150 people living in the zone 2 accommodate in 2 kindergartens and 1 schools in the zone 3. View 3. GIS RECOMMENDATIONS: routes for people evacuation from 50-150 m zone to the quarantine zone (150-500 m).
Fig. 1 demonstrates one of the described views. The figure illustrates how map visualisation can provide for a concrete technical and economical effect. Red triangles indicate guard points, selected through a calculation algorithm. Such points should be placed at each street, where it enters the zone 3 area. By calculation 20 people are necessary for such guarding. But the map visualisation allows to reduce this number to 10 people, because guard points can be placed at 2 to 3 streets crossing directly near to the zone 3 fringe (points recommended by GIS are designated as a "guard with dog"). Fig.1 demonstrated also how Network Analyst allows to select an optimal way for evacuation, without entering to the most dangerous zone 1, put out of bounds by the Sanitary and Epidemiological Station (SES). DEMONSTRATION PROJECT 2. The assumed situation: a freshet
flooding of the territory. A relief map of the assumed
territory was made with the help of Spatial Analyst.
Designations of elevations were added. Changes in water
level were given with the help of Show Symbol functions.
The main aim consisted in demonstration of ArcView GIS
capacity in imaging three-dimensional maps and in their
use for solution of operative tasks of people saving,
without application of involved hydrological
computations. In the framework of this project were
elaborated and printed zone of operative actions for
people evacuation, with visual demonstration of critical
sites (islands and peninsulas) needing urgent evacuation,
and narrow drainage divides amenable to destruction by
construction machines for quick reduction of water level
at threatened sites and freshet diversion along safe
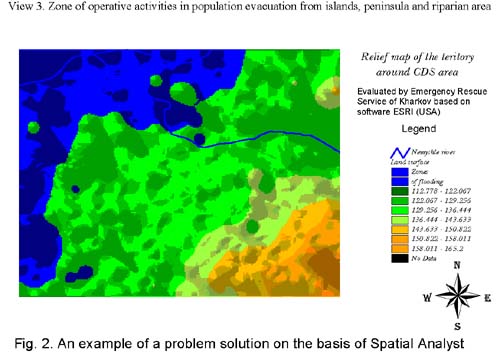
direction. View 1. Situation before freshet. View 2. Flooded zone. View 3. Zone of operations, connected with the population evacuation, with visual indication of critical points (islands and peninsulas) where emergency evacuation is necessary, as well as narrow divides, which must be subjected to destruction by building machinery and so to lower the water level at the flooded region, by diverting water in a safe route.
Fig. 2, demonstrating the zone of operative activities (view 3), reveals that from the peninsula on the North it is possible to evacuate people with the help of motor vehicles, in contrast to the situation at islands where for this purpose it is necessary to use helicopters or boots. As elevations are known, it is possible to conclude that after water level additional rise equal to 10 cm the land evacuation will be impossible. PRESENTATION There demonstration projects 1 and 2 were presented:
The results can be evaluated as very satisfactory. The leadership of Civil Defence Staff came to conclusion about necessary to use GIS-technologies based on Esri software for its practical activities. They have applied to their financing authorities for acquisition of ArcView v.3.0a with Network Analyst, Spatial Analyst, and for financial support for elaboration by Emergency Rescue Service of GIS applications, oriented at solution of practical problems, described in projects 1 and 2, for Kharkov city as a whole and for Kharkov region. And although the financing authorities did not provide necessary assets due to crisis in the national economy, the obtained results indicate to expediency of Esri software application to practical problems aimed at ensurance of the safety for population. CONCLUSION The described projects indicate
that applicability advantages of GIS-technologies are not
limited by visualisation only. Their main value
GIS-technologies allow to solve problems, which are
unsolvable or difficult to solve by mathematical methods.
Attempt, for example, to solve by mathematics the problem
of dangerous zone guarding posts minimisation, as
illustrated on Fig. 1. As to calculation of flooding
zones, the up-to-date science has no mathematical methods
at all. It is solvable only by modelling, either physical
(as it was done earlier) or on computer, with the help of
modern GIS. GIS-technologies provide a novel method for solution of applicability problems. This method is alternative to mathematical methods which at present are considered by many specialists as the only providers of the scientific basis for quantitative calculations. ACKNOWLEDGMENTS The authors express then gratitude
to Charles Convis (Esri, USA) for donation for us ArcView
GIS and to Eugene Seredinin (ECOMM, Ukraine) for
practical steps enabling us to obtain this donation. |
     |
    |
 |
| [Introduction] [Conference programme] [Presentation by authors] [Presentation by category] [Poster session] [List of european Esri distributors] [List of exhibitor] [Esri products news] [Credits] |