 |
||||
| TRACK EVENTS | ||||
| Per Anton Fevang Norwegian National Rail Administration, Head Office, Pilestredet 19, N-0048 Oslo, Norway, tel +4722455193, fax +4722455249, e-mail per.fevang@jbv.nsb.telemax.no Abstract Railway planning and operation relies on 150 years of experience in the use of thematic maps and spatial referencing. Today visualization and analysis is aided by a digital route network in combination with data about the track, landscape, weather, vegetation, human population, animal collisions and other events along the track. INTRODUCTION Connecting geographical locations
is the basic motivation for railways. Planning, operating
and maintaining railways requires extensive use of
geographical and environmental information. Ever since
the Irish National Railroad in 1838 produced a series of
geological and property related thematic maps that may be
considered a first manual geographical information system
[1]; the railways around the world have used maps as
tools in their progress. Geology and property information
is no less important in the railroad projects today, but
added requirements for speed, capacity, interoperability
and environmental factors brings forward new tools and
methods. Computers and geographical information systems
are increasingly important.
RAILWAY ROUTE NETWORK Most of the data in the infrastructure database [6] is related to normal operation and maintenance of the 4200-km railway network. What type of component is installed, how old is it, how long since last revision etc. The components are classified according to function, and are spatially identified by km and line id. New lines and local changes to the track geometry are accounted for with respect to history, meaning that all km signs along the line do not have to change for each local change. Instead a break of continuity in km numbers is placed at a point near where the old and new lines merge. The reference km is thus not always the same as the distance traveled along the line. For GIS purposes a route network has been constructed on the basis of a digital map of the railway network combined with tabular data about the lines, including km corrections. A line alteration normally means shortening the line, giving a gap in the linearly continuously increasing km numbers, but maintaining unique km identification. In some cases the new line is longer than the old line, introducing the problem of duplicate km values on the same route. A solution is to let the old and new parts of the line belong to different routes. The km are in any case tied to route integer identification, just note that one continuous geometrical line may contain more than one route.
With the route network in place, it is possible to use the dynamic segmentation functionality of ArcView to visualize all types of infrastructure data as route events. The events can be linear as electric lines and tunnels, or point events as animals hit by train. Appropriate use of colors and patterns may then give colleagues, business partners and politicians [3] better pictures regarding the issues concerned, hopefully leading to better understanding and decisions. As an extra benefit, the quality of the underlying data is often improved in the process, as errors or inconsistencies are resolved.
ENCOUNTERING DIFFERENT SPECIES A railway requires less than a third of the area than a highway of similar capacity. Although environmental effects of railways are generally less severe than for highways, they are not negligible. The railroad forms a barrier through the landscape, dividing natural habitats for people and animals. During winter the railway cleared of snow appear dangerously attractive to creatures on the move. This results in a number of collisions between train and animal each year. The dominant species is moose, followed by reindeer and sheep. Cattle, horse, dog and even musk, eagle, wolf and bear appear in smaller numbers. For livestock keepers and train operators it is an economical and an emotional issue, for wildlife authorities the ecological dimension is most important. The number of moose hit by train each year directly affects the hunting quotas set by the wildlife authorities for the region. To visualize and analyze the problems, digital maps of the country and railway network is connected to the central infrastructure database. This helps recognizing troubled areas and patterns, enabling focused countermeasures.
Figure 4
Figure 5
Figure 6 Distribution of the total of 523 moose hit by train 1997 [6]. The diagram shows the number of animals hit per km in 1997, up to 5 in the North. Overall, only cars kill more moose every year. COMPLETENESS VERSUS CLARITY The density of data is an important factor influencing the readability of the map. More data does not necessarily imply more information for the reader; often the opposite is true when distinct points merge into scattered lines or areas. There are in principle two ways to handle this problem, either reduce the amount of data or increase the scale of the map. Data reduction is a science in itself, and requires competence in order not to give a wrongful impression. Increasing the scale seems easy, but may lead to boundary and division problems as the display area is limited. All maps are distorted simplifications of reality; the scientific challenge is to simplify without loosing integrity, maintaining a truthful representation of the data. In figure 6, the initial data reduction was in selection of a single species in a single year. Drawing the collisions as regular points gave some loss of precision in the most troubled areas where there are more than one hit per km. The route diagram conveniently allowed all data to be visualized without further data reduction or change of scale, giving emphasis where the numbers are large. METEOROLOGICAL CONDITIONS Snow depth is a significant factor in train / animal encounters. The weather influences the railway in many ways. Precipitation requires proper drainage, or flooding and landslides may occur. The heat of the sun, or rather rapid changes of temperature may cause disturbances to the railway geometry. Such events are recorded in a central infrastructure database, allowing map and data aided analysis and possible countermeasures to be considered.
Figure 7 Precipitation data was collected from the meteorological stations of the Norwegian Meteorological Institute [9] that are within a distance of 10 km from a railway, using ArcView GIS. The normal data for the months of January and July show that in this country, the west is wet. In winter, snow is a normal form of precipitation, causing trouble for all kinds of transportation except skiing.
Counterbalancing the impression
anyone might have that Norway is cold, wet and snowy, the
map above shows where too much heat and sunshine have
caused problems. It is well known that metal expands with
rising temperatures, and when the change is rapid, errors
in track geometry may be induced. Note that these errors
are common elsewhere than in the southernmost warmest
part of the country [10]. This is because there are more
things under the sun that come into play, such as what is
the general quality of the track, how tightly are the
tracks fastened and how accurately are the tracks
monitored. Maps tell where efforts should be made to
improve conditions. A more rare, but no less serious problem is fire along the tracks, sometimes ignited by sparks from brakes of trains. Weather and vegetation naturally influence the probability of ignition, yet fires are hard to predict and avoid. Vegetation control and cleanliness along the line is one precaution, brake and train maintenance another.
Figure 10 Fires along the railway in Southern Norway occurred during the last 3 years [4]. Clearly the problem is most evident along the southern line to Kristiansand, where we have a dryer climate and more vegetation than along the Bergen line, for example. The steep inclines towards Bergen lead to more breaking, but other factors such as more rain help reduce the fire hazard. CHALLENGING TERRAIN The Norwegian landscape in cooperation with the weather has more drama to offer.
The diagram above indicates the
number of avalanches per km on the route from Trondheim
to Bod�. The number ranges from 1 to 7 on this route,
including all kinds of landslides, snow, soil or
rockslides [5]. Landslide detectors connected to the
signaling system are installed in selected locations to
warn train drivers of avalanches ahead.
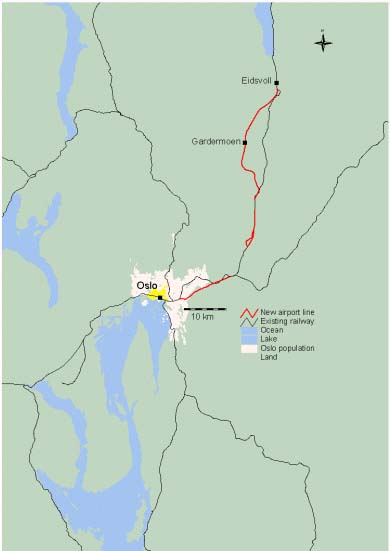
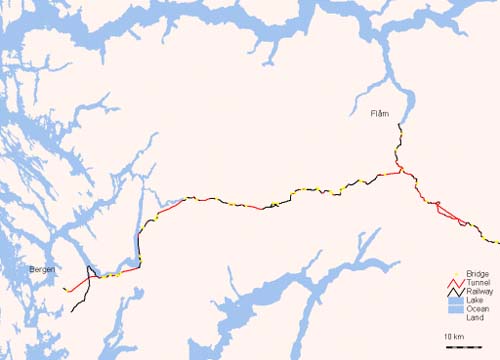
There are about 800 railway tunnels in Norway, with an average length of 335 meters [6]. The longest is just outside Oslo, 14 km on the Gardermoen line, not yet opened. Many of the tunnels in operation are on the Bergen line, crossing the mountains between Oslo and Bergen. The tunnels reduce travelling time, snow and landslide problems, but they also take away some of the spectacular views from passengers. In addition to the rock tunnels about 100 wooden snow covers help keeping the lines open in winter. [6] Construction of the Bergen line began more than 100 years ago [7], and over the years many line alteration have been made, with more to come. Tunnels and bridges are made to shorten and straighten the line. The Bergen line is the largest railway project ever in Norway, in the early years it consumed more than half of the state budget. The line alterations made nowadays are digitally documented and reported to the National Mapping Authorities, who in turn give their subscribers yearly updates of digital maps. The maps presented in this paper depend on this working relationship [8].
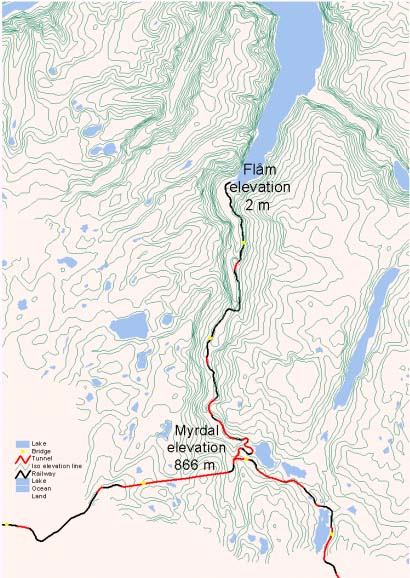
The Fl�m line branches off the Bergen line and with an inclination of 55 meters per km it is the steepest railway in the world [6] with ordinary rail / wheel traction. At the end station there is a boat connection giving excellent views on the fjords. A seen on the map, the curly geometry of the railway down to Fl�m is a tough deviation from the straight tunnels and comfortably large curve radius found in modern tracks built for higher speeds. The Fl�m line draws a great number of tourists every summer, proving that a straight line is not the only way to success. REFERENCES
|
||||
     |
||||
    |
||||
 |
||||
| [Introduction] [Conference programme] [Presentation by authors] [Presentation by category] [Poster session] [List of european Esri distributors] [List of exhibitor] [Esri products news] [Credits] |