 |
| NESA A/S GIS Project - Giselle |
| Colleen A. Madigan NESA A/S, Strandvejen 102, DK-2900 Hellerup, Denmark, Phone # 45 39 48 16 33, Fax # 45 39 48 10 19, E-mail – cmy@nesa.dk Abstract In 1996 NESA
A/S, which is Denmark’s largest distributor of
electricity began the implementation of its GIS project
Giselle. Giselle is a GIS-system that has been delivered
by Informi GIS A/S, the Danish Esri Distributor, in
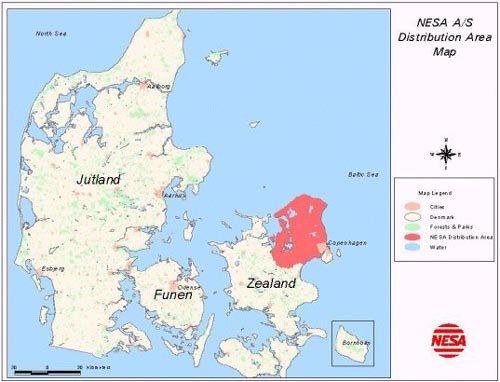
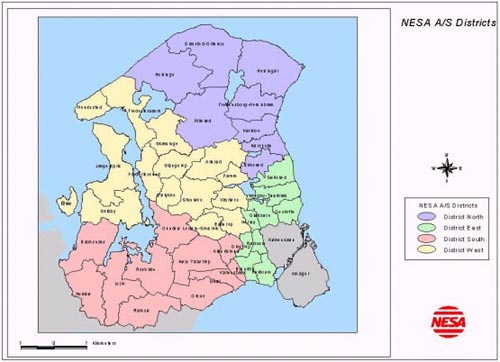
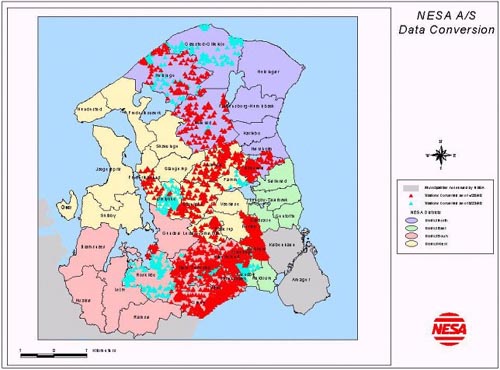
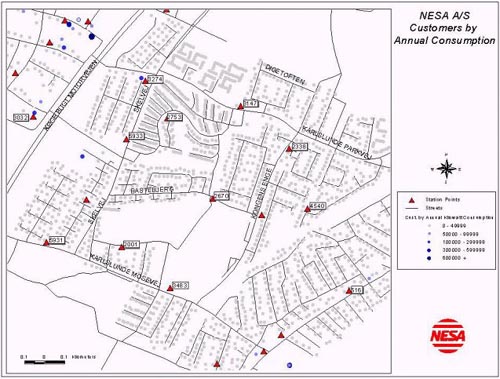
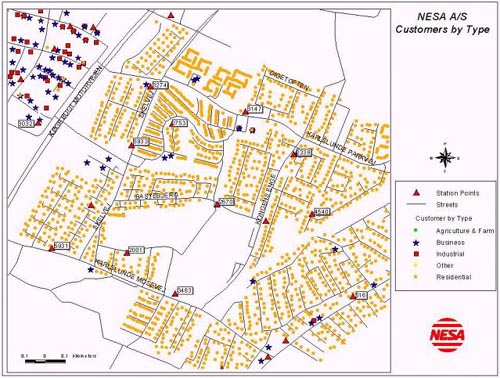
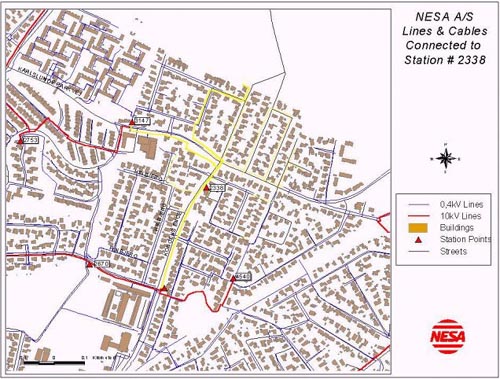
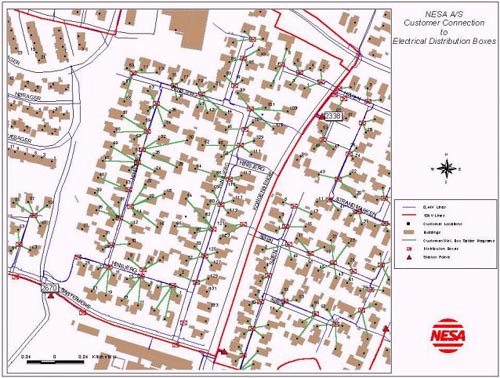
consortium with Miner & Miner and Esri. Introduction to NESA A/S NESA A/S’s history dates back to 1902 when it started as an electric train company providing service from Hellerup to Klampenborg. Over the years NESA A/S grew and transitioned into the electrical utility industry and now is Denmark’s largest provider of electricity. NESA A/S supplies electricity to the northern part of Zealand (Figure I). Figure I The areas in North Zealand that NESA A/S serves are the municipalities in the area of Roskilde and the majority of Copenhagen’s suburban municipalities. The NESA A/S supply area is divided into four districts, (Districts North, South, East, and West) with district office locations in Fredensborg, Roskilde, Vangede, and Stanløse. Their main office is located in Hellerup (Figure II). Figure II 1. Introduction to Giselle Beginning in 1996, NESA A/S began transforming its grid registration on the basis of thousands of drawn maps and plans into one overall digital map compilation. The data conversion effort is currently 25-30 percent complete and anticipate 100 percent completion by the Year 2000. The Giselle project is a joint GIS application development and support effort with Informi GIS A/S (Esri Distributor in Denmark), Miner & Miner (Full service electrical utility Engineering firm), and Esri representing a consortium of GIS expertise. The Giselle system is based on ArcInfo, ArcStorm, and the Miner & Miner MM Application toolbox. The RDBMS is Oracle and there are five database servers and 30 GIS workstations that are geographically dispersed at five locations that are linked via fiber optical high-speed networks. Future desktop GIS application development is currently being explored in ArcView and MapObjects. Although the data is still being converted into digital format, GIS is being used to help NESA A/S understand the progress of its digitizing efforts (Figure III). Figure III shows the progress of the digitizing efforts, with the red triangles representing station locations that were entered into the spatial database as of April 23, 1998, while the light blue triangles representing the station locations entered from April 24, 1998 to August 23, 1998. This map assists management in understanding the progress of the data conversion in relation to its respective geography. Once the digitizing phase is complete, the future plans of the Giselle system are to migrate all of the utility data into the ArcFM application and move all of the spatial data over to SDE (Spatial Database Engine). This information and GIS applications will enable NESA A/S to update maps more quickly, provide better service to its customers and give electrical cable information to contractors in connection with excavation and construction projects. Figure III 2. Understanding Future Needs of Users It’s very important at this stage of the project that end user application concepts are explored and developed so that the wealth of analysis capabilities the Giselle project provides can be spread throughout the organization. All departments will benefit from the information and their particular analysis requirements can be automated and integrated into the daily business processes. 3. Data Mining of Internal and External data sources Figures IV and V represent the use of internal customer location data. Figure IV displays customer locations by annual consumption of kilowatt hours of electricity. Figure IV Figure V displays NESA A/S customers by type: agriculture and farm, business, industrial and residential. Figure V NESA A/S is currently exploring the various secondary data sources that are available that can be incorporated and combined with the internal Giselle spatial and attribute data. Examples of some relevant secondary data sources are demographic information and business location data. These data sets will ensure that NESA A/S remains competitive in an ever changing and deregulating utility industry. 4. Mapping and Analysis of Spatial and Attribute Data Figure VI represents an example of the current analysis functionality that the Giselle system provides. This map displays all the 10kV (high voltage) lines and the 0,4kV (low voltage) lines and cables that are connected to Station # 2338. From this analysis, the number of customers affected by a power outage at station # 2338 can be determined and visually displayed. Figure VI Figure VII displays the analysis functionality the GIS can add to the system. A spider diagram analysis displays lines connecting each customer to their respective electrical distribution box. This simple GIS analysis will save NESA A/S years of digitizing effort. Figure VII 5. Conclusion With the global trend towards removing government regulation in the electrical and utility industry in Europe, NESA A/S is faced with a crucial strategic challenge. Giselle is just one example of recognizing this challenge and investing money to ensure they remain competitive in this ever-changing environment. |
     |
    |
 |
| [Introduction] [Conference programme] [Presentation by authors] [Presentation by category] [Poster session] [List of european Esri distributors] [List of exhibitor] [Esri products news] [Credits] |