13° EEUC '98 - Firenze

WELLMASTER - PROCESSING OF BOREHOLE-DATA WITH ArcInfo AND ARCVIEW

Heinz Reitner
Geological Survey of Austria, Rasumofskygasse 23, A-1031 Vienna, Austria,
http://www.geolba.ac.at, tel: +43-1-712 56 74 24, fax: +43-1-712 56 74 56, reihei@cc.geolba.ac.at

Piotr Lipiarski
Geological Survey of Austria, Rasumofskygasse 23, A-1031 Vienna, Austria,
http://www.geolba.ac.at, tel: +43-1-712 56 74 24, fax: +43-1-712 56 74 56, lippio@cc.geolba.ac.at


Abstract

The WELLMASTER application is a tool for management, 2D and 3D modelling, and graphical display of borehole data. Currently two versions of WELLMASTER exist, at first an ArcInfo® version based on the AML (Arc Macro Language) scripting language and second an ArcView® version written in AVENUE™ programming language, using the ArcView® extension Dialog Designer™.


INTRODUCTION

The huge amount of borehole information data, gathered and processed by the Geological Survey of Austria, raised the demand for an appropriate borehole management system. At first we started using dBASE® flat-file database systems (for data storage and query) linked to CAD Systems (for visualisation of data) via textfiles on MSDOS based hardware platforms. Then we developed a more user-friendly solution using the ArcInfo® GIS (all of the borehole data was stored in INFO Tables) customized with AML-driven menus and tools on an UNIX system allowing multiuser access [LIPIARSKI (1994)]. Afterwards we had the possibility to use relational database management systems (i.e. Oracle®) based on the SQL Standard to handle the borehole information data and connect it to our ArcInfo® tools [LIPIARSKI et.al. (1997)]. Now we are currently developing an ArcView® based system to provide similar functionality as provided by the ArcInfo® borehole solution for the standard desktop PC, giving access to various database systems using ODBC.
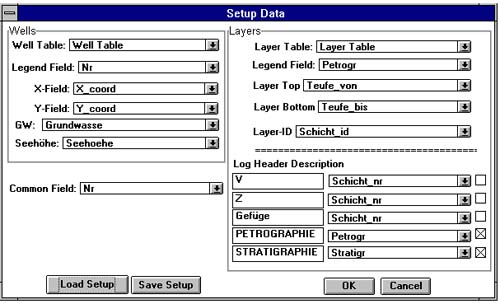
All modules of WELLMASTER are written in AML (ArcInfo® Macro Language) or AVENUE™ [Esri® (1996)], in addition the ArcView® version uses the Dialog Designer™ extension. [Esri® (1997)].
Both programs are highly flexible with regard to the database structure of accessible borehole data. For use with WELLMASTER, borehole databases should consist at least of two files:
First a borehole information file which can include such fields as "borehole number", "borehole name", "elevation above sea level", and "symbol" (for plotting) for each well; second a stratigraphic data file and/or a groundwater table, where each layer is connected to its borehole through the relation variable, i.e. the "borehole number". This file includes the log fields like "depth of layer top", "depth of layer bottom", "layer thickness", "lithology", "stratigraphy", "correlation", "shadesymbols" and groundwater information.
By providing the system with the necessary information on where these fields can be found in a database, any borehole database can be readily accessed.
Wellmaster has been developed at the state Geological Survey of Austria over the past five years, and is now successfully used by private industry as well as geological surveys within the Austrian provincial governments.
The ArcInfo® based version includes 6 modules:

  1. the well manager allows editing, query, selection, and screen display of data
  2. the map layout module prepares point, line or polygon coverages, grids, images, and stratigraphic logs for plotting on a combined map, including the annotation, scaling, and page placement of the final output
  3. the cross-section module correlates borehole layers across wells
  4. the surface modelling module performs 3D-modelling of layer surfaces by interpolation between wells, and contouring of the modelled data
  5. the 3D-view module performs 3D-display of surfaces
  6. the grid composite module produces shaded relief maps of 3D-data

The ArcView® version of WELLMASTER now features the first three parts of the ArcInfo® version, further enhancements are planned to be added in the future.

MODULE DATA INPUT

The ArcInfo® version of Wellmaster provides a module for data input and manipulation, giving a graphical user interface to work solely with INFO tables, or using one of the RDBMS connection possibilities (i.e. Oracle®) provided by ArcInfo®. The ArcView® version of Wellmaster hands all of the data input and processing to the RDBMSes by means of the common ODBC Standard, so ArcView® is only used for data query and visualization.
At least two main tables are needed, at first a table of borehole information data, such as X and Y coordinates for reference of location, borehole number, elevation, etc., second a table containing the log information such as depth, petrography, stratigraphy, groundwater elevation etc. of the recorded layers. These tables are linked by a common identifier (named "Relation Item" in ArcInfo® and "Common Field" in ArcView®). So by use of the borehole table the log table can be viewed on a hole by hole basis.
ArcInfo® needs a third table, the point coverage, linked to the borehole table, for visualization of the borehole locations (X and Y values), whereas ArcView® can use the borehole table as it is by adding an "event theme".
The Geological Survey is gathering data from many different sources in varying formats, so our main intention was to provide a simple and flexible interface for transfering existing borehole datasets to our WELLMASTER system. Therefore we created a data setup dialog, where all information about existing tables and the appropriate field names can be entered (see figure 1). In addition there is also the possibility to enter correlation markers to create contour maps of layers and cross-sections.


Figure 1
Data Setup

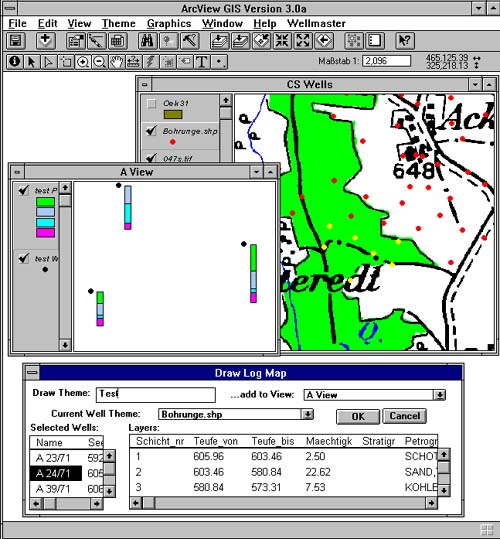
MODULE FOR CREATING POINT, SYMBOL, AND SECTION MAPS

This module provides an easy to use graphical user interface tailored for the quick creation and output of maps. The user is guided by menus through the required ARCPLOT commands. There is also the possibility to store all chosen options in a template file for later use or creation of plot series with the same layout. The Plot Module makes use of the ARCPLOT functionality to make a graphical or database content query of the required data sample.
When all options are set, in ArcInfo® the map is created by the automated generation of an AML-Script (this script can be stored for later use and documentation or editing of the created plot/printer file), in ArcView® the automated creation of shapefiles leads to the ArcView® layout capabilities (see figure 2).


Figure 2
Section Map and Data Viewer

MODULE FOR CONTOURING

At the Geological Survey of Austria borehole datasets are often used for generating contour line maps [LIPIARSKI et.al. (1995)]. The WELLMASTER system guides the user with an easy to use graphical interface through the required steps to create these contour maps within ArcInfo®. The layer module makes use of the ArcInfo® module GRID to create contour lines, special menus for the inverse distance method and the kriging method have been created. After selecting the desired sample data set, the basic requirement of this method is a sufficient amount of data and an appropriate distribution [DAVIS (1986)]. Next the user can choose which of the correlation markers (layers) shall be used for contouring. If there are no data values for the chosen layer, the user can select an option for processing of missing values: At first the smaller correlation mark can replace the nodata value, second the bigger mark can replace the missing value or the missing value shall not be considered at all for processing of the contour lines. In addition the user can choose between the contouring of the top, bottom or thickness of layers. Last but not least, independent of these options the module gives the possibility to create additional surface and groundwater contour lines.
Again a graphical user interface allows easy input of the required parameters for inverse distance modelling, i.e. search radius and number of samle points.
Further information for contouring can be provided by adding additional XYZ points, breaklines, etc.

MODULE CROSS SECTIONS

This module provides a convenient tool for generating cross sections for stratified, tabular bedded sediments, such as groundwater aquifers, coal mining data, and clay, sand or gravel deposits. The program provides a possibility to combine the graphical log representation with the results of the contouring module.
The desired boreholes can be selected with the usual ArcInfo® or ArcView® selection tools. The user can put in X and Z scale values, choose the required colour or fill palettes and the legend information; also layout elements of the X and Z axis such as tics, spacing, etc. can be entered. Connecting lines between logs (straight or curved, created out of the contour lines) can be drawn, the enclosed areas between log profiles can be filled with an appropriate shade or fill symbol.
There is also a possibility to add breaklines to show faults and to add text labels to each stratum.
After entering all of the required settings, again in ArcInfo® an AML script is generated by the module to create the plot, in ArcView® the module creates shapefiles of the cross section (see figure 3).


Figure 3
Cross Section

3D MODULE AND GRID MODULE

These modules can be used to enter the parameters for perspective drawing of contour lines, tins, grids and other map elements to create an AML script for plot generation [LIPIARSKI & HEINRICH (1995)]. There is also a menu to create colour coded elevation grids and composite grid drawings, combining Hue, Saturation and Value grids.

OUTLOOK

We are planning to develop additional functionality for the ArcView® version of WELLMASTER, such as adding an inverse distance modelling tool and to provide a connection to the 3D features of the ArcView® Spatial Analyst and the ArcView® 3D Analyst.

REFERENCES

  • J.C. Davis (1986), „Statistics and Data Analysis in Geology", 2.Ed., John Wiley &
  • Sons, New York-Chichester, USA.
  • Environmental Systems Research Institute (1987), „Cell-based Modelling with GRID", Esri®, Redlands, USA.
  • Environmental Systems Research Institute (1996), „Using Avenue™", Avenue™ Customization and Application Development for ArcView®, Esri®, Redlands, USA.
  • Environmental Systems Research Institute (1997), „Using the ArcView® Dialog Designer™ (Version 1.0)", Esri®, Redlands, USA.
  • P. Lipiarski (1994), „Bohrdatenverwaltung auf ARC-INFO®-Basis", in Salzburger Geographische Materialien, Heft 21,Salzburg, Austria.
  • P. Lipiarski, P., H. Reitner & M. Heinrich (1995), „Rohstoffarchiv EDV-Dokumentation und Rohstoffarchiv EDV-Auswertung und Darstellung", Unveröff. Bericht,
  • Bund/Bundesländer-Rohstoffprojekte Ü-LG-032/94 und Ü-LG-033/94,
  • Bibl. d. Geol. Bundesanst. Wiss. Archiv A 10692-R, S. ungez., 56 Bl., 35 Abb., 9 Tab., Anhang, Wien, Austria.
  • P. Lipiarski, B. Atzenhofer, H. Feix, H. Reitner & M. Heinrich (1997), „Rohstoffarchiv EDV-Dokumentation und Rohstoffarchiv EDV-Auswertung und Darstellung", Unveröff. Bericht Bund/Bundesländer-Rohstoffprojekt Ü-LG-032/95-96 und Ü-LG-033/95-96, Bibl.d.Geol.Bundesanst. Wiss.Archiv, S. ungez., 31 Blätter, illustriert, Anhang, Wien, Austria.
  • P. Lipiarski & H. Reitner (1998), „Wellmaster – A GIS-based Processing of Borehole-Data", in ICGESA International Conference on GIS for Earth Science Applications, IGGG, Ljubljana, Slovenia.

Go to the introductionGo to the conference programmeGo to the presentation by authorGo to the presentation by categoryGo to the Poster session
Go to the list of exhibitorGo to the novalities in Esri productsGo to the credits

Back to home page

[Introduction] [Conference programme] [Presentation by authors] [Presentation by category]
[
Poster session] [List of european Esri distributors] [List of exhibitor] [Esri products news]
[
Credits]