Val
Steven Schmidt
Advanced Visual Systems A/S, Blokken 15, DK-3460
Birker�d, Denmark, tel (+45) 45 99 95 99 fax (+45) 45 99
95 00, email info@avs.com
Abstract
Telecommunication
companies that exploit their business data effectively
can gain important insight into markets, and offer new
products and services to address the needs of demanding
customers. Analysts in the telecommunications industry,
like those in other industries, are faced with the
challenging task of extracting and analyzing complex
information from large databases. Knowledge workers and
application developers can find help in the combination
of spatial data management and data visualization tools.
This paper examines an issue faced by most businesses:
how to turn data into information, and make this
information accessible to persons who rely on it. Data
visualization tools, used in combination with the Esri
Spatial Database Engine, provide revolutionary technology
to address the challenge of discovering and exploiting
information. Applications using data visualization tools
from Esri business partner Advanced Visual Systems are
discussed, along with solution case stories taken from
the telecommunications industry. For innovative
companies, powerful visual applications are improving
their decision-making capabilities by performing spatial
and multivariate business data analysis and providing
rapid access to comprehensible information.
DATA EVERYWHERE? INFORMATION
SOMEWHERE
Telecommunication companies face
the challenge of managing and exploiting massive amounts
of customer and network operations data that they
accumulate at an ever-increasing rate. Data drives
business decisions; it enables telecommunication
companies to offer continuous improvement in cell
coverage, optimally route calls, provide responsive and
personal customer care services. Companies that succeed
in turning data into information and products can gain
important business advantage in an intensely competitive
industry.
According to industry surveys, the majority of business
data in any industry is spatially related. This is
particularly true for the telecommunications industry,
where most data can be associated with a telephone
number, an address, or the location of a network node or
receiver. This data typically resides in relational
databases, making it difficult to fully exploit the
spatial nature of this information. Extracting data based
on location - termed a spatial query - is an intuitive
way to access data and perform spatial investigations.
Tools such as the Esri Spatial Database Engine are
revolutionizing the way spatial data is managed by
providing a fast and accurate way of accessing this type
of data. Data visualization applications accessing data
through SDE are enabling companies to turn their complex
spatial and business data into comprehensible visual
information.
TOOLS FOR MANAGING AND
EXPLOITING DATA
The Esri Spatial Database Engine
(SDE) is an application data server that sits on top of a
relational database. SDE spatially enables relational
databases and allows GIS data to be associated with
business data in the corporate database. Furthermore, SDE
provides data querying techniques based on spatial, as
opposed to relational, data dependencies. The open
architecture of SDE provides an API that enables any
application to interface to it, and thereby use SDE as a
source of data.
AVS/Express, from Advanced Visual Systems, is a
multi-platform development tool for building
visualization applications and components. Included with
AVS/Express are libraries of modules that provide
advanced 2D and 3D data visualization, as well as an
interface to the full functionality of the Spatial
Database Engine. With AVS/Express, spatial data analysis
applications can be extended to include multidimensional
views of data. Applications built using AVS/Express can
access the functionality of SDE, and offer both rapid
access to data and the supporting visualization methods
for turning this data into comprehensible information.
VISUAL ANALYSIS OF SPATIAL DATA
Data that is associated with
addresses, telephone numbers, sales territories, or
points of sale can be geographically associated. This
spatial information provides the reference through which
related data, such as customer profiles, or market
potential for a territory, can be analyzed. Spatial data
has been traditionally stored in geographical information
systems, with related attribute data stored in relational
databases. Using relational methods to simulate spatial
query operations is, at best, quite difficult. Products
like the Spatial Database Engine spatially enable a
relational database and provide the mechanism for storing
the vector information defining geographical boundaries,
and for associating existing business data to distinct
geographical coordinates. Data in a spatially enabled
database can be extracted using spatial queries, that is,
retrieved based on geographical location. A spatial query
might begin with a question like "What are the total
number of subscribers within a 5 kilometer radius from
this location?" Spatial queries of this type are an
effective way to extract data from a large data store.
The extracted data can then be the target for further,
spatial or non-spatial, business analysis.
Spatial analysis of complex business data can contribute
to the process of information discovery by enabling the
viewer to see and analyze data with respect to its
geographical relationships. Data visualization techniques
enable spatial analysis to also be applied to
multivariate business data. The application shown in
Figure 1 uses spatial information in two ways: to both
view and access information. Visual queries greatly
simplify the interface to information and are used in
this example to select information. The initial display
provides the visual interface for navigating through the
database, in addition to providing information for each
postal code region. Users can click on any region to
extract and analyze additional data associated the
selected area. In Figure 1 average income, shown as
color, is associated with each postal code region in the
London area. A second variable, containing demographic
data from the census bureau, is represented by the height
of each region.
Figure 1
Business data visually analyzed based of geographical
location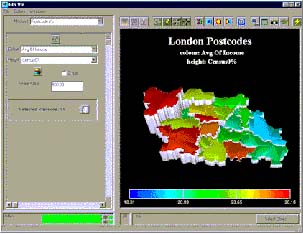
The spatial component of data can
provide an important visual reference for interactive
operations such as selecting areas of interest and
drilling down. This type of interactive probing is often
done in the early stages of the analysis process. A
visualization tool can provide a spatial view of the
data, and enable the user to drill down into further
views of more abstract business information not
necessarily associated with a map.
The application shown in Figure 1 serves as the visual
initial interface to a data query operation. Clicking on
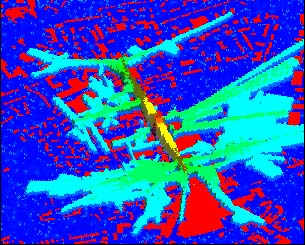
a region selects data for that region. In Figure 2,
demographic data for a region is extracted and visually
represented as a 3D-scatter chart. The chart organizes
the data into consumer profile groups. Groups with
similar characteristics are clustered, indicating
attribute association. Groups with unique characteristics
appear as outliers. In the scatter chart, clustered and
outlier groups are easy to distinguish, yielding
information on both groups which is pertinent to the
market analysis.
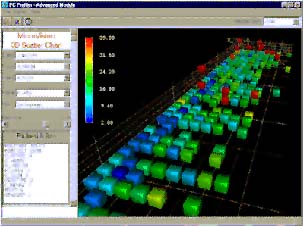 Figure 2 Figure 2
Customer profiles represented by a 3D model
The combination of spatial and
multidimensional analysis techniques shown by Figure 1
and Figure 2 provides users with an effective way to
search for and identify important information and monitor
critical business operations. Geographical information,
such as that found in spatially enabled databases and
geographic information systems, can provide important
positional reference points for data analysis and
presentation. Visualization tools enable GIS-type
information to be combined with multivariate information
from business data repositories, and provide views and
insight into data not obtainable from a purely
geographical perspective. Spatial analysis combined with
multidimensional data analysis in the same application is
a powerful means of discovering information.
DATA VISUALIZATION IN THE
TELECOMMUNICATIONS INDUSTRY
Telecommunications companies have
traditionally been quick to recognize the potential of
new technology and use it to improve their business
processes. The following case stories examine how data
visualization has been applied by leading
telecommunications companies to solve data analysis
issues associated with large repositories of spatial and
business data.
BRITISH TELECOM
In the British Telecommunications
network there are six thousand switches and twenty-five
million customer lines generating megabytes of network
status and control data every minute. Overlaid on the
physical network is an expanding range of voice, data,
and video services, each with their own data and
management requirements. Dr. Graham Walker, Technical
Group Leader, Systems Research at BT describes the main
driver for rapid growth in visualization activity as
"the overwhelming volume of data that routinely
confronts both researchers and managers."
Dr. Walker’s group investigated how visualization
could be used by the sales, finance, and marketing groups
to analyze the results of special promotions, price
changes, and the quality of service provided to their
customers. According to Dr. Walker, "Visualization
provides valuable information on patterns and trends, and
can realize insights and perspectives that are not
immediately available using conventional data analysis
and display techniques."
Applications of visualization to non-spatial data, such
as financial indicators or traffic statistics, are of
great interest to BT. Data visualization provides the
users of financial and statistical applications with the
ability to interactively explore data, and to spot
trends, cycles, and patterns that would otherwise be
difficult, if not impossible, to identify. For example,
in Figure 3 multivariate data is visually analyzed to
determine quality of service levels.
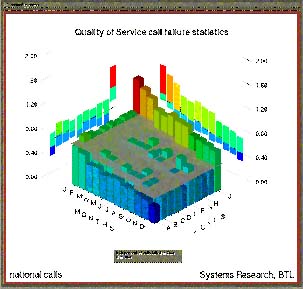 Figure 3 Figure 3
Multidimensional view of call service statistics
3D views, which introduce the
visual element of depth, provide an expanded viewing
space within which data can be organized and displayed.
The 3D viewing space, termed a workbox, has 6 walls
(planes) onto which information can be projected.
Additional planes can be defined within the interior
space of the workbox. A considerable amount of
information can be placed in a three dimensional view
while still maintaining clarity in the display.
Consider the graph shown in Figure
4. Produced by a customer care application, this 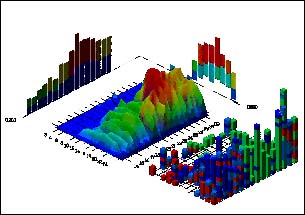 image
summarizes the overall performance of a call center. The
date and time axes of the middle graph show patterns in
incoming call traffic during the day. Color is used on
this graph to indicate wait time. The graph clearly shows
that as call traffic increases, so does the wait time for
a certain percentage of callers. Aggregated information
is displayed on two of the back walls. The graph to the
right of the display contains additional information on
response performance per operator station. image
summarizes the overall performance of a call center. The
date and time axes of the middle graph show patterns in
incoming call traffic during the day. Color is used on
this graph to indicate wait time. The graph clearly shows
that as call traffic increases, so does the wait time for
a certain percentage of callers. Aggregated information
is displayed on two of the back walls. The graph to the
right of the display contains additional information on
response performance per operator station.
Figure 4
Visual analysis of customer call center performance
The complete display provides a
visual summary of related customer service factors and is
an effective overview of the performance of the call
center. Informative, comprehensible, and visually
appealing displays of complex information, as exemplified
by the image in Figure 4, enable companies like British
Telecommunications to exploit large amounts of complex
data and fine-tune critical business processes.
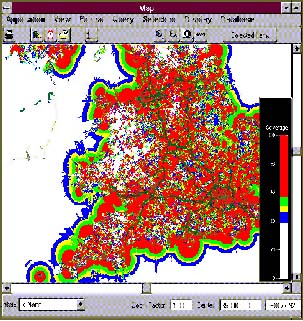
VODAFONE
Figure 5
2D overview of national coverage levels
 The tools and services provided by Advanced
Visual Systems have enabled Vodafone, one of the
UK’s largest mobile telecommunications companies, to
implement a system for monitoring cell coverage and
network performance. Vodafone has been working closely
with Advanced Visual Systems to develop Vodafone
Information System Analyzer (VISA), an intuitive
application which the engineering department is using
extensively to monitor cell and network performance.
Information that was once difficult to extract from
multiple Oracle databases and required considerable SQL
experience is now accessible through visual queries. For
workers who rely on information, complex patterns in the
data are immediately recognized and comprehended through
the use of data visualization. The tools and services provided by Advanced
Visual Systems have enabled Vodafone, one of the
UK’s largest mobile telecommunications companies, to
implement a system for monitoring cell coverage and
network performance. Vodafone has been working closely
with Advanced Visual Systems to develop Vodafone
Information System Analyzer (VISA), an intuitive
application which the engineering department is using
extensively to monitor cell and network performance.
Information that was once difficult to extract from
multiple Oracle databases and required considerable SQL
experience is now accessible through visual queries. For
workers who rely on information, complex patterns in the
data are immediately recognized and comprehended through
the use of data visualization.
The application shown in Figure 5
runs on UNIX and Windows platforms and provides a variety
of views into the data, including vector and raster map
information, 2D charts, and data tables. Users can
interact with the display to select areas of interest and
drill on more detailed information, such as the precise
cell coverage in a dense urban area, as shown as a 3D
view in Figure 6.
Figure
6
Detailed 3D view of local coverage
Dr. Barry Skuse, Chief Engineer
– Performance Management, is excited by the
functionality provided by their visual solution: "we
are very pleased with Advanced Visual Systems and the way
they have worked with us. We look forward to continued
successes and further applications…the benefits have
already been seen by other departments within
Vodafone." With improved access to information, and
visual representations of data that hasten comprehension,
Vodafone has been able to improve product quality and
service to customers of their mobile telephone network.
DEUTSCHE TELEKOM
Deutsche Telekom is the largest
telecommunications service provider in Europe. Its
position and reputation ensure that it will play a
leading role in key technology developments into the next
century, not least the global shift to the
information-driven society and the worldwide
liberalization of telecommunications.
In the ongoing quest for efficiency and cost-effective
coverage, Deutsche Telekom continuously assesses all its
existing and projected transmitters. In order to fine
tune coverage footprints and avoid interference with
other transmitters, data on factors such as land usage,
road maps, population density, and simulations are all
included in the analysis process. 3D views, similar to
the image shown in Figure 7, provide the first
approximation of the effect of variations in the
surrounding terrain.
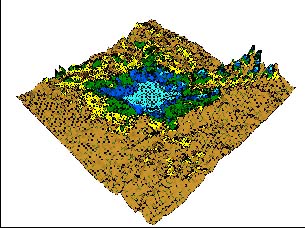 Figure 7 Figure 7
3D view of signal propagation
To assist planning engineers in
providing optimal coverage, proposed transmitter sites
are marked in Deutsche Telekom’s GIS database and a
wave propagation study, using Deutsche Telekom’s
AVS/Express-based application RUVIS, is performed for the
selected areas. The radiation propagation modeling tool
shown in Figure 8, with its embedded data visualization
capabilities, is being used at Deutsche Telekom to plan
broadcasting coverage for the eastern part of Germany, as
well as other countries worldwide.
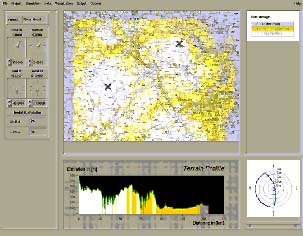
Figure
8
Radiation propagation modeling tool
With the emergence of new
technologies, such as digital broadcasting, Deutsche
Telekom is confident that the modeling system will enable
it to engineer the best possible solutions and meet the
demands of all its customers. According to Visualization
Engineer W. Schmeing, "Using AVS/Express we can
easily increase or modify the functionality of
applications by just changing or adding a few
objects." Visualization helps Deutsche Telekom
technical specialists explore "what-if"
scenarios and quickly arrive at valuable information,
thus ensuring services that offer the greatest possible
coverage at the lowest cost.
MULTIDIMENSIONAL ANALYSIS USING
GIS AND DATA VISUALIZATION TOOLS
Geographical Information System
tools can be used with spatially enabled databases to
perform data queries and some level of spatial data
analysis. Visualization tools differ from GIS tools in
their support of multidimensional data structures. With
visualization tools and data structures, complex business
data can be modeled and visually represented. The
resulting display can include the GIS data for reference,
but is not limited to a purely geographic view.
The spatial component of data can provide an important
visual reference for selecting areas of interest and
drilling down. These interactive methods are often used
in the early stages of the analysis process. A
visualization tool can provide a spatial view of the
data, and enable the user to drill down into further
views of more abstract business information not
necessarily associated with a map.
Applications incorporating AVS visualization can access
multidimensional data from SDE and relational databases,
and thus extend spatial analysis to a greater range of
problem domains. AVS/Express offers 3D functionality
beyond the surface modeling provided by the ArcView 3D
Analyst. In addition to its visualization techniques,
AVS/Express provides a true 3D data model that can be
applied to a variety of multidimensional problems. The
fundamental difference between AVS/Express and ArcView 3D
analyst is the data model. 3D Analyst supports
triangulated irregular networks (TINs) to model
variations in a surface. AVS/Express uses a more generic
3D data structure called a field. The field data
structure supports a number of mesh types to represent
data from a broad range of application domains, such
imaging, engineering, defense, finance, and
telecommunications. Meshes can have many different forms,
from the simplest uniform mesh having equidistant nodes
and rectilinear meshes where node spacing is defined
along the edges. A structured mesh has each node location
separately defined but the node connectivity can be
assumed. With an unstructured mesh, the connectivity
information must be supplied along with the node
location. At each node an unlimited number of attributes
values can be present. With a visualization data model,
visual data analysis, including a spatial data component,
can be applied to a variety of multidimensional problems.
The analysis of complex data is facilitated through
familiar and innovative multivariate information
displays. These visual data representations are even more
powerful when they can be interactively used to uncover
additional sources of information. Advanced Visual
Systems’ products support a two-way drawing pipeline
that allows all graphics objects to serve as hotspots, or
links, to further processing. Visual objects can be
probed to reveal exact data values, or picked to drill
down on finer grained views of the data. Interesting
areas of the display can be selected and zoomed in on, or
flown through for closer investigation.
Information is often discovered in haphazard ways.
Interactively enabled displays promote information
discovery by enabling the viewer to pursue data
relationships through multiple or modified views of the
data. Each new view is invoked by intuitive use of the
mouse. The power of many information discovery
applications comes not from the use of sophisticated
displays, but from the sophisticated use of display
interactively to promote the data analysis process. In
this respect, the highly interactive nature of
visualization tools offers a distinct functional
advantage, even for data with a relatively low number of
attributes.
The combination of spatial and multidimensional analysis
provides an effective way to search for and identify
important information and monitor critical business
operations. Spatial information, such as that found in
spatially enabled databases and geographic information
systems, can provide important geographical reference
points for data analysis and presentation. Visualization
tools enable GIS-type information to be combined with
multivariate information from business data repositories,
and provide views and insight into data not obtainable
from a purely geographical perspective. Spatial analysis
combined with multidimensional data analysis in the same
application is a powerful means of discovering
information.
DIFFERENT APPROACHES TO
APPLICATION DEPLOYMENT
Data visualization can greatly
enrich the functionality of business applications such as
Executive Information Systems, Decision Support Systems,
and Customer Care Systems. The usability and acceptance
of these applications on the desktop can vary depending
on how the applications are designed and how the visual
operations are implemented. Visual tools embedded in
desktop applications are intended to help the user absorb
information in larger quantities, and in less time. The
mind is quick to identify visual patterns and shapes.
However, as more information is represented, patterns in
a scene can become so numerous and abstract that the
ability of the viewer to comprehend what is being seen
can be diminished rather than enhanced. One of the major
challenges of visual techniques is to find interfaces and
display formats that maximize information content in
applications without introducing corresponding levels of
application complexity. Visual tools, in addition to
representing information, can act to simplify an
application’s user interface, and by so doing,
contribute to the application’s acceptance on the
business desktop.
AVS/Express shields the user from data access commands by
enabling data retrieval operations to be easily
implemented as interaction with the display. AVS/Express
provides modules that support the full functionality of
SDE from within its object-oriented, visual programming
environment. Connectivity and transaction processing with
SDE and the underlying SQL database can be fully
implemented from within AVS/Express. The API to SDE is
encapsulated in AVS/Express modules, enabling the
connection to the database and data access operations
such as query and update to be easily added to an
application by inserting these modules into the visual
application network. The AVS/Express network provides a
visual representation of application logic.
In Figure 9, a visual application network is shown,
including modules to access SDE data. Modules are used to
dynamically connect to SDE and add data querying to the
application. In this example, the data is extracted with
a visual query to SDE and visualized using a viewer
module. The full functionality of SDE is accessible, but
the API to SDE is hidden from the user. An application
built this way can be run, or modified, without compiling
and linking.
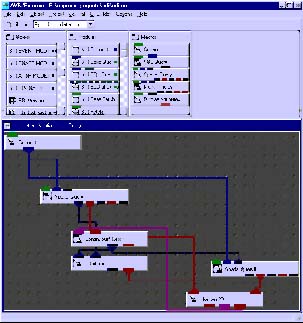
Figure 9
AVS/Express modules provide dynamic connection to SDE
The AVS/Express development system
allows applications to be rapidly prototyped. In addition
to the database connectivity and the application code,
AVS/Express can also be used to develop cross-platform
user interfaces. For example, menus and forms used for
user input are easily constructed using the AVS/Express
GUI kit, and provide can another interface for accessing
data and controlling the application. When run under
Windows, the AVS/Express-built application interface is
instantiated as a Windows GUI; under UNIX the same
application would have a Motif GUI.
From the AVS/Express environment, developers can also
encapsulate existing legacy code, such as analysis
algorithms written in FORTRAN, C, or C++. Once tested,
the completed application can be output as a binary
executable, or as C++ or ActiveX components. Deployment
can be in the form of a new application, an application
component, or a web-based client-server implementation.
Powerful, database-enabled applications can be quickly
deployed using AVS/Express. Because the sophisticated
data model provided by AVS/Express can represent all
types of, and dimensions of, data, the visualization tool
can easily operate on data from SDE and various other
sources, including relational databases, data warehouses,
dynamic data feeds, and files output from other
applications. Visualization tools are therefore often
used to integrate diverse data sources and analytical
processes in a single application.
The power of a desktop information discovery application
is increased when the user can access numerous types and
sources of data, and perform various analytical
operations on this data from within a single application
environment. The application stories presented in this
paper were tailor made, integrating in-house developed
algorithms and analysis code with transparent access to
diverse data sources. In each case, the result is
powerful, focused functionality combined with ease of use
that helped ensure the success of these applications, and
the new techniques that they provided, among their
respective users.
CONCLUSION
The Esri Spatial Database Engine
extends the relational database with spatial techniques,
allowing data to be accessed with intuitive and accurate
spatial queries. When combined with the AVS/Express
application development system, companies with large
repositories of geographical and business data can
rapidly develop and deploy applications that visually
query and drill down on data, and turn complex
multivariate relationships into easy to comprehend visual
displays.
"AVS is a forward-thinking innovator of world-class
three-dimensional visualization and data products,"
says Jack Dangermond, president, Esri. "By taking
advantage of AVS's three-dimensional visualization
technology expertise, we can offer through SDE the most
advanced solution available for storing and viewing
two-dimensional and three-dimensional data in a fast,
efficient manner. Businesses can gain a competitive
advantage by harnessing the power of our combined
technologies."
ABOUT ADVANCED VISUAL SYSTEMS
Since 1992, Advanced Visual Systems
has helped hundreds of global organizations turn data
into visual insight through innovative visual information
solutions. Advanced Visual Systems, an Oracle business
partner, specializes in developing custom applications,
and application components, for discovering and
visualizing information stored in relational,
multidimensional, and spatially enabled databases. In the
face of today’s massive data explosion, products and
services from Advanced Visual Systems are enabling
organizations to turn their data in information, improve
information access, and use information to make better
business decisions.
Professional Services consultants at Advanced Visual
Systems have expertise in a range of industries and data
processes. They understand the application of
visualization technology as well as problem areas
inherent in specific industries. With this exceptional
team of visual application development experts, and
proven, multi-platform software tools, Advanced Visual
Systems offers the fastest route to deploying powerful
business information solutions. For more information
about Advanced Visual Systems and its products and
services, visit our website at http://www.avs.com, or contact Advanced Visual Systems’
U.S. headquarters by telephone at 781-890-4300 or by
email at info@avs.com.
|