Bruno Astori
Dipartimento di Scienze e Tecniche per i
Processi di Insediamento, Facoltà di Architettura,
Politecnico di Torino, Viale Mattioli 39, 10100 TORINO,
tel. +39(0)11 5644382, fax, +39(0)11 5644399, E-mail astori@araxp.polito.it Gabriele
Garnero
Dipartimento di Economia e Ingegneria
Agraria, Forestale e Ambientale, Facoltà di Agraria,
Università di Torino, Via Leonardo da Vinci, 44, 10095
GRUGLIASCO (TO), tel. +39(0)11 6708601, fax, +39(0)11
6708609, E-mail topog@aerre.it
Ursula Zich
Dipartimento di Scienze e Tecniche per i Processi di
Insediamento, Facoltà di Architettura, Politecnico di
Torino, Viale Mattioli 39, 10100 TORINO, tel. +39(0)11
5644367, fax, +39(0)11 5644399, E-mail zichu@araxp.polito.it
Abstract
The conjectural
philological survey of urban centres, devised at the end
of the Seventies by a research group headed by Prof. A.
Cavallari Murat of the Turin Politecnico is based on a
perceptive analysis of the entities that made up the
urban texture of an urban centre.
The information obtained, coded according to standard UNI
7310/84, is in the form of a graphical representation in
which the various themes are rendered through colouring,
point symbols, different line styles, and a certain
number of labels. The above-mentioned UNI standard admits
a single subjective interpretation of conditions that are
deemed pathological for the urban texture through a
two-colour representation. With the use of GIS-based
tools it becomes possible to create two closely
interlinked information structures: a database and a
map-generating system. The database has the potential of
storing all relevant information that may be of use,
enabling the researcher to browse through the data,
submit queries and handle the outcome of the search.
Furthermore, the database can also generate maps, which
in their turn are linked to the database, so that the
latter can also be explored through direct hot-links on
the maps. This makes it possible to produce diversified
representations. A new interpretation of standard UNI
7310/74 has been developed, on the basis of a study
conducted in connection with a survey of the historical
centre of the City of Carignano, a small town
characterised by significant medieval and baroque
elements. This new interpretation serves as the basis of
new analyses, focusing on the structuring of the urban
texture, the detection of degnerative aspects, a
diachronic perception of the way the city centre has
evolved over the centuries.
INTRODUCTION
Conjectural philological survey is
a technique that came into being through the studies
promoted by a research team headed by Prof. Augusto
Cavallari Murat, of the Turin Politecnico, in the late
Sixties: the city is perceived not merely as a set of
building containers, but rather as an unbroken cultural
fabric, which can be rendered and interpreted through a
special form of cartographic representation.
The possibility of expressing the urban configuration
through a series of thematic maps had been the initial
objective of the research project: the primary aim being
the possibility of transferring the knowledge of the
elements which had characterised the urban transformation
process and which still determined its perceivable
aspects.
To meet this need, it proved necessary to develop ad hoc
notions and to define a series of graphic conventions.
A number of application experiences, such as the survey
of baroque Turin and a study of the transformation of
Piazzetta Ruccellai, in Florence, led to the coding of
standard UNI 7310/74, i.e., a set of graphic symbols that
would make it possible to "read" the city as it
is at present and at the same time highlight the presence
of the past.
Later one, whilst still working on the fine-tuning of
symbols for the representation of urban transformations,
the research team proposed a new interpretation of
standard UNI 7310/74.
In the preparation of a map for the analysis of the urban
context of the City of Carignano (see fig. 1), in the
late Seventies, Prof. Cavallari Murat’s research
team applied the previously coded standard, supplemented
by the use of a two-colour scheme for thematic rendering.
This map was prepared by working on a 1:250 scale and was
printed with a reduction of 1/4, i.e., on a 1:1000
scale).
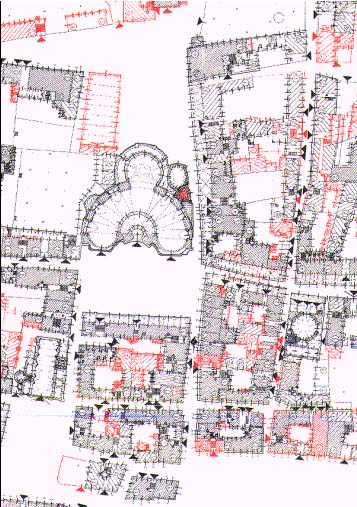
Figure 1
The map of the historical city centre of Carignano
prepared by the research team of Prof. Cavallari Murat
As a support for the historical
information, they relied on an abstract from a napoleonic
map of the 19th century, and added a colour (red) to
highlight the stylistic incongruence of subsequent
transformations; through the use of this two-colour
scheme the map offered a single, partly subjective,
interpretation of conditions deemed pathological for the
urban texture: the introduction of the red colouring was
justified by the need to have a single map embody a
survey of a "dynamic" nature.
The choice of graphic symbols and a 1:250 representation
scale ware prompted by a desire to achieve a stereometric
reading of the territory.
The map prepared in this manner made it possible to read
the routes, the accesses, the horizontal and vertical
distribution structures.
GIS-BASED TOOLS IN TERRITORIAL
ANALYSIS
Starting from this wealth of
studies and experiences, our investigation focused on the
use of GIS tools for the management of data reflecting
the transformations of the urban texture.
The multi-purpose and multi-user nature of the GIS system
permits a critical approach to the territory: data of a
great variety of types can be filed for the same surface,
and several query keys can be used over the same quantity
of elements. The geo-cross-referencing of the data and
immediate data visualisation make for a total fruition of
the results, so as to meet the requirements of
investigations of all sorts concerning the urban texture.
Taking the lead from a critical re-reading of the
conjectural philological survey of the City of Carignano,
while we wait to be able to take advantage of a new
numerical map-generating technique for the acquisition,
storage, control, integration, processing and spatial
representation of data, for the time being we have
concentrated our efforts on the definition of a set of
symbols suitable for use with GIS tools.
Logically, enough, in shifting from paper to EDP media,
the problems to be addressed in connection with choice of
symbols are altogether different.
The problem of the coding of the descriptive and symbolic
elements for a paper map arises both from the need to
ensure that the potential metric-descriptive information
is always readable, and from the requirement of a
univocal interpretation of the map itself regardless of
type of user.
Studies concerning the search for a universal graphic
convention for map drafting have long since demonstrated
that some elements belong univocally to a given scale of
representation rather to another.
Since its creation, the Italian Geodetic Commission has
worked on the representation of the territory on a
medium-to-large scale, by emphasising the need to define
a specific graphic convention for each representation
scale through detailed analyses and investigations.
This Commission also proposed the compilation of
questionnaires for the determination "what a map
should/should not contain" to be submitted to people
belonging to different user basins. In connection with
the creation of a database, having identified 10
different sets of homogenous contents, questionnaires
were compiled in relation to the specific character of
the map and the scale of representation.
Having selected three scales (1:2000, 1:1000, 1:500), a
basic goal of the investigation was to identify
positively essential as opposed to definitely superfluous
elements.
The need to ensure the simultaneous presence on a single
map of all signs relating to a given scale of
representation prompted the definition of thematic maps
enabling the quantity of data associated with specific
topics to be reduced.
The use of GIS tools now makes it possible to produce
geometric entity databases to file all data of interest,
while making sure that the legibility of the data is not
undermined by their very density. The possibility of
interrogating the geometric entities - and hence the
possibility of assuming that there is no need to render
all the entity-related features in graphic form - enables
level "0" to serve as a matrix for an infinite
number of thematic maps and at the same requires that the
utmost attention be paid to the choice of scale of
representation and the ensuing graphic conventions.
The objective underlying the approach adopted in our
investigation was to define a territorial data filing
system which might lend itself to a multiplicity of uses,
in addition to the customary uses of information systems
as are typical of municipal administration practice (town
planning applications, management of technological
networks, aspects to do with the management of local
taxation, etc.); we tried to fine-tune a system through
which the geometric entity database might become
significant for historians as well as people studying
architectural themes in the urban context. Ultimately,
the possibility of handling different thematic strains
and formulating queries with different search keys makes
for a diversified exploitation of the geometric supports:
the double "valence" of the database, i.e, its
ability to manage the material at data level to answer a
query and to present the data in graphic form, makes for
a greatly improved fruition potential.
Querying capability was a decisive consideration in the
choice of the information support for the management of
the data: a database, in fact, makes it possible to
increase the quantity of data to be filed and sets no
limits on the queries that can be submitted; a hypertext,
instead, would impose a pre-determined path, designed by
the author while creating the hypertext.
A CASE STUDY: THE CITY OF
CARIGNANO
For the transposition of the
philological survey data concerning the historical city
centre of Carignano onto magnetic media, it was decided
to work on a 1:1000 scale to be able to file
simultaneously all the elements contained in the
available thematic map, from which most of the
information had been drawn.
To the contents already present on the paper support
taken into consideration, other elements were added,
concerning the uses of building volumes, their reading
from the outside and the periods of construction.
The release from a fixed theme - a typical feature of
paper maps - makes it possible to use colours and fields
to obtain an infinite number of combinations to be
associated with as many possible querying keys; the
introduction of the toponymic data and the relative
street numbers for the characterisation of accesses is
meant for a wider spectrum of possible users.
If in the original Cavallari Murat survey the red lines
were used to reflect and highlight the relationship with
pre-existing structures, with the GIS tools the purpose
of using colours for the fields depicting the areas
defined in the data filing support is to identify the
different historical phases and hence to make the
evolution of the urban structure perceivable.
As is done on the paper support, the geometric entities
are rendered with fields recognisable thanks to different
line styles, and are labelled with area, linear and
punctual symbols; the difference lies in the fact that
the database makes it possible to manage a considerable
amount of data, which are available for simultaneous
consultation at different interrogation levels.
By taking into account that the support used was produced
through the conversion into digital form of the 1:250 map
(reduced to 1:1000), a basic step in the process of data
filing was the decision as to which data should be
maintained as basic geometric elements. Some of the
symbols present in the 1:250 scale map, in fact, would
cause a cognitive overloading phenomena if we tried to
introduce them into a 1:1000 scale map, whilst they are
important as data to be made available for consultation
by the users interrogating the database. The digital
conversion process was extended to:
- all the buildings, areas under
cover, yards;
- green areas;
- covered paths, such as
porticoes, tunnels and driveways at ground level;
- interior building areas taken
up by vertical distribution elements.
Following this process, topology
features were created and the relative data were entered.
The correction of imperfections in the digitisation
process, the creation of the topology features and the
structuring of the data were achieved by means of the
ARCAD software.
In the conjectural-philological surveying method created
by Prof. Cavallari Murat’s research team, area
fields were used to reflect the different heights of
building; the numbers within the field, enclosed in a
circle, or in a triangle for storeys originating from
subsequent super-elevation works, indicated the number of
storeys above ground of the individual buildings. In our
information system, the area is associated with this type
of information at attribute level, i.e., as data which
can be obtained by submitting a query to this effect.
Different types of field are adopted instead to show the
destination of a building or area. Field colours are used
to reflect the recognition of the different stages of
evolution of the urban texture and structural type
transformations.
As soon as the fields have been defined and have become a
fixed presence in the basic support, it proves necessary
to decide what other signs may coexist within a geometric
entity without undermining the legibility of the data.
Inside the perimeters we still have the information
concerning the presence of covered passages, such as
entrance halls or porticoes, but vaulted covers are no
longer defined, this feature having been introduced as a
specific property of the area, which can be rendered in
graphic form (through suitable symbols) by submitting a
query.
In terms of linear symbols, different choices had to be
made compared to the reference paper support where the
double line defining the boundaries of a building -
characterising the roofing/elevation structural node -
hampered the perception of full/empty relations. The same
information is given as a property of the line itself and
can be accessed only by querying; this applies to many
other characterising elements of the front views, such as
the distribution of the openings.
The presence of the axes of the windows in a typical
storey, occasionally enriched with the total number of
the openings over the entire elevation (expressed in the
reference graphic documents as a number enclosed in a
rectangle), did not provide sufficient indications to
figure out the actual distribution the openings;
therefore it has been replaced by considerations such as
the hierarchical, rhythmic, symmetrical or mirror-like
arrangements of the openings, all of them expressed as
data that can be looked up by submitting a query to this
effect.
The accesses to the buildings, graphically represented in
the reference maps by means of different types of arrows,
have been replaced with the indication of the street
numbers, to serve as an added tool for administrative
purposes.
The introduction of toponymic data (street names and
numbers) makes it possible to read the urban values as a
function of specific research areas, bringing out the
various transformations that have taken place in the
urban texture.
This aspect is exemplified by three significant
investigations.
Fig. 2 - a query by address
concerning area coverage makes it possible to grasp the
existence of a hierarchy governing the road axes, and to
identify the one that can be rated as the matrix route as
opposed to the other main axes. From this query, it
proves possible to perceive at once the role played by
the "roads" in the different successive
expansions of the city texture. Whether to assign an area
to one road rather than any of the adjacent roads is
determined solely by the access to the area itself; when
an area has several access points, it was decided to take
into account only the most important. Even the evolution
of the housing cell, from the construction of new wings
of a building in the area of belonging, to the break down
and/or re-aggregation of several buildings according to
the requirements arising from progressive socio-economic
transformations, can be looked up by interrogating the
database.
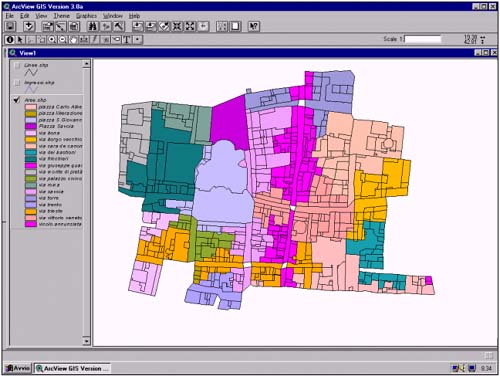
Fig. 2 Interrogating the area coverage by address.
Fig. 3 - a query by use and
street number concerning area coverage (and/or by
address/access concerning linear coverage) makes it
possible to correlate different aspects in the evolution
of historical city centres. A typical instance of this is
the arrangement of church buildings and the creation of
spaces in front of them, for their complete perception
and fruition. It was decided to take into account the
following uses:
- housing areas
- public use area
- area for worship
- military use area
- portico
- yard
- vertical distribution (stairs)
It was also decided to interrogate
the database by "street number" and to have
this field appear through a punctual indication, to be
extended to all the internal volumes leading to the same
access; the road labels, which have been left out in
order not to undermine map readability, can be readily
looked up and expressed in graphic form as shown in Fig.
4. As for the information of an administrative nature,
the data concerning direct or internal road accesses have
been connected with the lines; this might give rise to
inconsistencies in the representation when some of the
lines, clearly opening on a given road, have the property
of belonging to a different one. From a query concerning
the lines it is therefore possible to bring out only
either the external envelope or the entire internal
redistribution of the areas by turning on or off the
elevations relating to "int." roads.
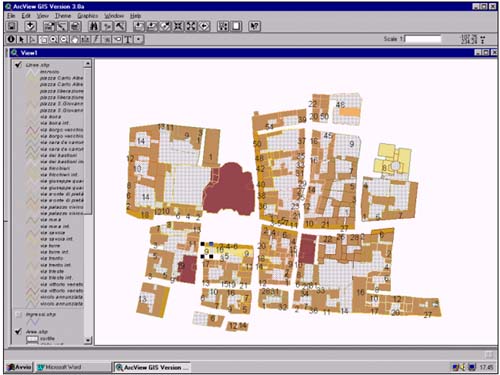
Fig. 3 - Interrogating the area coverage by use and
street number; and/or the linear coverage by
address/access.
Fig. 4 - zooming in on the query
concerning area coverage by use and street number to have
the address labels appear; detail of the area in front of
the Cathedral. The choice of not providing a double
interrogation key to display both the street numbers and
the addresses simultaneously on the map was motivated by
considerations to do with the legibility of the data at
the different scales. In Fig. 2 road labels have not been
activated, but this can be done at any time, as borne out
by the detailed view depicted in Fig. 4. Each individual
geometric entity included in the graphic support (areas,
lines, points) can be described in greater detail through
the application of ad hoc labels, which can be applied or
removed instantaneously.
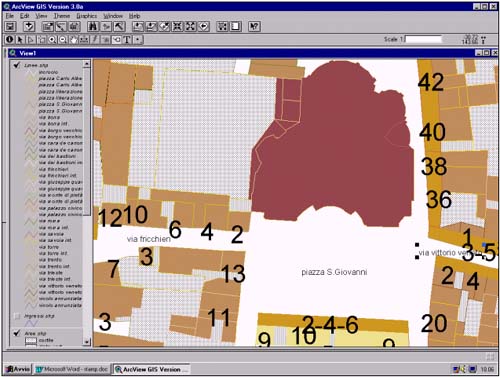
Fig. 4 - magnified view of the query concerning area
coverage by use and street number, with the address
labels applied.
Fig. 5 - a query by number of
storeys concerning area coverage offers an immediate
perception of volumetric values in historical city
centres. Full and empty spaces take on an identity which
calls for an interpretation: for instance, the yards and
squares should both have the same value
("zero") in terms of number of storeys. In
actual fact, the yards, which are generally crowded with
roofings and sheds, have been assigned the corresponding
numerical value, whist squares (as well as roads and
cross-roads) have not been assigned any numerical value,
so that they cannot be queried at all. The definition of
a field for the "number of storeys above
ground" poses a problem when dealing with church
buildings.
These structures, in fact, have an outside volume which
can be likened to an appreciable number of storeys above
ground, but from the inside this correlation is not as
straightforward. it was decided to diversify the
different interior areas of a church building, by leaving
their volumetric properties unaltered: for instance, the
stairwell is assigned a given number of storeys above
ground and the naves are assigned a different number.
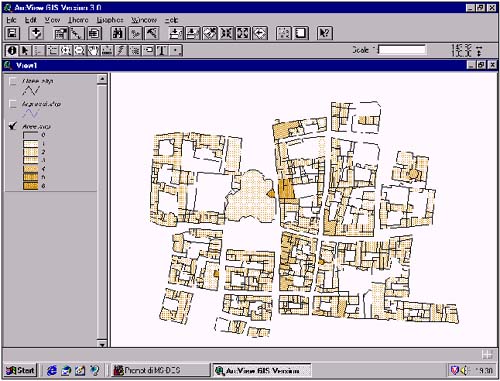
Fig. 5- Interrogating the area coverage by number of
storeys.
CONCLUSIONS
The study will be carried on to
devise better ways to integrate the data of
administrative interest. In addition to continuing work
on the digitisation of existing documents, obviously of a
two-dimensional sort, further tests will be extended to
maps obtained through direct numerical photogrammetric
restitution, i.e., to documents that retain their
three-dimensional content in its entirety.
REFERENCES
- G. Caniggia, Strutture
dello spazio antropico, studi e note,
Uniedit, Firenze, 1976
- AA. VV., Carignano: appunti
per una lettura della città, Ricerca a cura
del Museo Civico "G. Rodolfo",
Carignano, 1981.
- M. Docci, D. Maestri, Il
rilevamento architettonico. Storia, Metodi e
Disegno, editori Laterza, Roma 1984.
- L. Marescotti, A. Canevari, La
cartografia per l’urbanistica e
l’architettura, CLUP, Milano, 1985.
- AA.VV. La rappresentazione
del territorio a grande scala, Centro
Interregionale di coordinamento e documentazione
per le informazioni territoriali, Documenti del
territorio, supplemento al numero 3-4/1986, Roma,
1986.
- AA.VV., GIS e
pianificazione urbanistica, edizioni Il
rostro, Segrate (MI), 1996.
- AA.VV. Carta Tecnica
Regionale Numerica, Regione Piemonte,
Servizio Cartografia, Aggiornamento, 1997.
- Documentation of ARCAD and
ARCVIEW, Esri.
|