 |
| USING ArcInfo FOR VALORISING ECOTOXICOLOGICAL DATA IN A SURFACE WATER MONITORING PERSPECTIVE |
| Isabelle Halleux and
Claire Van Der Wielen Institut Scientifique de Service Public (ISSeP), Rue du Chera, 200, B-4000 Liege, Belgium, tel (+32-4) 252 71 50, fax (+32-4) 252 46 65, environnement@issep.be Abstract In Wallonia, the ecotoxicological tests have been chosen as complementary descriptive data of chemical and physical parameters for the monitoring of surface water quality. As they are able to take into account interactions between chemicals and the environment, they allow developing an integrated approach of risk assessment. ArcInfo environmental databases and functionalities are tools used in this way. INTRODUCTION ISSeP is commissioned by the
Walloon Government of Belgium to manage several
monitoring networks of the quality of the environment
(air, water, waste deposits, Figure 1). A physical and
chemical monitoring program of the rivers has been
developed, according to Belgian norms as well as to
European directives related to the quality of surface
water. Since 1994, ISSeP has to perform the sampling and
the analysis of about 90 parameters on 140 points sampled
every 4 weeks, to manage the data and to present the
results. Even if no regulatory constrain still exist on
ecotoxicity, a complementary program involving toxicity
tests measurements has been early implemented in order to
describe the biological adverse effects of toxic
pollution.
THE ECOTOXICOLOGICAL DATA Ecotoxicology is "the science
of toxic substances in the environment and their impact
on living organisms" (Jorgensen, 1990). In our
approach, the ecotoxicological monitoring consists in
measuring in lab the effects of surface water samples on
organisms, using microbiotests or conventional tests and
to interpret the results in terms of water pollution. ECOTOXICITY AT A SMALL SCALE: THE MEUSE AND SCHELDT BASINS Since 1994, about 1500 acute
toxicity data have been recorded on 70 given sampling
points; only 9% are toxic. A classical thematic mapping
seems to be convenient for having a quick overview of the
water quality at this scale. As the sampling points are
fixed and the data density is too low for performing
studies in space such as drawing toxicity profiles along
rivers or evaluating detailed impact of industries, the
valorisation of the results seems to be restricted to the
study the intensity and frequency of the toxic pollution
and the interpretation of the results according to
chemistry of the water samples. The best data model seems
to be of network type (line and point topology) with
dedicated attribute tables even if the dynamic
segmentation model with toxicity results given as events
is an interesting one (Halleux, 1996).
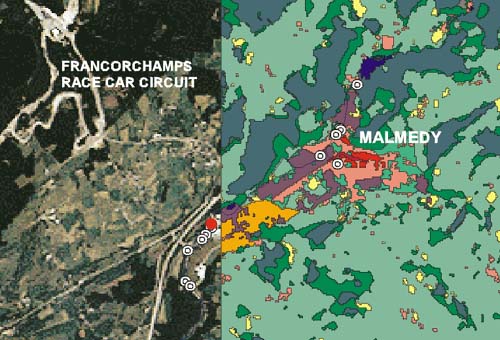
ECOTOXICITY AT A LARGE SCALE: THE WARCHE RIVER IN MALMEDY In 1994, the Warche river showed
toxic events that seemed to be inconsistent with the
"good quality" of the river given by its
chemical quality index (DGRNE & ISSeP, 1995) and
macroinvertebrates biotic index (Vanden Bossche, 1994). A
detailed study has been implemented in order to
understand this paradox and to propose reliable
measurement points. Three waste water discharges were
identified as main sources of water pollution (2 are from
paper factories, 1 from a municipal water treatment
plant) and characterised using a battery of tests in
order to identify causal sources, to estimate the risk
and to choose the most appropriate bioassay(s) for
effluent monitoring and further ambient monitoring.
The bar chart of the acute toxicity (Figure 4), drawn from the point attribute tables, allow classifying the effluents: in decreasing order of toxicity, Paper Factory 1, Paper Factory 2, Municipal water treatment Plant. The toxicity of the last industry during Survey1 is still surprising but can be explained by the chromium remaining after treatment of effluents from a tannery closed before Survey2. The effluents of the paper factories are toxic to highly toxic.
Figure 4 The analysis of toxicity against
chemistry allows to classify the biological systems into
two classes: the first one includes only Daphnia magna,
related to aluminium; all the other tests are grouped in
the second one. The results indicate that Raphidocelis
subcapitata is the most sensitive test in this case
study. Brachyonus calyciflorus (Roxtoxkit) and Vibrio
fischeri (Microtox) are also good indicators of the
effluent toxicity. The chemistry of the effluents is
characteristic of the industrial activity: richness in
ammoniac nitrogen, phosphorus and boron for the municipal
plant, high content in organic nitrogen and aluminium for
the paper factories.
Only the Microtox and Rotoxkit systems were used on 16 samples taken the same day along the river (Figure 6); the conventional algae test is not used because of the lab capacity limits.
Using point events of Dynamic Segmentation allows drawing a cross-section of the river toxicity. The toxic plume is well described by the Microtox response. Crossing the ecotoxicological, physical and chemical data shows that water conductivity is a good indicator of the discharge in the river (Figure 7). The location of the chemical network sampling point (far from PF1, upstream PF2) has to be revised for providing a more reliable information about the water quality.
The toxicity information is be finally overlaid with thematic maps, like topography, land use, ecosystems or critical loads maps (Eloy, 1998), in order to integrate other useful parameters for estimating the impact of effluent toxicity on the vulnerability of aquatic systems. A more precise estimation of the risk requires however a more accurate description of the effluent variability and river flows. DIFFUSION OF RESULTS Until now, toxicity results are sent quarterly as numerical reports to the Authority. The annual report, formatted as HTML-files, covers the interpretation, the detailed studies and the new researches. Developments are performed in order to provide on-line results with comments and maps on the Web using MapObjects and ArcView IMS. CONCLUSION Ecotoxicology provides a reliable and efficient support for water pollution risk assessment at different scales: global monitoring of water quality, measurement and control of effluents toxicity, study of spatial spread-out of toxic plume, estimation of the impact on ecosystems. Within ArcInfo, a computer-aided decision support has been developed on the basis of GIS functionalities and ecotoxicologist expertise. Further improvements will integrate a more systematic use of this application. REFERENCES
|
     |
    |
 |
| [Introduction] [Conference programme] [Presentation by authors] [Presentation by category] [Poster session] [List of european Esri distributors] [List of exhibitor] [Esri products news] [Credits] |