 |
| SPATIAL
ANALYSIS OF WATERWAYS Analysis of traffic (cargo) -flows and the consequences of unloading of inland vessels in the Netherlands using the Geographical Information System (GIS) |
| René Visser Ministry of Transport, Public Works and Watermanagement http://www.minvenw.nl/ Transport Research Centre, Waterway Engineering Division, P.O.box 1031, 3000 BA Rotterdam, the Netherlands, tel (+31)102825869, fax (+31)102825856, r.a.visser@avv.rws.minvenw.nl SPATIAL ANALYSIS OF WATERWAYS In the late 1995 shipping and waterway data was made assessable with GIS tools. As a result, it was possible to conduct specific analyses using GIS. The analysis of traffic (cargo) -flows and the consequences of a treaty that deals with cargo residues is one of the component projects of the Spatial Analysis of Waterways project. INTRODUCTION OF THE DUTCH WATERWAYS AND INLAND SHIPPING For its size, the Netherlands has
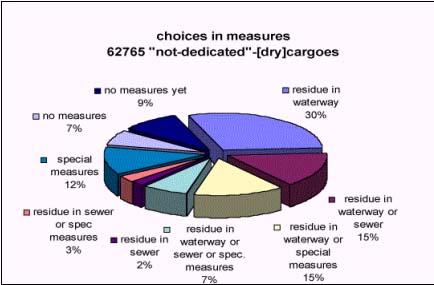
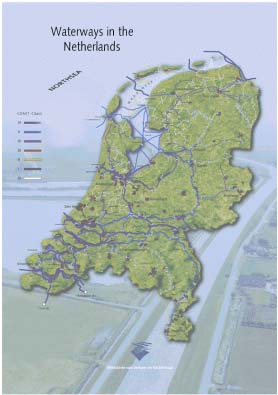
more waterways than almost any other country. The The Netherlands has 4800 km of waterways suitable for the transport of goods. Barges are ideally suited for the transport of large quantities of cargo. They have little environmental impact and the infrastructure still has capacity. Approximately 40% of the international freight transport to and from the Netherlands (excluding transport by sea) is by barge. The share of domestic transport is just under 20%. Altogether inland shipping transports 290 million tonnes per year within and through the Netherlands. The registered Western European inland shipping fleet has more than 11,000 vessels and a total cargo capacity of 11 million tonnes. Almost half this fleet, approximately 5000 vessels with a cargo capacity of 6 million tonnes, sails under the Dutch flag. They come in all shapes and sizes, from the smallest traditional barge of 300 tonnes up to six-unit push convoys carrying 17,000 tonnes. Barges can transport general cargo, bulk goods, and dry and liquid cargoes. There are also vessels that have been equipped for special cargoes, such as cement barges and tankers for liquied gas. An appropriate vessel can be found for any cargo! THE PROJECT "SPATIAL ANALYSIS OF WATERWAYS" This project explores the possibilities of integrating and analysing the numerous types of data relating to shipping. In short, the aim of the project is to conduct spatial analyses of shipping and the waterway network, investigate their applicability, and improve our understanding. The analysis of traffic flows and the consequences of unloading of inland vessels in the Netherlands makes use of information from the IVS90 system. THE IVS90 SYSTEM AND SHIPPING STATISTICS IVS90 is the Information and Tracking System for Shipping. Its aims include making the circulation of shipping safe and smooth, dealing with shipping accidents effectively, and compiling statistics. When vessels enter the IVS90 area, they report their presence and are tracked as they sail through it. The IVS90 area consists of 90% of the main waterways in the Netherlands. This IVS90-network is made up of a collection of IVS90 "sections" which are linked to the Transport Research Centre's digital waterway network. Some of these IVS90 sections are locks, where data is recorded on every commercial vessel that passes through. This data relates to the voyage, the cargo, and the vessel itself. Locks in the IVS90 network provide comprehensive information, and have served for many years as an important source of shipping statistics. As is stated above, a great deal of data is available on transport by water. However, it always relates to one point (a lock) in the network. Collating data from all the IVS90 sections generates information on every voyage's chosen route. This information can be used to obtain shipping statistics on all IVS90 recorded voyages undertaken during a particular period. It is known which IVS90 sections have been passed through on every voyage. Since the IVS90 sections have been placed in a GIS environment, it is possible to represent the voyages on a map.*) By making selections from the total collection of voyages, specific flows of traffic on the IVS90 network can be represented in a visual form. *) As a spin of of this project VOIR (View of IVS90 Routes) has been developed. VOIR shows the semi actual density on the IVS90network.see: http://voir.iway.nl/voir/ivoir2.htm VESSELS’ PLACES OF DEPARTURE AND DESTINATIONS ON A MAP When a vessel reports its presence, it records its place of departure and destination. The locations stated are translated into an IVS90 place code, which is very similar to the CBS municipality code. These CBS codes are also to be found on the digital maps of municipal boundaries in the Netherlands. Unfortunately, the codes are not always identical. Such discrepancies came to light in various analysis’s of shipping data, which charted points of departure and destinations. The analysis also uncovered the absence of a European digital map with municipal boundaries (and accompanying place codes). Many voyages have a foreign point of departure or destination, which meant that a solution had to be found. Foreign place codes have been recoded into country codes and then added to the map of Dutch municipal boundaries. ANALYSIS’S CONCERNING WATERBORNE TRANSPORT AND THE CONSEQUENCES OF UNLOADING OF INLAND VESSELS How is the waterway network used? Where do which types of vessel sail, and with what types of cargo or draught? Policymakers have often expressed their wish to know more about flows of goods by water. In advance of the ratification of a EU treaty which deals with the handling of cargo residue. AVV was asked to make use of this newly developed method and analyse the consequences of the treaty on unloading of inland vessels at discharging-berths in the Netherlands. This treaty gives the members of the EU a choice in taking measures for the handling with various types of cargo residue, like discharging on the waterway, sewer or taking special measures. The number of required.provisions will depend strongly on these choices. The main questions in this project were:
WORK OUT To get the result the next steps were taken.
CONCLUSION GIS tools have proven to be very useful. The IVS90 data have been transformed, using GIS, to voyage information. Furthermore, the maps show very clearly where provisions will be needed and of course, the map can be used to determine where provisions can be clustered for economic reasons. |
     |
    |
 |
| [Introduction] [Conference programme] [Presentation by authors] [Presentation by category] [Poster session] [List of european Esri distributors] [List of exhibitor] [Esri products news] [Credits] |
 Netherlands
provides natural access to a large part of continental
Europe because of its location at the mouths of several
major European rivers. No wonder inland shipping occupies
an important position in the transport of freight to and
from the hinterland.
Netherlands
provides natural access to a large part of continental
Europe because of its location at the mouths of several
major European rivers. No wonder inland shipping occupies
an important position in the transport of freight to and
from the hinterland.