 |
||||||||||||||||||||||||||||||||||||||||||||||||||||||||||||||||||||||||||||||||||||||||||||||||||||||||||||||||||||||||||||||||||||||||||||||||||||||||||||||||||||||
| AN ARC VIEW BASED APPLICATION FOR THE CLASSIFICATION OF LAND PRODUCTIVITY ASSESSMENT AND RISK ZONES IDENTIFICATION IN DEVELOPING COUNTRIES | ||||||||||||||||||||||||||||||||||||||||||||||||||||||||||||||||||||||||||||||||||||||||||||||||||||||||||||||||||||||||||||||||||||||||||||||||||||||||||||||||||||||
| Marco Benvenuti Applied Meteorology Foundation, Via G.Caproni 8, 50145, Firenze, Italy, tel +39 55 301422, fax +39 55 308910, benven@sunserver.iata.fi.cnr.it Carlo Di Chiara Andrea Di Vecchia Lorenzo Genesio Maurizio Romani Abstract Italian Co-operation has funded the "Project for Evaluation of the Interventions of Conservation and Recuperation of the Environment – PEICRE" (1994-1997), aimed to study the changes on the ecosystem produced by a number of relevant interventions carried out by the " Project of Rural Development of the Ader Doutchi - Maggia – PDRADM/FAO" in Keita valley in Niger, from 1984. The classification of the land in risk areas is a useful tool for the evaluation of interventions of environmental recovery and for the decision making. The study of the ecosystem based on time series of relevant environmental parameters, derived by remote sensing analysis and GIS elaboration, allows a qualitative and quantitative evaluation of the interventions and the evolution trend of the environment. The project built up an Environmental Information System, running on ArcView, able to manage different types of data from different sources (demographic, climatic, agricultural, etc.). Input data to the EIS have been obtained through GIS analysis (ArcINFO), remotely sensed data processing (Erdas Imagine) and spatial interpolation of climatic data (Surfer, Idrisi). The study area has been divided in Basic Land Units corresponding to the morphology of hydrological basins. The aim of the zoning was the identification of risk areas for agricultural and livestock potentiality and the evaluation of recovery interventions on temporal and spatial basis. Each Basic Land Unit has been classified, in ArcView, by logically crossing three single-parameter classifications based on elementary parameters. As a result each Basic Land Unit is represented by a synthetic index of three digits. The index represents the pressure (environmental, agricultural, of livestock) on the single Basic Land Unit and allows to identify homogeneous zones and their changes. On the basis of time series comparison of this index a zoning of the impact of interventions has been produced. INTRODUCTION Keita valley in Niger has been the subject of a consistent number of interventions that brought important changes to the environment and to the socio-economical tissue. The project PDRADM "Project of Rural Development of the Ader Doutchi - Maggia – PDRADM/FAO" has been working in this area from 1984, in order to guarantee population self-sufficiency, hardly compromised by environmental degradation. The interventions area extent is about 3000 squared kilometres between 15°10’-14°20’N and 5°20’-6°35’ E. The region is characterised by a strong morphological variability determined by the succession of plateaux and narrow valleys furrowed by torrential watercourses. Topographic units determined by this succession are plateaux, slopes, glacis (zone of conjunction between slope and plain) and plains. Keita region is in the soudano-sahelian climatic zone with an annual rainfall between 300 and 400 mm concentrated from June to September with a gradient in the SW-NE direction. The rainy season is characterised by a strong spatial and time variability, especially in the first part of the season. The ecosystem of the region had a real breakdown as a consequence of the decrease in rainfall in the seventies and in the early eighties. The decrease in the vegetation coverage caused the formation of superficial crust in the plateau, serious phenomena of erosion in the slopes and destroying floods in the plains. The excessive demographic pressure and the decrease of cultivated areas brought a strong degradation as well as the emigration from the region. The PDRADM operated in this context giving priority to environmental recovery trough an integral treatment of the catchment basins. The typology of intervention followed the physiographic units:
Population has been involved in works. The PDRADM acted also for the organisation of the agricultural production process. The "Project for Evaluation of the Interventions of Conservation and Recuperation of the Environment – PEICRE" has been charged of the evaluation of changes occurred to the ecosystem and of efficiency of intervention carried on by the PDRADM. The evaluation carried out by PEICRE is based on the spatial and time comparison of "Basic Land Units – BLU" corresponding to catchment basins. The analysis has been done starting from the following information layers:
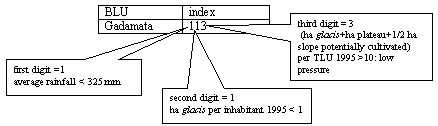
Data collected have been integrated in an Environmental Information System and analysed at Basic Land Units level in order to obtain a classification of the territory in risk areas. GIS APPLICATION The Information System developed by PEICRE is managed by ARCVIEW 2.1 and allows the analysis of the area following a series of projects (*.apr) characterised by a growing level of elaboration. In the methodology adopted each BLU has been classified on the base of elementary parameters or first elaboration parameters. The cut-offs for the classification has been chosen following a logic criteria, it is to say that for each parameter the cut-off represents real changes in the environment. For example for the rainfall the cut-offs chosen have been: less then 325 mm; between 325 and 375 mm; more than 375 mm, values determining strong changes in the possibility of growing of vegetation and so real limits to agricultural production. Than single classifications have been crossed to obtain synthetic indexes based on three parameters: a three-digit number represents each BLU and each digit is the result of a single parameter classification. Here is an example of a synthetic index obtained from base parameters:
The first digit indicates the
climatic potentiality of the BLU calculated on a series
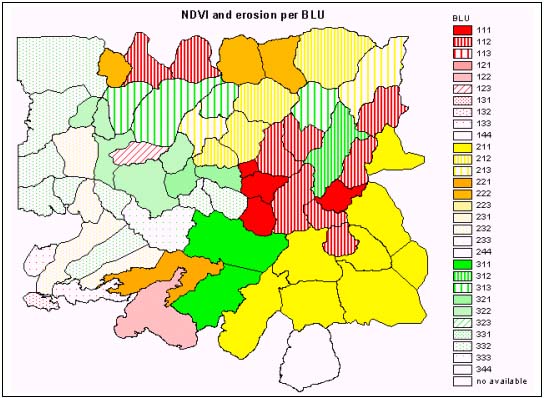
of 15 years. The index gives a global value of the pressure (environmental, agricultural, pastoral) on the BLU and allows the identification of homogeneous zones. The peculiarity of this methodology is the possibility to extract from the global index the values of the basic parameters composing it and having in evidence the source data. Here is an example of a classification made on the base of NDVI, erosion and rainfall.
In the following tables are shown cut-offs chosen for this classification
The choice of three digits permits also an easy visualisation of maps: first digit is represented by colour, second digit by the intensity of that colour and third digit by the type of grid. Following this methodology PEICRE carried out 10 synthetic indexes:
CONCLUSIONS Using this methodology PEICRE project carried out a number of classifications of the territory permitting to identify:
With this methodology it is possible to extend the zoning to other areas and to compare the results with other territories The advantage of this methodology is the possibility to extend the classification to the surrounding areas and to be applicable to other areas and so obtaining a comparable zoning, being the indexes always representing absolute values independent from the inner relationships between zoning units. REFERENCES
|
||||||||||||||||||||||||||||||||||||||||||||||||||||||||||||||||||||||||||||||||||||||||||||||||||||||||||||||||||||||||||||||||||||||||||||||||||||||||||||||||||||||
     |
||||||||||||||||||||||||||||||||||||||||||||||||||||||||||||||||||||||||||||||||||||||||||||||||||||||||||||||||||||||||||||||||||||||||||||||||||||||||||||||||||||||
    |
||||||||||||||||||||||||||||||||||||||||||||||||||||||||||||||||||||||||||||||||||||||||||||||||||||||||||||||||||||||||||||||||||||||||||||||||||||||||||||||||||||||
 |
||||||||||||||||||||||||||||||||||||||||||||||||||||||||||||||||||||||||||||||||||||||||||||||||||||||||||||||||||||||||||||||||||||||||||||||||||||||||||||||||||||||
| [Introduction] [Conference programme] [Presentation by authors] [Presentation by category] [Poster session] [List of european Esri distributors] [List of exhibitor] [Esri products news] [Credits] |
||||||||||||||||||||||||||||||||||||||||||||||||||||||||||||||||||||||||||||||||||||||||||||||||||||||||||||||||||||||||||||||||||||||||||||||||||||||||||||||||||||||