 |
| DEVELOPMENT OF A GIS DATABASE FOR AGRO-ECOLOGICAL CHARACTERIZATION OF THE APULIA REGION (SOUTHERN ITALY) |
| Mladen Todorovic Istituto Agronomico Mediterraneo di Bari, Via Ceglie 9, 70010 Valenzano (BA), Italy, tel. (+39-80) 7806201, fax (+39-80)7806206, mladen@iamb.it Pasquale Steduto Angelo Caliandro Maurizia Catalano Ezio Rusco Enrico Quaglino Sergio Samarelli Agostino Tortorella,
Enrico Nerilli, Saverio De Santis, Antonello Madaro,
Alessandra Pezzuto, Oronzo Filomeno, Domenico Fanelli e
Oronzo D'Amico Abstract This work presents the state-of-art in the development of the ACLA 2 Project which aims at agro-ecological characterization of the Apulia Region (Southern Italy) through the assessment of potential agricultural productivity. The generation of the Apulian administrative, climatic, soil and topographic database is described. This database will provide an important support for the development of homogeneous agro-climatic and agro-pedologic zones which will serve in the determination of the potential yield of specific crops. This will be accomplished by means of both mechanistic and statistical modeling. The GIS database is being developed in ArcInfo and then transferred in ArcView to provide an easier way for data-query and analysis, and to facilitate data distribution and use. The carried out activities have involved considerable efforts in climatic data collection, analysis and development, soil sampling and creation of digital soil database, collection of the relevant crop parameters, digitizing topographic data and administrative boundaries. The data are subjected to comprehensive error detection and correction. Progressive sampling procedure is used for the creation of the regional soil database. The ongoing activities are focussed on the completion of a GIS database, the preparation of data for the development of Digital Elevation Model for the Apulia region and on the evaluation of the procedures for time series analysis and spatial interpolation of climatic data along with design of soil information system. INTRODUCTION Agro-ecological characterization of an area highlights and integrates the various aspects of the crop-environment system and, through the measures (qualitative and quantitative) of spatially referenced potential productivity, it primarily aims to provide the agro-ecological description of the area of interest and the basic information system necessary for an appropriate decision making process carried out by the local governmental institutions. Agro-ecological characterization comprehends the development of large databases covering different aspects of the crop environment such as relevant soil and weather information, major crop growth parameters, actual land use and cropping pattern, and, in some cases, administrative boundaries. During the last decades, most of the information for the agro-ecological characterization of an area have been developed, stored and handled on the paper sheets, computer-assisted local databases and CAD systems. Those systems, on one hand, facilitated the maintenance and collection of new data and data exchange, but, on the other hand, they did not allow the connection of geographically referenced information and numerical and descriptive databases, and integration of data from various sources, layers and scales. However, the rapid development of new information technologies such as geographic information systems (GISs), digital elevation models (DEMs), terrain analysis and modeling techniques along with the networking PC and powerful workstations has offered improved, modern strategies and tools to enhance the ability to extract quickly and efficiently insight knowledge from the information stored. In spite of that, many investigations are now attempting to integrate CAD-based and descriptive databases within a GIS environment in order to produce structured modeling approaches for comprehensive and multipurpose assessment of an area. One of such projects is the ACLA 2 (P.O.P. – Misura 4.3.6) which aims at agro-ecological characterization of the Apulia Region (Figure 1) through the potential agricultural productivity.
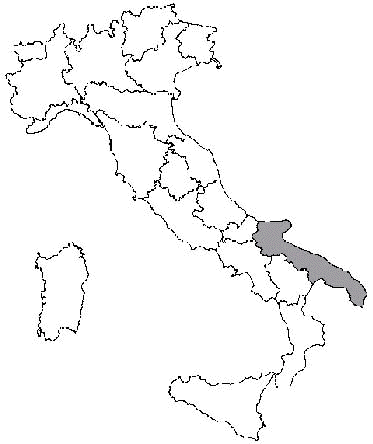
Figure 1. The Apulia region is situated in the Southern Italy and it comprehends an area of approximately 19,500 km2 The ACLA 2 project is coordinated by the Mediterranean Agronomic Institute of Bari (CIHEAM/MAI-Bari) and the Agricultural University of Bari (Institute of Agronomy) and it is financed by the European Union funds and the Apulia region. The Project has started in the autumn of 1997 and it will last for tree years. This work presents the state-of-art in the development of the Project and it is mainly focussed on the creation of a GIS database indispensable for the fulfillment of the Project’s tasks. DESCRIPTION OF THE PROJECT The ACLA 2 project presents the continuation of the activities carried out within the frame of the ACLA 1 project in the beginning of nineties. The ACLA 1 was mainly oriented to investigate about different methodologies for the territorial soil and climate characterization and to verify their validity and applicability in the Southern Italy. Furthermore, ACLA 1 was addressed to identify the main sources of climatic and soil data pertaining to the Apulia region and to collect and store available information in digital form. It was done digitizing the existing geographically referenced information in AutoCAD dwg format and organizing the alfanumerical databases mainly in ASCII format. The analysis of climatic data set was limited to the period of 30 years from 1951 to 1980. The soil data set was enhanced through 1000 soil samplings carried out during the realization of the project, and then a preliminary soil map of the Apulia region was designed on the base of those data and already existing information. However, the ACLA 1 project did not deal with the sufficient data to develop a detailed agro-ecological characterization of the region. Moreover, ACLA 1 did not provide the integration of databases within a GIS environment. Consequently, the ACLA 2 project has built up in order:
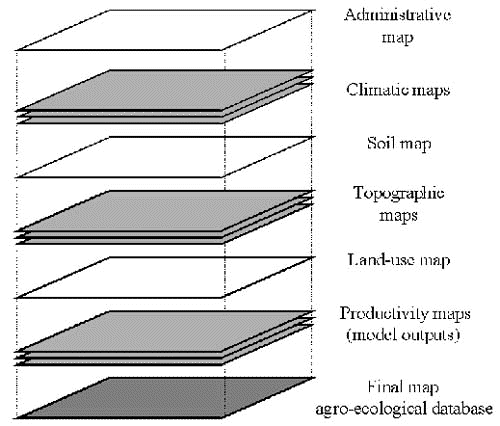
The final product of the Project has to be a GIS structured database which includes administrative, climatic, soil, land-use and topographic maps together with the output of modeling crop productivity (Figure 2). It has to provide an efficient support about the agro-ecological characterization of the Apulia region to be primarily used by the Regional authorities, but also by the scientific institutions.
It means that the regional authorities have to access a GIS database and through the evaluation of the spatially referenced queries identify the areas of particular interest. This implies an approach which is applicable at different scales. The queries have to be developed:
The queries have to be performed considering:
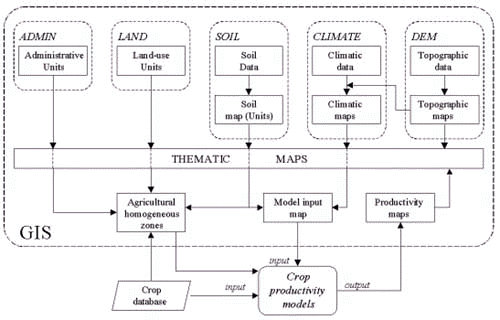
The ACLA 2 database has to allow the users to perform the queries in a sequential interrelated manner which substantially means that at any stage of each query the users of the system may request the information about different topics. For example, once the area suitable for growing a specific crop is defined the users may proceed the interrogation by other topics (administrative units, climate or soil) either selecting the area from a set which satisfies previous query or adding to the previously defined data set the area which confirms new query. The results of each query have to be summarized in spatial, tabular and graphical forms and to be printed in appropriate format on user request. According to the specific scope of the Project, the ArcInfo ver. 7.1.2 mounted of the Sun workstation platform is selected as a Geographical Information System to acquire data describing the spatial information and their associated attributes, build up databases and develop and execute the spatial GIS operations, while the ARCView 3.0 Windows software is chosen as the most appropriate to be used by the regional authorities for the queries of the databases and the generation of the reports. DEVELOPMENT OF THE ACLA 2 DATABASE Methodology ACLA 2 database includes a GIS-based data comprehending administrative units, land use, soil, climate and topographic data and a GIS independent crop database essentially used to support statistical and mechanistic models (Figure 3). The database is being developed taking into consideration several factors: actual availability of the data from various sources and in different formats, financial funds assigned for the evaluation of database and requirements of the project pertaining to the input data for the crop productivity model and the data necessary to design agro-climatic and agro-pedologic maps. Multi-objective structure of the project requires integration of different data sets at various steps of the project realization. For example, soil and climatic data have to be evaluated to develop the agro-climatic and agro-pedologic maps, but also they have to be integrated in order to provide GIS data set to be used as an input for crop productivity model. Moreover, in order to satisfy different tasks of the project some data has to be available in different formats (vector and raster). For example, temperature data set will be produced originally from the digital elevation data and temperature information at the meteorological stations and therefore it will be in the raster format. However, the development of the homogeneous temperature zones will require the classification of the temperature values by intervals and the creation of polygonal features format to be used for the integration with other maps.
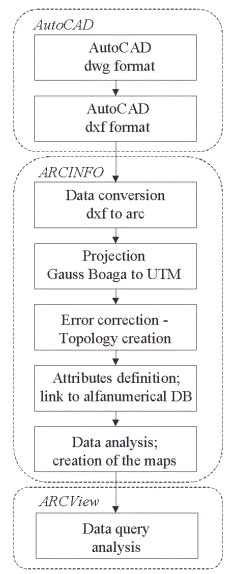
Specific structure of the Project addresses an adaptation methodology as the best tool for the evolution of the Project. This allows the development of the GIS database and the model through the step-by-step procedure where, at different phases of the Project, database and model requirements have to be analyzed and eventually redefined in order to match each other. This means developing a general framework (methodology) which consists of the regional database (soil, climate and crop), and extending the procedures for agro-ecological parameterization and crop productivity model implementation. This main system (primary database) is addressed conceptually to represent a generalized method which applied by means of the procedures for agro-ecological parameterization provides the information of the overall suitability of the sites for the different cropping patterns. Progressively, this primary database should be used as the start-up soil, climate and crop file, shortening the implementation times for each of the subsequent tasks. These tasks should involve the development of more detailed databases, the running of the model and the generation of crop productivity maps. Processing of existing data The first step in the development of the ACLA 2 project was the identification of already existing data in digital form and the interpretation of their characteristics and limitations by means of source, format, quantity and quality (accuracy). The primary source of data is the database developed during the realization of the ACLA 1 project. This database contains the regional and administrative boundaries map, land use map, and preliminary soil and climatic maps. These maps were digitized in the AutoCAD system from the 54 I.G.M. (Istituto Geografico Militare) map sheets in the scale 1:50,000 with the main scope to be displayed and therefore used as a visual support, and to be printed as a final product of ACLA 1 project. In most cases the textual information provided on these maps are not suitable for a straightforward integration into a GIS database, because they are incomplete, not rarely repeated and misplaced and they do not refer to the geographic features they described. In addition, many polygons were not closed and the intersections of the arcs were not depicted by nodes. Furthermore, the maps were digitized in the Gauss-Boaga transverse mercator projection, with the central meridian centered along the Monte Mario (Italy). This projection has been used in Italy for decades. Since the Universal Transverse Mercator projection (UTM) is adopted as a coordinate system projection of the project, the already digitized maps had to be transferred from Gauss-Boaga to UTM projection. Characteristics and limitations of the already existing data in digital format has imposed the processing procedure for those data as it is illustrated in Figure 4.
AutoCAD dwg files are imported in dxf format and then they are converted in ArcInfo using the standard dxftoarc converter. Since ArcInfo does not support the Gauss-Boaga projection a program for the conversion of the data from Gauss-Boaga to UTM projection is developed taking into considerations the following characteristics of the Gauss-Boaga map projection:
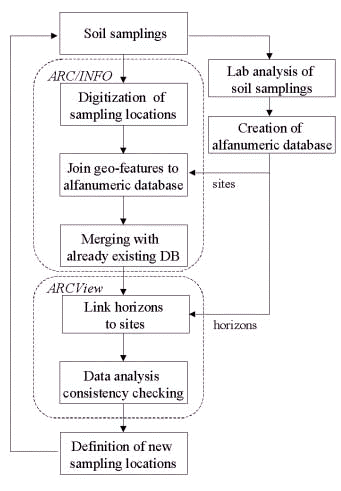
Before the existing data were processed, the master tic file and the coverage describing the borders of the 54 I.G.M. maps sheets in scale 1:50,000 were created. The master tic file is created to be used in all of the coverages in a GIS database. Four tics are established for each 1:50,000 scale I.G.M. map sheet corresponding, to the cross section of the 1 km rounded x and y UTM coordinates closest to the corners of the maps. These locations are preferred rather than the corners of the map sheets because, in some cases, the information to be digitized are situated on the transparent sheets covering original map and, therefore, making the corners of the map less visible than the cross sections of the coordinates within the maps. The coverage representing the boundaries of the 1:50,000 scale map sheets is created to be used as an auxiliary tool – background coverage for the correction of the topological error since the large part of the errors is observed in the zones of connection of the sheets. Furthermore, this coverage will be used to facilitate the identification of the geographic objects on the map sheets. The Apulia region crosses two UTM zones (33 and 34) with the majority of the area falling in zone 33. Consequently, the geographic features at the borders of these zones do not match and the seven (of 54) map sheets falling in the zone 34 were projected into the zone 33 in order to perform analysis on the whole region. It is assumed that a single coverage precision can satisfactorily maintains the required accuracy of the geographical features treated within the project. When digitizing is performed it is assumed that the acceptable value for the RMS error indicating the accuracy in real-world units does not go above 15 m, which in the 1:50,000 scale map sheets corresponds to the value of 0.3 mm. Administrative data The Apulia region consists of five provinces with the total of 257 municipalities. Administrative map describing regional, provincial and municipal boundaries is a polygon coverage (ADMIN) developed on the basis of data digitized in AutoCAD. Regional boundaries and coastal lines defined in ADMIN coverage are assumed to be referenced for all other coverages. Since many municipalities comprise the areas of several polygons, region areal geographic feature is applied to describe the municipalities in ADMIN coverage. Digitizing errors are identified through the visual control and the comparison of the surfaces of municipalities obtained by GIS and those taken from the regional statistical data sets. The attribute table of ADMIN consists of the names of region, province and municipality and the municipality’s ISTAT code. Land use data Land use data provides the base information to evaluate land suitable for agriculture in the region. Land use map, a polygonal coverage, comprehends natural and artificial water surfaces (lakes), urban zones and areas covered by perennial species (forestry, olive trees and vineyards). Some data were taken from the maps already digitized in AutoCAD (lakes and forestry) while other data are being digitized in ArcInfo. Region areal format is being used to describe the geographic features. Soil data The ACLA 2 project uses a number of soil information (maps) realized within the frame of ACLA 1 project and other investigations on soil characteristics of the region. The spatial data and the primary soil attributes of these maps are stored in coverages created and maintained by ArcInfo. Actually, soil database includes already created data sets: preliminary polygonal soil coverage of the ACLA 1 (PEDA1), point soil samplings sites of the ACLA 1 project (PEDA1P), point reference soil sites (PEDREF), and point soil sampling sites of the ACLA 2 (PEDA2P) which is under development. Development of the regional soil map is being supported through the 5000 soil samplings including about 4000 drilling samplings, 500 soil profiles and 500 observations. On-field soil sampling follows the procedure established in soil sampling manual (Timesis, 1997) and it is prevalently focussed to highly productive agricultural land in the region. The locations of the soil sampling sites are derived using a progressive sampling GIS procedure (Figure 5), similar to the procedure originally proposed by Makarovic (1973) for sampling terrain of varying complexity.
Progressive sampling procedure involves a series of successive samplings where the locations of new sampling sites are determined using the results of a GIS analysis of the data from the preceding sampling. Soil physical and chemical properties of each series of data are analyzed in laboratory and stored in two MS Access dbf files pertaining to site and horizons information. The location of sampling sites are digitized as a point features in ArcInfo where site’s soil physical and chemical characteristics are associated to geographic information in coverage PEDA2P. Then point coverage PEDA2P is merged in polygon coverage PEDA1 which contains soil characteristics obtained during the realization of ACLA 1 project. New coverage is created by overlaying two sets of features where all items in polygon coverage are joined into the output point feature attribute table. The output coverage is imported in ArcView where dbf file with additional soil parameters concerning the soil horizons characteristics is linked to the PEDA2P soil attribute table. This allows the interrogation of the soil database under development to identify the zones of inconsistency about soil characteristics coming from previous investigations and the results of laboratory analysis of new soil samplings. Since the descriptive information about soil samplings and the homogeneous polygonal soil areas are not always straightforward, the series of sequential queries were made to produce soil sampling characteristics comparable with the polygonal soil area descriptors. In turn the results of these queries permit the determination of the locations where new soil samplings has to be taken. Soil data set in preparation should provide identification of the soil taxonomy classes in the Apulia region including detailed information about soil characteristics according to Soil taxonomy (1994). The final product of soil database will be the regional soil map in the scale 1:100,000. It will be designed using the results of GIS analysis on the above mentioned coverages, the existing black and white areal photos and three satellite (Landsat 5) scenes of the region. These remote sensing data will be also used in the evaluation of the land use database. Meteorological data Primary meteorological data belong to the historical files from 72 meteorological stations located in the Apulia region and 29 fictitious meteorological stations introduced in the areas where station network was insufficiently dense and where high variation in altitude was observed. This data set is the result of the comprehensive analysis developed on the historical weather data for a period of 30 years, from 1951 to 1980, during the realization of the ACLA 1 project. The final products of the ACLA 1 meteorological analysis were the maps of isolines regarding the average monthly temperature and the annual potential water deficit estimated as a difference between reference evapotranspiration and rainfall. These isolines were produced using the SAS/GRAPH (Statistical Analysis System) G3GRID interpolation procedure where interpolation reticule consisted of 26000 (200x130) nodes with the distance among them of 1708.2 and 1852.2 meters on x and y axes respectively. Moreover, statistical analysis yielded very good results of the linear regression between the monthly temperature and station altitude with the regression coefficient ranging from 0.77 (in August) to 0.89 (in February and March). Primary data set developed in ACLA 1 project, is being enhanced temporally, in order to comprehend meteorological records for a period of 45 years, until 1995, and spatially to enlarge the area under consideration to the provinces neighboring to the Apulia region. Historical weather data includes minimum and maximum air temperature and humidity, precipitation, sunshine fraction and windspeed and they are stored in standard ASCII format. These files are processed by Turbo Pascal program for data conversion and error detection. The program produces an output file which contains the results of the examination of each historical file. The program attributes the error code when:
where W is a weather variable, Wmin is a minimum value of weather, Wmax is a maximum value of weather variable and Wll and Wul are predefined lower and upper limits of weather variables, respectively. Then, the calculation of reference evapotranspiration is performed using IAM_ETo program (Snyder and Steduto, 1998), which provides evapotranspiration estimate using 13 different formulas in any time period between daily and monthly. Finally, long-term average monthly data sets are produced for each weather variable. Long-term monthly climatic series will be tested on temporally basis in order to identify outliers, monthly values which are out of the predefined deviations from the mean values. Then each suspicious data will be compared to the values on the neighboring stations in order to assess its spatial integrity. Different interpolation methods will be used in checking spatial quality of the data as it is proposed by Baker et al. (http://www.ncdc.noaa.gov/gcps/papers/qc1/qc.html). These methods will be compared with the real values for each weather variable and for each month/station in order to select the best one for testing spatial integrity. Finally, the values failed both tests (temporal and spatial) will be removed from the long-term climatic series. Then, a data set containing the average values of climatic variables will be created for each station on monthly and yearly basis. This data will be joined to the spatial point representation of meteorological stations in ArcInfo to be used in spatial interpolation of weather variables. Spatial interpolation has to produce continuos information about weather variables over the entire region in the regularly gridded raster format to be used as an input to mechanistic crop productivity model and for derivation of the homogeneous agro-climatic zones. Method for interpolation of climatic data will be defined after the analysis of various deterministic (Thiessen polygons, tessellations) and stochastic (kriging, inverse distance interpolation, trend surface analysis) methods, many of them already available in ArcInfo. Crop data and models Crop database consists of three files. The first supports general soil and climate data which provides the overall descriptive suitability for growing of the crops under different conditions. The second and third data set are tightly related to the overall modeling requirements of statistical and mechanistic model respectively. The statistics of the crop productivity at different sites for various crops and under different climatic conditions are being collected in the tabular form from already existing annual records. Successively, using a GIS, statistical information will be attributed to the geographical sites (agricultural land at municipal scale) where they are observed. In such a way the soil characteristics will be retrieved from the soil coverage attribute table which will permit the evaluation of the statistical modeling approach where the crop productivity will be related to the real soil and weather data observed in the Apulia region. Inasmuch as this statistical approach does not take in consideration fertilizer application and irrigation practices it provides an useful approximative estimate of crop productivity under different soil and climate conditions. Statistical crop models are used for both field and tree crops. Mechanistic crop productivity model is being developed using the experiences of the CROPSYST (Stockle and Roger, 1992) and EPIC (Williams et al., 1989; Steduto et al., 1995) models. The model provides quantitative prediction of crop growth and yield for different field crop species commonly growing in the Apulia region. No tree crops are modeled by mechanistic model. The engine of the mechanistic crop-growth model is driven by two major weather variables: temperature and solar radiation. The temperature leads the growth-stages development (e.g. emergence, flowering, peak of leaf area, physiological maturity etc.) making use of the degree-day accumulation or thermal time concept (Ritchie and Nesmith, 1991). The solar radiation intercepted by the crop leads the biomass growth, which is then partitioned into roots, stems, leaves and commercial yield. The leaf area is the major crop parameter determining the amount of solar radiation intercepted as well as the rates of evapotranspiration. The soil-water-balance module is linked to the crop-growth model which enables the estimate of rainfall infiltrating into the soil-root zone (effective rainfall) along with water consumption by soil evaporation and crop transpiration. The model is first run under no water and nutrient deficits. In this way, it sets the 1st hierarchical level of the crop potential productivity, i.e. the one constrained by climate only, though with no water restriction. According to this 1st level of potential productivity, the model generates the "demand" for water (the crop water requirement). The difference between potential water demand by the crops and actual water supply by "effective" rainfall sets the water deficit for potential productivity of each crop. Using the water-biomass transpiration ratio (Steduto, 1996) and the Stewart approach (Stewart and Hagan, 1973) relating biomass and yield to water consumption by crops, the model sets the 2nd hierarchical level of crop potential productivity, i.e. the one constrained by climate and water, though with no nutrient restriction. By indexing the physical and chemical fertility of the soil, the 3rd hierarchical level of crop potential productivity is set by the model, i.e. the one constrained by climate, water, and nutrient of each homogeneous zone. The deviations between 1st, 2nd and 3rd level of potential productivity are measures of the "distance" or "amount" in terms of resource necessary to "cover" or to "fulfill" in order to achieve the full potential productivity. For each homogeneous zone, thus, it
can be identified a rank of crops according to their
productivity under naturally available resources (soil
and water). Similarly, for each crop it can be identified
a rank of homogeneous zones according to their attitude
for potential productivity. In this way, various thematic
maps can be generated to characterize agro-ecologically
the territory of the Apulia region. Topograhic data and digital elevation model Topographic information play an important role in evaluating spatial interpolation of weather variables and in statistical analysis of terrain characteristics by computing slope and aspect. We are attempting to create digital elevation model of the Apulia region using ANUDEM interpolation method developed by Hutchinson at the Australian National University (Hutchinson, 1988, 1989, 1996). ANUDEM surface gridding approach is based on an iterative finite difference interpolation technique and it applies spline interpolation algorithm and various localised constraints to represent more closely the terrain surface. ANUDEM uses as an input not only contour and point elevation data but also stream line and sink point data which substantially reinforced the quality of output DEM. In the literature, ANUDEM appears to be the most appropriate raster technique for creation of DEM and it is already used in the development of DEM for Australia, Africa, South America etc. ArcInfo’s TOPOGRID command completely support ANUDEM interpolation method. Significant pre-processing of topographic data is required for input to TOPOGRID. Contour elevation data were digitized in AutoCAD from I.G.M. 1:50,000 scale map sheets with contour elevation interval ranging from 5 to 25 meters. Detection and correction of the erroneous contour elevations is being performed through the visual control on the source maps and the attribution of the elevation values to arcs. This procedure was adopted since it was not possible to use text arcs descriptors assigned in AutoCAD within ArcInfo environment. In addition these descriptors were frequently repeated and many of arcs were not connected. Actually, contour line data are being enhanced to comprehend the topographic information belong to the provinces neighboring to the region since a part of meteorological stations is located out of the Apulia region. Almost all streams presented on the 1:50,000 scale I.G.M. maps will be digitized and only very minor streams will be omitted. Spot heights and the points of known surface depression are being selected and they will be digitized in separate coverages. Topographic data will be processed using as a primary form of input data a line coverage of elevation contours. The resolution of DEM will be optimized using the procedure suggested by Hutchinson (1996) where the slope of fitted DEM at data points is examined starting from a coarse grid (couple of kilometers) to finer resolution (100 meters) and observing when root mean slope is stabilized. Tentative resolution of DEM is about 100-200 meters. CONCLUSIONS This paper describes the current status of implementing Geographical Information System in the ACLA 2 project from which lessons can be learned and improvements made reflecting on the actions performed and on the tasks to be done. Agro-ecological characterization of an area inevitable involves the use of a GIS technology for data development and modeling of crop productivity. Development of a database includes common GIS applications as spatial overlay functions to produce new coverages. Moreover, in the development of soil database, GIS offers the evaluation of the objective-oriented queries to determine the areas where soil samplings should be taken. Also, GIS is invaluable tool for spatial interpolation of weather variables and the spatial parameterization of other variables to be used by crop productivity models. The ACLA 2 project is addressed to the user needs at various levels and for different purposes which arises difficulties in the development of a GIS database. However, development of a GIS database and the project itself provide opportunity to store and maintain regional soil, climate, land use, crop and topographic data in a consistent format, to facilitate exchange of data and to support many of the eventual further GIS-based project regarding to the Apulia region. Achieving this will require additional work in improving and assessing the quality of source data and project-derived database and ensuring their completeness, validity, consistency, integrity and positional and attribute accuracy. Acknowledgements This work was supported by the European Union, the Apulia Region (administrative frame P.O.P. - MISURA 4.3.6) and the Mediterranean Agronomic Institute of Bari (CIHEAM/MAI-Bari). REFERENCES
|
     |
    |
 |
| [Introduction] [Conference programme] [Presentation by authors] [Presentation by category] [Poster session] [List of european Esri distributors] [List of exhibitor] [Esri products news] [Credits] |