 |
| ITALIAN ROAD DATABASE |
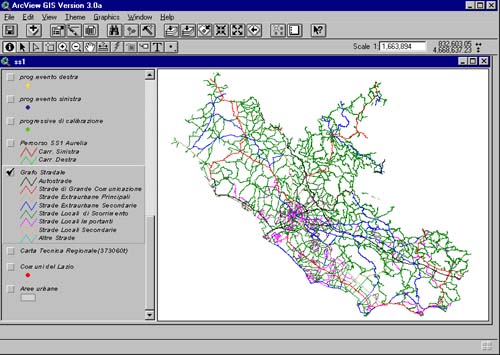
| Sandro La Monica ANAS – Centro Sperimentale di Cesano – Via della Stazione di Cesano 311 – 00064 Cesano di Roma, tel (+39) 6 3043401, fax (+39) 6 3038585, anas_cesano@rmnet.it Marco Fano Abstract Italy does not have, up to now, a national road database. Even if a law dating from 1992 makes this kind of instrument mandatory for all road agencies, only some local agencies have experimented with GIS applications. The creation of such a database at a national level has now become a critical issue, since the government is proceeding with the reassignment to Regions (20 of them) of a large share of the road network. In the future, as a consequence, the number of road agencies will increase, and with it, the need for an overall coordination in planning and management, that will be possible to attain only through a unified national database. ANAS, the national road agency, has started a project to define contents and procedures for the creation of such a database. The project has been developed using ArcInfo and ArcView. It uses data derived from the TeleAtlas database as a starting point, with the addition of several other layers of information from various sources. The road data is being organized in route systems, and the road information stored and displayed through the techniques of dynamic segmentation. An effort is being made to collect available small scale cartography at the regional level, to use both as a basis for the display of data, and as reference in the procedures for the calibration of routes. In the future, this system will be used to store and manage information related to pavement conditions, road geometry, accidents, etc. A further development at a more detailed scale is envisioned for the management of projects, properties, buildings etc. INTRODUCTION –The Italian Road Database – A prototype Every country has a road network, and for every road network there is a need to create some kind of database for planning and management. Solutions are not yet uniform, some countries only have data on paper, many only have digital tabular data, some have a GIS system that combines geographic data and tabular information. Most western european nations have some kind of GIS system, but these are not standardized, and information is not easily compared from one nation to the other. EU authorities have, as one of their objectives, the improvement of the basic transport network in a uniform way across the member states, but this aim is made difficult to attain on account of the complexity in gathering and comparing data. In Italy this situation is made more complex by the number of agencies that manage the network. There is a national agency (ANAS) for the main roads; provincial agencies (95 of them) for medium level roads, municipal road networks for local traffic, and other minor organizations that manage agricultural roads and such. And nobody knows exactly what the others are doing, or has a picture of the overall updated situation. A national law1 dating from 1992 makes it mandatory for all these agencies to define a road database, following a set of (not too well defined) guidelines, and all these databases should transfer information to an overall national road database that should then coordinate the lot. But not much has been done in this direction up to now. The situation is becoming critical because the government is following a policy of transferring a large part of the basic network to the Regions (20 of them). If on one level this can be seen as a good move, on the other the need for a coordination becomes urgent. Up to now one single organization (ANAS) was responsible for the basic interregional roads, and even if the information system was weak and inefficient, there was a place and a group of technicians that had an overall knowledge and control of the entire network. Local agencies relied on ANAS for the main connections, and cared for the local needs. This will now change, since a large part of the basic network, including interregional roads, will be handed over to local governments, that will only have a direct knowledge of the portion they manage. An integrated road database to coordinate overall management, planning and investments becomes now a basic and critical need. GIS APPLICATION - The ANAS project Our working group, that operates within ANAS, has started less than one year ago to define a project for a road database, intended mainly as an agency system, but conceived in an open way, so as to be used, if necessary, as a national road system. We have now a functioning kernel of a system, and a rather good knowledge of which data is available, which precision and reliability it has, how to get it and at what cost etc. We have drafted an overall project for a full system, and should start rather soon the transition from the prototype stage to the real thing. The basic structure of the system The system has been built around a network of Intel based computers, using Windows NT as the operating system. GIS software on the server is ArcInfo, with the Network, Grid and Tin extensions. Client stations use ArcView. For the time being, the system uses only the basic INFO DBMS, which up to now has proved adequate for our needs, but with the growth of the system and of the amount of managed data, the addition of Oracle is foreseen. We have bought and installed the TeleAtlas road database, covering all of Italy, as a starting point for the construction of our information system. This is a database developed mainly for car navigation purposes, based on existing cartography updated with field inspections. The resulting average precision is about equivalent to a 1:10.000 scale. The quality of the data varies form Region to Region according to the available information, but on average it is pretty good. The data base has the centerline of all roads above the local level, which means all state and provincial roads, plus a good amount of municipal and local roads. Two lane roads are represented by separate centerlines. Associated attributes include the name of the road (both national and european names) a functional classification in seven levels, allowed turns, direction of traffic and others. There is a set of associated levels of information that include administrative boundaries up to the municipal level, built up areas, railroads, parks, and a very simplified rivers and lakes level. Most features have an associated place name. The information is organized by Regions. Figure 1 - The TeleAtlas Road Network for Lazio region. As a complement to this information we have acquired:
We have also installed the Digital Chart of the World (precision equivalent to 1:1.000.000) to have a cartographic reference for international networks, mainly within Europe. The DCW has some good infrastructure information (even if at that scale), not easily found otherwise: harbours, airports, power lines, pipelines etc. The definition of the project has entailed several decisions and discussions. In this concise report we will only mention a couple of them: the general approach, and the projection issue. As a general approach, as we have already implied, we chose to start with a global database covering all of Italy, at a low detail of information, that will in time be improved and better defined, and enriched with added information. This was by no means a decision that could be taken for granted. And as a matter of fact is not the way in which the Ministry or several operators intend to go. The alternative, that is very often followed, is to start with a field campaign, with precision (and costly) instruments, proceeding road by road, and acquiring all possible and detailed information in this way. ANAS has in the past done exactly this. It has, at a very high cost (indicative price is 600 U$ per km.) collected detailed data on 5000 km of road network for two northern Regions. Limits of this approach are:
With ANAS, this is basically what happened. The data was collected, but it was not used or updated for almost ten years, and by then it was obsolete. What we intend to do is the opposite. Build from the start an overall road database, even if not so precise, based on the TeleAtlas information. Establish a collaboration with the road managers to feed the database with the data they are using. Building together procedures to use the data, now reorganized and connected to a GIS, in their day to day activities. Integrate the updating procedures with the normal user procedures. Only after all this is in place we will start thinking of field campaigns to gather new data, and this will be done in agreement with the end users, once they realize the limits of the existent data, and the usefulness of a more complete information. User participation in the phase of retrieval and organization of data is important to align the construction of the database with the training of users an with the definition user applications and procedures. If the existing information system and the precision of geographical data then proves insufficient, it will always be possible to improve both gradually. By extending and revising the tabular data, or by a calibration or substitution of part or all of the graphic data. If a certain road is undergoing modifications, and the project requires a more stringent representation, a detailed survey can be undertaken, and the resulting and better representation of the centerline can replace the existing one, redefining the node positions were they intersect other roads, and reestablishing relations with the tabular data without any problem. The limited precision of the initial representation is in no way an obstacle to successive and gradual refinements. And the big advantage is that we have, from the start, a global representation of the network, and a system that can give relevant assistance to users, and useful results from day one. Furthermore, we feel that the precision of the TeleAtlas database, roughly a tolerance of about 15 meters on the ground, is adequate for the application, and that more stringent precision requirements ( 5 meters, or even in some proposed guidelines, 1 meter2,3) are just too much, and entail an unjustified burden and added initial costs. A second decision, that we have not yet made in a definitive way, concerns the projection to use for the database. Traditionally Italy’s medium scale cartography is organized on two cylinders, Gauss Boaga West and east, or the more modern and standardized UTM 32 (meridian 9 E) and 33 (15 E). For certain network applications, a continuous representation will be necessary, possibly on a cylinder associated with a central meridian (12 E). But this would not be a standard UTM representation. We may end up using both solutions, UTM 32 or 33 for regional areas, according to their location, and a single projection for certain applications that call for a unified representation (usually involving only the road centerlines coverage). Another unsolved problem concerns the feed back of corrections and modifications between us and TeleAtlas. Even at the present stage, we have corrected and redefined a rather large amount of data, and it is very important, vital we might say, that these variations be easily recovered when receiving revised and updated versions of TeleAtlas. We are still having some problems in devising a solution for this. The item identifiers TeleAtlas uses don't seem to respond properly to our needs. But we are working on it, with TeleAtlas collaboration. Several operations must be performed before using the TeleAtlas data in our application. In short:
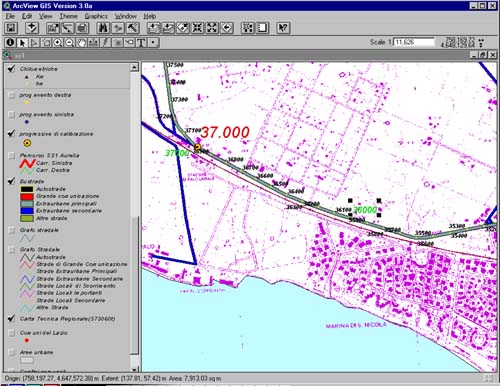
Without entering into details, TeleAtlas is distributed as two coverages, one of nodes and one of polygons and lines, with all data crammed together. Attribute data is recorded in associated records, accessible through chains of relations. This structure must be transformed into something more convenient for our needs. A rather long and complex batch procedure takes care of this, creating different coverages for different levels of information. A new coverage is also created, with a "buffer" area around centerlines, to obtain a more realistic and agreeable representation. The TeleAtlas database is very large, and a certain percentage of errors is unavoidable. Some, such as continuity within a route, and correct name definition must be corrected before defining the route system. This done, the network must be reorganized in routes, so that there will be a single entity (route) "motorway A1", instead of over 700 arcs that represent that feature. Once the route is defined, it must be calibrated on progressive km. measurements, based on the roads milestones. These measurements are conventional distances, sometimes quite different from the calculated lengths along the centerlines, but it is these measures that are mainly used to define events and situations along the road, and register them into the database. So a certain number of known measure points must be digitized along the route, to be used in the calibration process. Once the route is calibrated, the system is ready for the linkage to the tabular data. And once this is done, it’s ready to operate. Figure 2 - Detail of regional map, buffer on road network, calibrating progressive km.(orange) and calculated progressive km (red for km and yellow for hm). Functions the system will manage. When operational, the system will have to support different sets of data and applications:
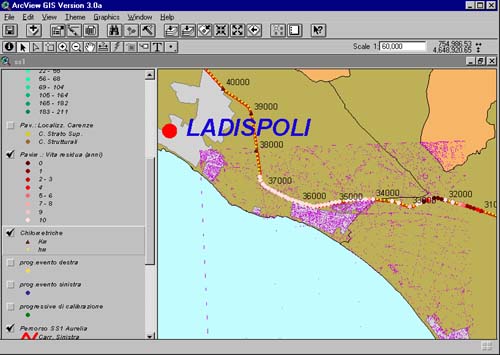
Figure 3 - Presentation of pavement condition measurements, along the National Road 1 -Aurelia-. The estimated time of pavements residual life is shown. Basically, the data for all and each of these applications consists in tables that locate the event or the situation in terms of a km. progressive measurement along a route, and describe the event. If the route is calibrated on the same measurement basis, the event can be georeferenced and represented (on a paper map or on the screen) and viceversa it will be possible to interrogate the system by pointing to a location on the network and querying on a certain class of events for that spot. An accident database will have a structure of the type:
A pavement database will be structured as:
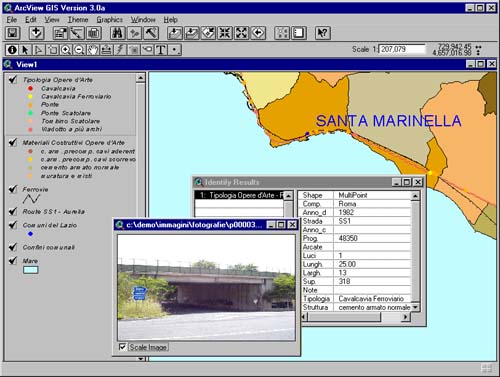
And so on. It is rather evident that the structure for all this data is rather similar, and that specific applications will have to be defined for data management and representation. Figure 3 - Presentation of pavement condition measurements, along the National Road 1 -Aurelia-. The estimated time of pavements residual life is shown. It is also easy to understand how the updating of the database can be linked to the use of the application. A repavement operation on a certain tract of road will be registered in an ongoing works database, and once completed will update the pavement database for that tract. The same for roadsigns, and so on, unto new projects and road variations, that will entail an updating of the road geometry and of associated data. Figure 4 - Presentation of bridge position and related database, along the National Road 1 -Aurelia-. The real road situation is also illustrated by pictures. TREND - Extensions to the system The system is designed for growth, and in time, new functions and contents will be added to it. These expansions in scope are basically of two types:
Functions that will be added will include:
In the first phase, the system will receive and organize traffic data as obtained from spot measurements on certain key road sections. The extension of this kind of application will entail the implementation of traffic models that, from input data on population, activities, number of vehicles etc., will derive origin/destination demands, and then, through the definition of minimum or best paths on the network, will distribute the traffic load on the entire road network. This will be compared and corrected on measured traffic data, used to calibrate results. In this way it will be possible to estimate traffic loads, and by comparing them with values of traffic capacity, as derived from the geometry of the roads (width, curves, slope etc.) derive values of traffic congestion for present and estimated future conditions, that will help to define investments for new projects and for the improvement of existing roads. Once defined the need for a new road link, there are procedures (minimal cost road paths) that help define the best path for a new link, given a set of cost variables, that can be extended to include several environmental factors. Or better still, a set of "corridors" along the new link, that show the range of alternatives open in the definition of the path, given a certain range of budget. These applications require a refinement of the network representation, and an expansion of the geographical data available (land use limitations, geology, urban planning constraints, archaeological sites, etc.). Some trial runs and experimental applications have already been made, with encouraging results. As we said, the main applications of the database as described until now are based on a linear representation of the centerlines, with a precision roughly equivalent to a scale of 1:10.000. In the future, data with a precision of 1:1000 or better will be included, for the representation of projects, and for the management of land properties and buildings belonging to the road agencies. This kind of data, that refer mainly to cadastral large scale cartography, could be seen and managed as a separate system from what described until now. But it would be nice to organize the data so that graphic information from both sources can be intersected and compared (to which land parcel belongs an authorization for a service station, or a side road access, registered at km. so and so of such road, etc.). And the definition of these sets of information will be a unique occasion to further calibrate and precise the geographic data of the network. So, finally, the network will be brought to a precision of 1 meter ground, but at the end of the process, and not from the start. With relevant advantages in terms of investment planning, of work schedule, and of time needed for the implementation of a useful and fully operating road database. CONCLUSIONS We feel that we have made a good start on the project, that the tools selected for building the system are up to the task, and the strategy is the right one. The data will not always be there, and we envision a certain amount of field work to close the gaps. We will probably find some resistance from the operators to change the way they do things, but it will probably be dispelled once they realize the advantages of the GIS technology. In any case, the road to cover before getting to a working and unified national road database is still a very long one, and even if we are optimistic about the final outcome, we by no means believe that getting there will be simple, easy or fast. REFERENCES
FIGURES
|
     |
    |
 |
| [Introduction] [Conference programme] [Presentation by authors] [Presentation by category] [Poster session] [List of european Esri distributors] [List of exhibitor] [Esri products news] [Credits] |