Antonio Cardona
AMA, Organisation Development Management,
Information Systems and Quality - Tel. 51692531, Fax
51692310, dosi@uni.net Giovanni Salatino
AMA, Organising Unit and Information
Systems - Tel. 51692476, Fax 51692310, dosi@uni.net
INTRODUCTION
AMA Territorial
Information System (SIT) is aimed at the
implementation of a system for monitoring and planning
waste collection and street clean-up in Rome.
In order to implement this system in a public concern
operating in a large and heterogeneous urban area, like
Rome, a territorial census is necessary to find all the
required information to properly plan the services.
Moreover human resources have to be trained to reach the
adequate technical and managing standards. Therefore, the
activity envisaged in this project is only the first
step, in terms of technological upgrading, towards the
optimisation and maximisation of city clean-up services.
Consequentely, the main goal is to create a supporting
decisional system to help defining political guidelines,
operational strategies and service planning and
management on site.
AMA Territorial Information
System
SIT, which meets the requirements
of Azienda Municipale Ambiente (Public concern for the
environment) should be able to:
- collect geographical and
descriptive information easily and efficiently,
relying also on software applications to process
data and check quality standards;
- produce hypotheses and
simulations using current GIS software-based
patterns, developing tailored patterns, relying
on the basic functions of the same GIS software
and integrating it with new patterns;
- provide easy applications,
with user interface and software programs in
Italian, structured in user friendly menus to
control input parameters in order to reduce
errors in operation.
The project for SIT implementation
consists of the following steps:
- Acquiring computer equipment;
- Developing the specific
applications;
- Training personnel;
- Developing application
projects;
- Developing a strategy for SIT
growth and maintenance.
However, SIT data pattern basic
elements are its attributes. The main goal of a software
application for cartography is to produce maps on paper,
while SIT main function is to process data to provide a
substantial decisional support.
An interlinked database can be useful to achieve this
objective because its structure, if accurately designed,
enables the operator to process data according to
different themes and paths. Integrating a SIT database
with elements coming from other databases, reached via
local or geographic networks, connections and SQL
structures, provides a complete data pattern necessary to
realise an efficient decision-supporting system.
Taking advantage of current DBMS system, SIT hardly
affects the existing managing infrastructure, since users
need not to learn to use new software applications and at
the same time DBMS systems remain a valid investment.
AMA SIT architecture
As it is shown in the
above structure, the GIS system plays a joint role,
sharing all the information provided by the other
systems. This integration process may be quite complex,
requiring sometimes geocoding operations - which are
dynamically carried out when providing information - or
it may require static links. Thus, thanks to this setting
for the territorial information system the investments
made in the traditional RDBMS systems remain valuable,
since they still play a major role in information
collection.
Software architecture
This architecture envisages a client-server
relationship between geographic bases and between GIS and
DBMS systems.

Geographic Server
The geographic server consists basically of the following
elements: Arc-Info - geographic system's engine and heart
- Database Integrator module – an interface with
RDBMS systems - and ANGI (Advanced Network Geographic
Interface) – which makes it possible to receive and
forward clients' geographic requests.
Database
Integrator
Using the Database Integrator module it is possible to
integrate DBMS tabular data with the geographic features
of a coverage. Interface drivers allow operators to make
SQL queries to the major DBMS systems (ORACLE,
INGRES, INFORMIX) with concurrent access.
Arc-Info
Arc-Info makes it possible to view, process, handle and
send back geographic data simply processing vectorial
data and raster images (such as photographic documents or
via satellite images), in a single integrated
environment. Arc-Info has thousands of sophisticated
versatile, even if quite complex, features for mapping,
data conversion, space analysis, interactive queries,
image editing and address geographical reference. It also
provides an interface with the most common interlinked
databases and a language (AML) to develop custom software
applications.
Arc-info heart is made up of a sophisticated set of tools
to insert, modify, handle, manipulate, analyse, display
and print geographic data. The available tools provide
the following features: logic and space queries,
topological overlay, buffer generation, proximity
analysis, area analysis, geographic network manipulation
and simulation.
Arc-Info is a fundamental but not
the sole component, of the Geographic Information System.
Since GIS is to be considered as the overall information
system. Its geographic component can be considered an
upgrading of the traditional DBMS systems. Arc-Info can
integrate and process geographic data to be shared by
other tools more dedicated to data maintenance and
presentation, like Arc-View, in a client-server
relationship.
Arc-Info data pattern is geographically related and data
are made abstract in an independent series of layers or
coverages. Basically Arc-Info data pattern is very
simple. It describes geographic characteristics in the
abstract using topological elements, such as lines,
points and polygons. Each element is associated to a
specific set of attributes in the reference tables.
Coverages consist of basic vectorial elements, which can
represent all the geographic characteristics.
ANGI - Advanced
Network Geographic Interface
ANGI is a module connecting
Arc-Info as a server and MapObjects or Arc-View as a
client to display information.
The following diagram shows the overall architecture:
Geographic Client
The subsystem consists essentially of the Arc-View module
interfacing with the geographic server via ANGI client
module, and with the DBMS server subsystem connected
directly via ODBC or indirectly via the geographic
server.
Arc-View
Arc-View key feature lies in its
capability to connect tabular data coming from DBMS
external to maps, to display, query and organise in space
the already existing data. It is equipped with an
intuitive interface to connect the geographic view with
tabular data, traditional linear, bar and pie charts and
iconised images, in order to create a layout page.
It is worth mentioning that Arc-View and Arc-Info
combined functions do not collide with the client -
server pattern; on the contrary, if well used they
improve performance and efficiency, according to an
application-partitioning model.
Data integration pattern
GIS system can integrate all data
located in the different systems. That is why it is so
important to provide a detailed description of its
constituent elements.
Street map of the municipality
of Rome
The street map of the municipality of Rome makes it
possible to handle street network data, in accordance
with the encoded form by CEU, municipality of Rome.
Street detail level covers a street tract between the
starting and the ending house numbers to which the
following information are associated:
- municipal code
- district
- territorial division
- urban area
- postcode
- interested blocks
- census tracts
- house numbers
One of the most important functions
provided by the street map is the possibility of
searching the street description just on the basis of the
single constituent words.
Other functions enable the operator to find the street
detail information, simply starting from the street name
and the house number.
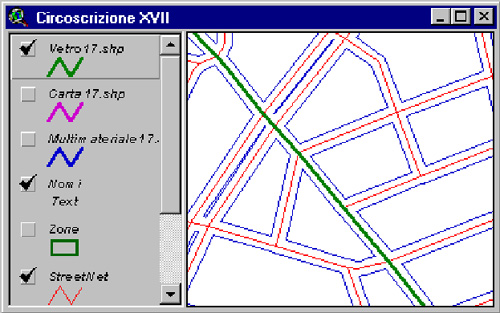
StreetNet graphic
Geographic data
Geometrically, the maps consist of a series of arcs
associated to alphanumeric data, through which a logic
stratification can be made according to the following
main themes:
- street arcs;
- railways;
- administrative boundaries;
- green areas;
- highly built areas;
- hydrography.
Note that each street arc stands
for a single actual roadway. Therefore, most streets are
represented by the centre lines, while streets with
separated roadways are represented by several parallel
arcs.

Alphanumeric data
StreetNet maps are integrated with a lot of
alphanumeric data, which enormously increase the level of
information and make them applicable to different
contexts.
Each geometric element belonging to a geographic
information layer (coverage) is univocally encoded and
relates to other descriptive databases. Each geometric
element (arcs, nodes, points) belonging to a particular
geographic coverage is automatically associated to a
table (FAT feature attribute table) and given a univocal
identification and topological
The information contained in
StreetNet database concerns the following
characteristics:
- street characteristics;
- street name;
- function classification
(highway, backstreet, etc.);
- kind of street (roundabout,
service, exit);
- railway;
- municipal boundaries;
- water tables divided in
classes;
- flyovers and underpasses;
- parks;
- dwelling areas;
- private streets
- compulsory directions, no
throughfare and one-ways;
- house numbers (intervals per
segment).
Census data
ISTAT (Central Statistics Office) carried out a
census aimed at defining the territorial situation in
terms of demographic, social and dwelling aspects. The
resulting statistic data at municipal and census tract
level, are the following:
- Population (civil status, age,
job and economic condition)
- Families and households
(family members, kind of family)
- Dwelling (occupied,
not-occupied, bathrooms present)
together with the following
geographic data:
- Municipal administrative
boundaries
- Inhabited area boundaries
(inhabited centres)
- Census tract boundaries
- Census tract centroids
These statistic data are
fundamental to determine user areas, service quality
indexes, or identifiers, and, consequently, to define
which decisional supporting tools can improve service
planning in terms of efficiency and quality.
Territorial tract census
One of the main goals of SIT is to achieve a basic
knowledge of the territory so that collection and
clean-up services provided by the concern can be more
efficiently planned.
Collected information are partly expressed in terms of
quality standards (such as traffic density, tourism,
commercial activity and trees), which are very
significant for planning working activity (for example,
to draft foliage clean-up plans in autumn, or organise
night shifts for waste collection in streets with heavy
traffic, etc.).
The territory has been divided in territorial tracts
characterised by a main street and two intersecting
streets (in other words, the tract of a street between
two crossroads), which represent the minimum census
entity.
The main information collected is the following:
- roadway length and width;
- pavement length and width on
both sides;
- kind and size of possible
parking areas;
- presence and size of possible
additional areas;
- traffic density (in quality
terms);
- tourism (in quality terms);
- commercial activity (in
quality terms);
- tree presence (in quality
terms);
- kind of possible foliage;
Geographic link
A normalisation of all the street names included in
the StreetNet system has been necessary to establish a
static link between the concern databases connected with
the street map of Rome and the geographic information
system.
This operation was performed almost automatically:
- 90% of the streets have been
linked to the street map system automatically,
using the search street function available in the
system;
- remaining 10% have been linked
manually through a guided search procedure
realised ad hoc.
The result of this normalisation
operation has been permanently stored in "match
street" associative table which makes it possible to
keep the street map and StreetNet databases separated.
"Match street" associative table does not
resolve completely the problem concerning the link
between territorial tracts and the corresponding
StreetNet arcs, therefore it was necessary to establish a
direct link between territorial census data and the
corresponding street arcs. This geographic link is
extremely simple to perform, in fact after the operator
makes a geographic selection of the street arcs
corresponding to the census tract, the system will:
- check that all the arcs belong
to the same street;
- determine the identifier code
of the street - which is called "main
street" - corresponding to the tract, using
"match street" associative table;
- single out the tract
terminator nodes (see the following example,
where N1 is the first terminator node and N2 is
the second terminator node);
- determine the arcs linked to
the first terminator node (in the example: (1),
edgid(8), edgid(5));
- check the arc list to
ascertain that there is no arc belonging to the
census tract "main street";
- determine the identification
code of the "first intersecting
street", through the previously described
link function;
- single out the arcs associated
to the second terminator node (in the following
example, edgid(4), edgid(6), edgid(7) );
- check the arc list to
ascertain that there is no arc belonging to the
census tract "main street";
- determine the identification
code of the "second intersecting
street", through the previously described
link function;
- assess the data concerning the
territorial tract.
The procedure is shown in the
following graphic
Clean-up tract census
The general goal is to achieve a geographic
projection of the alphanumeric data describing the
clean-up service. This goal is to be intended in its
broadest sense: the first step is the implementation of
the first data group in AMA Territorial Information
System, where further useful information will later be
stored to improve and optimise the service.
A good territorial knowledge made it possible to design
and develop the adequate tools for service planning and
control in terms of:
- Service frequency
- Service areas
it is also possible to access
linked data regarding:
- service division
- garbage bins or containers
- service shift
- service mode
Selective collection
The Selective Collection Managing System provides
service control, management and optimisation on the
territory of the municipality of Rome. The service is
co-ordinated by the competent authorities.
To achieve efficient service control and management it is
necessary to determine, precisely and in detail container
type and location, supplying users with tools to compare
the required and the provided services.
The concept of service location has been introduced to
define the provided service. A location consists of a
group of containers of different types (general, for
glass collection, etc.) located in a precise site. The
location is identified through the street name and the
house number, rather than through the corresponding
intersecting streets; however, it can also be identified
through the location own code.
The final goal is to achieve properly sized locations, on
the basis of the kind of users and location capacity. An
adequate container distribution on the territory provides
citizens with a more flexible and efficient collection
service. Moreover it minimises management costs: in fact
an over-sized location slows collection operations and
prevents serving other locations, while at an under-sized
location the operators have to collect manually the
exceeding waste.
Thus the system determines AMA service capacity and
provides quality and quantity parameters to establish
operation and management indexes.
Moreover the system should provide tools to manage
container maintenance and movement operations, creating a
data register of the container, but keeping operation
data available.
Adequate container management makes it possible to link
the data collected during operation (such as waste
quantity, service frequency, etc.) with the interested
territorial units. In fact, once properly determined
where the locations are, it is possible to perform space
analyses whose output can serve as a guideline to plan
the adequate service control and management operations.
In fact, since the analysis on the quantity of wastes
collected can be based on container location, it is
possible to carry out a space analysis on the service,
taking into account all the features specific to the
territory served by AMA, and creating some specialised
thematic maps, such as:
- waste production per type and
per territorial area concerned (block, area,
district)
- users per waste type and per
territorial area
- service per waste type and per
territorial area
- gap between the service
expected by the client and service performed
Project planning
Project Manager: Ing. SALATINO Giovanni
Client Manager: Ing. MARCOTULLI Angelo
Development: Ing. Dip. DIANO Massimiliano, T.I. FORLITI
Stefano, T.I. RE Andrea
System assistance: T.I. FATTORI Fabrizio, T.I. LUCCHETTO
Michele
System description
Introduction
The system, realised
at this point of the project, is divided in three
subsystems:
- The territorial tract census
system;
- The clean-up tract census
system;
- The selective collection
monitoring system.
The architecture of the GIS system,
as described in detail in the previous chapter, enables
clients to use the operating environment offered by
ArcView, while the geographic and alphanumeric data are
provided by the corresponding servers.
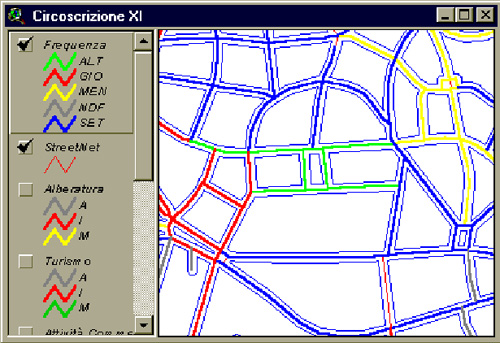
Basic functions
All systems provide a set of functions designed to
meet some general needs, such as:
- map navigation;
- street search and
identification;
- house number detection in a
specific street arc.
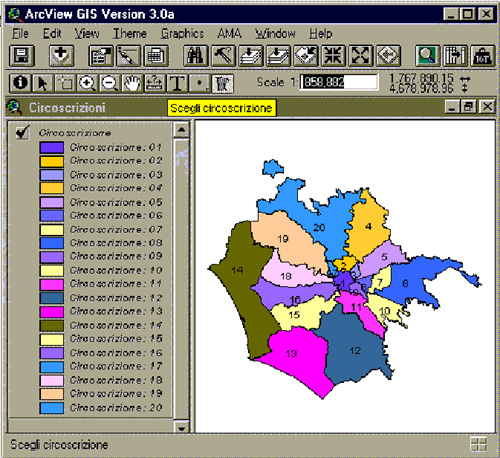
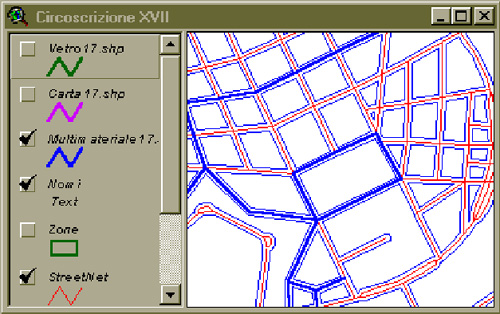
Using the tool "scegli
circoscrizione" (select district), it is possible,
by simply clicking a particular district, to dynamically
load the corresponding portion of the street graphic.
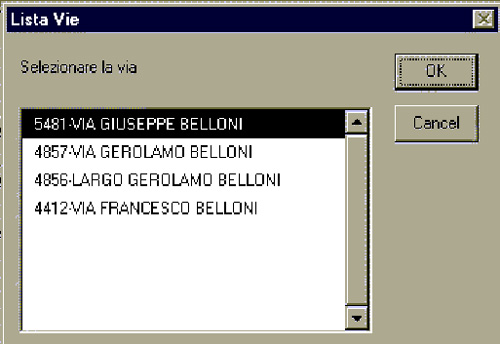
The "ricerca vie" (search
street) button activates a dialog box where the operator
can type the description of the street or of a portion of
it.
For example, by digiting only the word
"BELLONI", a list of the streets containing the
same word in their geographic description is displayed.
Once the name of the street the
operator wants to search is selected, the system
automatically performs these operations:
- it detects the district where
the street is located (if the street goes through
more than one district, a list of the districts
the operator wants to examine will be available);
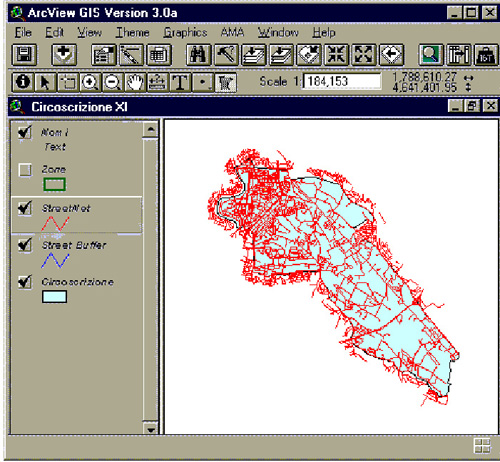
- it displays the map associated
to the district selected;
- it selects the street arcs
which compose the street;
- it reduces the scale at the
minimum in order to include the whole street:
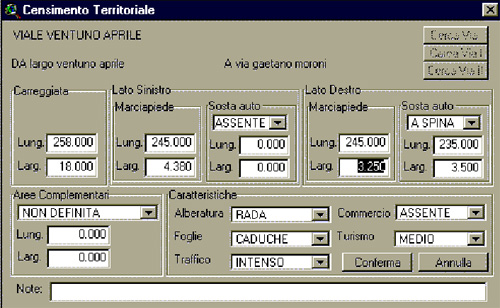
Territorial tract census system
The territorial tract census system makes it
possible to highlight for each street arc some
territorial data, which may be important initially to
check and monitor, and later to develop and plan, the
collection and clean-up service.
Territorial data are collected by tract, that is the side
of a block. Each tract consists of a main street and two
intersecting streets. The intersecting street order
affects the orientation of the street census. Thus, the
left side of the street is identified by looking at the
tract from the first intersecting street to the second
intersecting street.
Taking into account what has already been said about the
street graphic, the territorial tract can consist of more
than one street arc.
Once activated, this feature
provides the following:
- it controls the continuity of
the selected arcs
- it verifies that all the arcs
belong to the same street
- it identifies the main street
and the intersection streets
If the selected arcs belong to
territorial tracts, which are already registered, a
selection list is available in order to filter the
selection. On the contrary, if some arcs belonging to a
territorial tract have been selected, the selection is
automatically extended to all arcs.
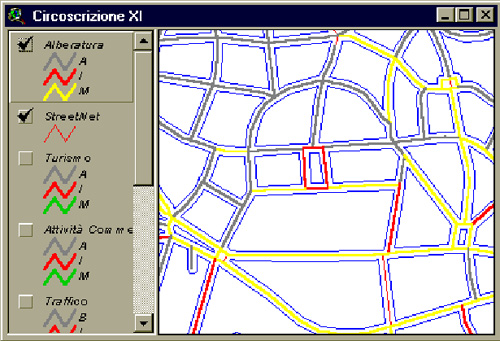
Once the territorial tract census
operation is completed, it is possible to perform
thematic studies of some territorial features:
- tree density;
- traffic;
- commercial activity;
- tourism.
These features are qualitative
indicators classified in three categories (A absent, M
medium, I intensive):
Tree density study
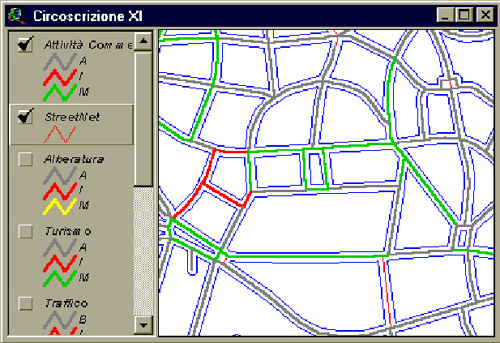
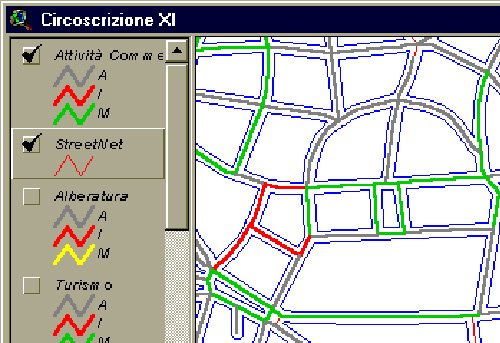
Commercial
activity density study
Traffic study
Clean-up tract census system
The clean-up tract census system
can be activated, like the territorial tract census,
after the street arcs have been selected.
The smallest unit of the clean-up tract is the
territorial tract. This constraint depends on the nee to
take advantage directly of the information level provided
by the territorial census.
For example, if someone wants to know the clean-up
surface covered by a particular division, this can be
calculated using the information about the roadway and
pavement surface detected by the territorial census and
directly linked to the clean-up tract census.
It is possible to directly collect the following data:
Clean-up frequency
study
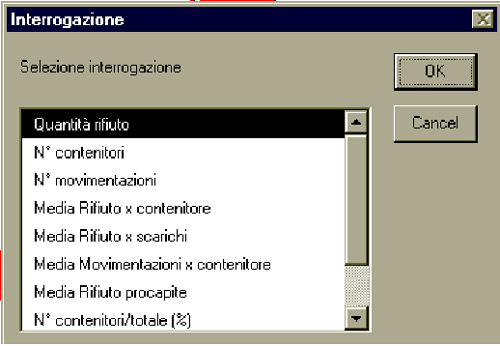
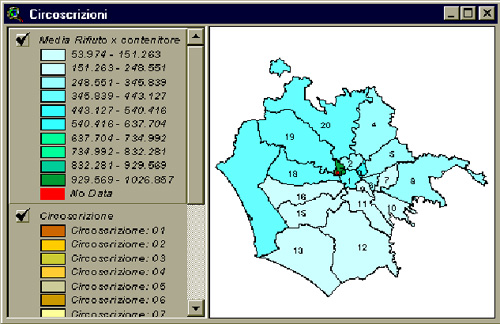
Selective collection monitoring
system
The selective collection monitoring system makes it
possible to carry out statistical thematic studies in
order to assess the progress of the selective collection
system. These studies are dynamically prepared by
querying the server about the selective collection, so
that the server can provide aggregate data per district
about:
- The amount of wastes
collected;
- The number of containers
placed;
- The number of dumping
operations performed;
These basic thematic studies can be
normalised in order to assess the absolute features in
association with other data.
For example, the following thematic
studies are available:
- Average Waste quantity per
Container ;
- Average Waste quantity per
Movement;
- Average Movements per
Container;
- Average Waste quantity per
Citizen ;
- Percentage of Containers over
Total;
- Percentage of Movements over
Total;
- Percentage of Quantities over
Total.
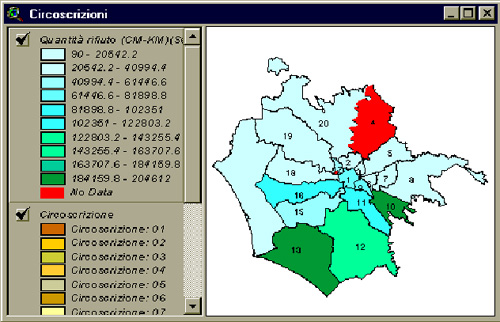
Thematic study of the quantity
of multi-material collected in a month per district
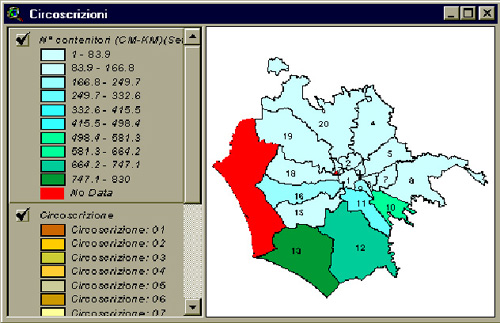
Thematic study of
the number of containers per multi-material per district
Thematic study of
the number of movements for the multi-material containers
per district

Thematic study of
the average quantity of glass collected in a month per
container and per district

Thematic study of the
average quantity of multi-material collected in a month
per citizen and per district
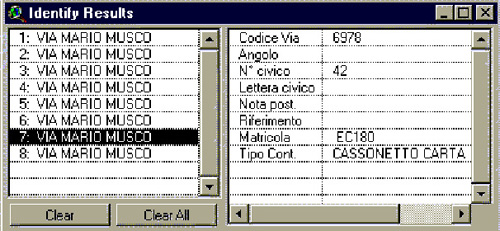
Container location for
collection
The system provides some functions to detect container
location by street.
The container list for the selective collection is
dynamically prepared by querying the selective collection
server.
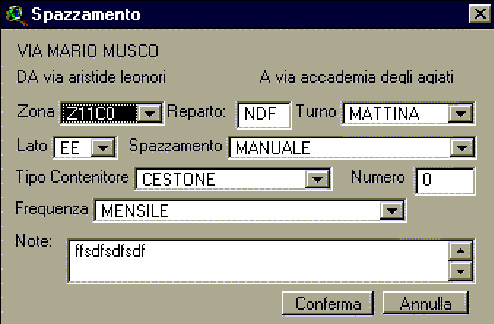
In the following example, after the ‘selezione lista
contenitori’ (container list selection) tool has
been activated, the system has detected a street arc in
Via Mario Musco with the corresponding service features.
Thematic study of
container location for multi-material collection
Thematic study of
container location for paper collection
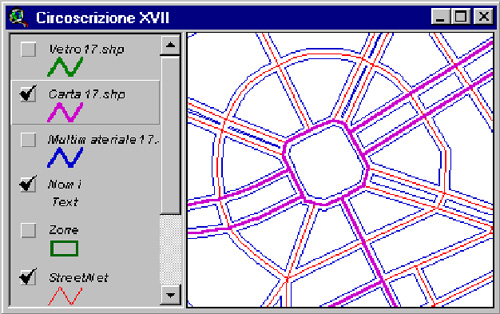
Thematic study of
container location for glass collection
|