 |
|
| USE OF GIS INFORMATION IN A UTILITY DISTRIBUTION MANAGEMENT SYSTEM | |
| Art Bell M3i Systems Europe, PO Box 3969, Erdington, Birmingham, England U.K., B23 7QN, tel (+44 - 121) 377 7233, fax (+44 -121) 386-6036, art.bell@M3isystems.com Abstract This paper describes the use of GIS information in a real-time electricity distribution control-room environment. Uses of GIS information include the on-line export of electrical network connectivity and geo-schematic updates to a Distribution Management System (DMS). DMS installations utilise GIS information for automatic on-line generation of graphical representations for high voltage (HV) 11/6.6 kV feeders and inter-connectors, plus the graphical presentation of general electrical network statistics on a corporate Intranet. Management expectations of this technology, benefits, and acceptance of DMS control engineers are also discussed. INTRODUCTION The primary driving forces within most modern electricity distribution utilities are cost reduction and improved customer service. Centralisation of network control at a well co-ordinated centre reduces costs and outage times. Process automation and optimisation reduce control room skill requirements and improve speed and accuracy of responses to outages. Control and incident-room Distribution Management Systems enable cost savings and customer-service improvements. The capture and maintenance of network records in a GIS with high-quality, consistent connectivity data leads to cost reductions by enabling the use of DMS network-planning and optimisation tools. Areas where GIS technology aids DMS applications includes:
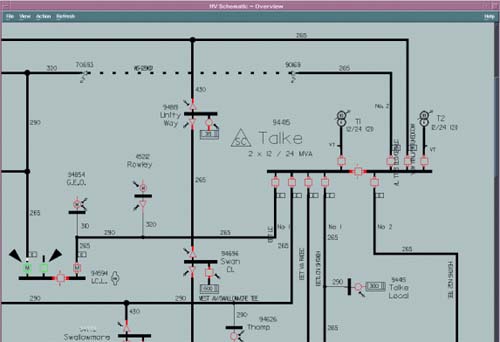
REAL-TIME COUPLING TO THE GIS The benefits realised from a real-time DMS are severely restricted without an electrical system network connectivity model and an associated network graphical display facility. The network connectivity model describes the network topology in terms of all the electrical devices (nodes) and their respective states and attributes, and the connections (links) between them. The network connectivity model enables the inclusion of advanced DMS applications while the graphical display facility presents the results of DMS processes. The network connectivity model and geo-based diagrams can be obtained through an on-line GIS – DMS interface. Many DMS implementations oblige the user to enter connectivity data and display information into the DMS via specialised database and diagram building tools. This approach unfortunately forces the user to repeat data maintenance steps that may already be completed in a GIS. A real-time linkage between GIS and DMS environments halves data maintenance activities and greatly reduces DMS data initialisation costs. Following an initial data export from the GIS to the DMS, the systems are typically synchronised through the on-line export of connectivity changes. These connectivity changes take the form of ‘patch’ files in which links and devices (nodes) are either added or deleted and/or the device attributes are altered. Every time a GIS user makes a change to the network a sequentially numbered patch is created and posted to the DMS. Within the DMS, this patch is applied to a test image of the internally held, preferred-state, connectivity model. If the patch is verified as consistent with the model, then it is permanently applied to the real DMS model and any applications using that part of the model are notified of the change. If there is a problem applying the patch, then diagnostic messages are returned to the GIS. SCREEN VISUALISATION OF COMPLEX ELECTRICAL DISTRIBUTION NETWORKS Most utilities look towards a DMS to enable them to move away from the need for large ‘dressable’ wallboards for their network control and incident management. Distribution control centre wallboards typically consist of hundreds of A1 sheets covering tens of square metres of wall space. Some DMS vendors have tackled this visualisation problem using only the geo-schematic or ‘ortho-schematic’ representations of the network using a combination of display manipulation techniques such as pan, zoom and de-clutter, and by using multiple windows with colour highlighting trace facilities. These manipulation techniques can be effective where there is minimal network complexity, such as with Extra High Voltage (EHV) or sub-transmission level networks. However, this intermediate display management approach become inadequate where there is significant network complexity as in heavily meshed HV distribution networks. Many DMS implementations rely on an ortho-schematic for visualisation, as well as for the source of connectivity. It is often necessary to specifically draw these diagrams within a DMS either because there is no GIS-based import version available, or the layout of the ortho-schematic does not have sufficient space surrounding the device symbols to apply electronic dressings. Since most utilities eventually invest in a GIS facility for their drawings, they are frequently faced with the need to maintain two similar versions of the ortho-schematic: one in the GIS and another in the DMS. This data and diagram duplication is not unmanageable at the EHV level, but becomes an important concern in HV networks where there can be tens of thousands of changes per year to the preferred-state model. M3i’s use of GIS-based diagrams and dynamically generated schematics or Interactive Feeder Views (IFVs) avoids the re-drawing and double maintenance problem between DMS and GIS platforms. It is a relatively straightforward task to link GIS connectivity to the DMS. Using GIS-based diagrams and DMS applications, trouble calls can be associated with network elements, likely fault-clearing devices identified and the network graphically visualised and manipulated.
INTERACTIVE FEEDER VIEWS (IFVs) |
|
 M3i has developed the capability to
automatically generate distribution feeder-based
schematic or one-line control diagrams referred to as
Interactive Feeder Views (IFVs). IFVs are generated
entirely from the non-graphical GIS link - node
connctivity model and show control element connectivity
for feeders in a manner that is uncluttered by adjacent
or crossing feeders. M3i has developed the capability to
automatically generate distribution feeder-based
schematic or one-line control diagrams referred to as
Interactive Feeder Views (IFVs). IFVs are generated
entirely from the non-graphical GIS link - node
connctivity model and show control element connectivity
for feeders in a manner that is uncluttered by adjacent
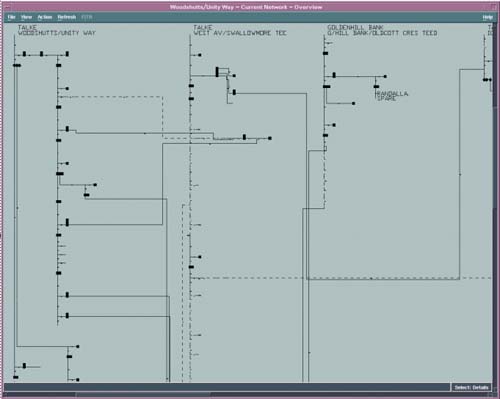
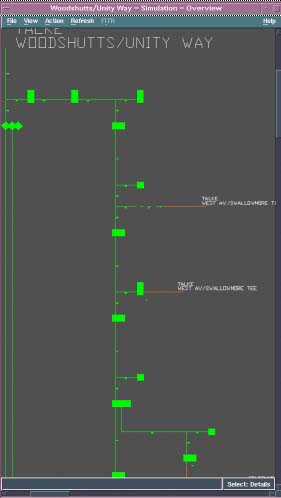
or crossing feeders. Because IFVs are not constrained by geographical layout, or by the need to show information for adjacent meshing feeders, they are very efficient in utilising CRT display space. These self-generating IFVs initially show a single feeder, from source to open points. Conventional pan, zoom and de-clutter manipulation techniques apply to IFVs along with the facility to pull out multiple navigation and magnified view windows from sections of the diagram. Another valuable DMS viewing tool is the summarise facility. Based on rules decided by the customer, various areas of the feeder are collapsed to a single block which is annotated with the combined details of the summarised area—total load, customers, incidents, results, etc. This allows the diagram to be drawn in its minimal form. Any summarised block can be ‘clicked’ and will then expand in order to show the full detail therein. If a wider visualisation is required, then ‘clicking’ on a tie point, associated with an open switch, will regenerate the diagram bringing in the adjacent feeder. This extra feeder regeneration can be continued indefinitely, though, in practice, there is rarely need for more than ten feeders. The various facilities of the IFVs allow the rapid selection by the user of the ideal customised diagram for any task being undertaken. These feeder diagrams, supplemented by conventional ortho-schematics and geo-schematics, provide a very high quality of network visualisation for DMS control and incident-management tasks.
USER ACCEPTANCE OF SCREEN-BASED VISUALISATION Control engineers carry a heavy responsibility, and rely totally upon the network representation and its device state "dressing" to allow them to control the network safely. Understandably, they tend to be conservative about losing any tried-and-tested means of visualisation. When faced with the inevitability of migration to a screen-based control environment, the initial instincts of control engineers is to format the screens with pictures they are familiar with, such as wallboard images. When such a "familiar view" scheme is tried in a DMS, there is generally a reaction against the lack of overview visualisation. However, there is usually eventual acceptance of such displays where the complexity and network extent is not great and where the automated diagrams use good ergonomics and provide easy windowing and highlighting facilities. The ease of use of such displays may be little better than the wallboard, but the cost saving and the advantages of flexibility and location of CRT-based systems justifies the use of this technology. The initial reaction of control engineers is generally negative when offered a ‘different type’ of diagram, such as IFVs. However, once the user become familiar with the new visualisation and find they can operate from a diagram they have never seen before, they become confident that there is no need for overview facilities as long as all the necessary control information is on the screen. Experience shows that control engineers then embrace the modern DMS visualisation with enthusiasm, and, given a choice, prefer to operate from DMS diagrams. Another aspect of user acceptance
of CRT-based, automated DMS installations in general, and
of IFVs in particular, is the ease with which new
electrical-engineering staff can become fully competent
in safely carrying out control engineer functions. With
fast, automatic cross-referencing of fault information to
relevant feeders at the click of a mouse button, the
novice rapidly overcomes some of the hurdles involved in
becoming an experienced control engineer. Clear
representation of the network on IFVs gives the beginner
a fast and safe learning environment and the capability
to get up to speed rapidly. TYPICAL DMS APPLICATION AND ANTICIPATED BENEFITS One DMS application that utilises connectivity and geo-schematic display information from a GIS is Trouble Call or Outage Management. Some anticipated benefits from an integrated DMS with an Outage Management application and a real-time GIS interface includes:
An interface between DMS and GIS platforms is just one example where data co-ordination and data interfaces can provide operational and cost benefits to a utility. Figure 4 shows a consolidated view of the various automated systems that typically exist in a modern electricity distribution company. Information management, data exchange, co-ordination and maintenance between various automation systems within a utility are pressing concerns that need further attention. CONCLUSION In summary, experience with utilising GIS information within a DMS control centre has shown:
REFERENCES
|