Applications of GIS to
cancer research at the National Cancer Institute
Linda Williams Pickle,1
Ellen F. Heineman,1 Mary H. Ward,1 John R. Nuckols,2
Marcia Gumpertz,3
B. Sue Bell1
1 National Cancer Institute,
Bethesda, MD 20892
2 Dept of Environ Health, Colorado
State University, Ft. Collins, CO 80526
3 Department of Statistics,
North Carolina State University, Raleigh, NC 27695
Abstract:
The National Cancer Institute has an active research program investigating
geographic patterns of cancer in the U.S. In this talk, we describe the development of a complex GIS (Long
Island), use of GIS to estimate exposures for environmental epidemiology
studies, statistical analyses incorporating spatial information, and the use of
maps to communicate cancer statistics.
Introduction
The National Cancer Institute (NCI)
has a long history of mapping cancer data, having published a series of atlases
that led to significant advances in understanding the regional differences of
cancer rates in the U.S. (Mason 1975; Mason 1976; Mason 1981; Pickle 1987;
Pickle 1990; Devesa 1999) Although
mortality rates had been published for decades in tabular form, it wasn’t until
Mason and colleagues mapped the rates at the county level that striking
geographic patterns were evident. For example, high lung cancer mortality rates
that were seen in coastal cities were later found to be due to asbestos
exposure from shipyard work during World War II (Blot 1978). Also, high oral
cancer rates among white women in southeastern states were found to be caused
by their habit of dipping snuff (smokeless tobacco) (Winn 1981).
With improvements in computer
hardware and widespread availability of software for geographic information
systems (GIS), mapping is no longer limited to academic cartographers or to
national agencies with extensive computer resources. The role of NCI, for example, has changed to one of facilitator
for localized geographic studies and developer of geographic methods widely
applicable to cancer data, in addition to its traditional role of producing
national statistics and conducting studies to determine the cancer causes and
effective prevention, diagnosis and treatment.
GIS itself is comprised of three general areas: database development (building
the GIS), spatial analysis and visualization of georeferenced data. In this paper, we present examples of
ongoing work at NCI in each of these areas.
Long
Island Breast Cancer Study Project GIS
An example of a complex GIS is one
NCI is developing for Long Island, NY.
The northeastern U.S. has had high rates of breast cancer mortality for
many years. The Long Island Breast Cancer Study Project grew out of the
community’s concern about possible environmental causes of the high breast
cancer rates there (Figure 1). In response to this community concern, Congress
passed a law in 1993 directing that research be conducted on environmental
factors that may contribute to breast cancer risk, and mandated the creation of
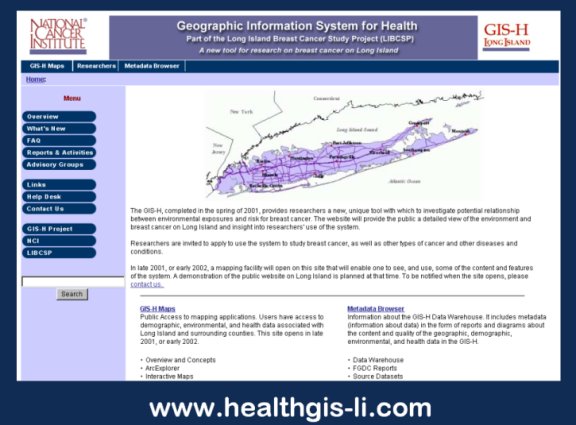
a GIS for breast cancer studies on Long Island. This health GIS (GIS-H) focuses on Nassau and
Suffolk counties (Long Island), New York. However, additional environmental
data are included with less detail and geographic precision for areas 50
kilometers from the two counties, and within a 100 mile radius from the
mid-point of the boundary line between the two counties. The extended area
includes counties in New York, Connecticut, New Jersey, New York, Pennsylvania,
Rhode Island, and Massachusetts. The GIS-H includes a rich data warehouse of
over 80 datasets, such as air quality, demographic data, hazmat sites,
industrial facilities, radioactive sites and water quality. It is flexible and
expandable to better respond to research needs. As additional relevant exposure data become available, they will
be added to allow researchers to explore important exposure-disease
relationships. A number of analytic tools have been added as extensions to the
basic system, ranging from a simple rate calculator to cluster and empirical
Bayes analysis tools. This system is expected to be released this winter, after
which interested researchers are invited to submit proposals to use these data.
More information is available at the web site http://www.healthgis-li.com (Figure 2).
Environmental
exposure assessment
A GIS can be a useful tool for estimating exposure
to environmental contaminants by providing information about potential
exposures that cannot be obtained through traditional epidemiologic
methods. We used a GIS to estimate
indirect exposure to agricultural pesticides and nitrate levels in private
wells in two cancer epidemiology studies.
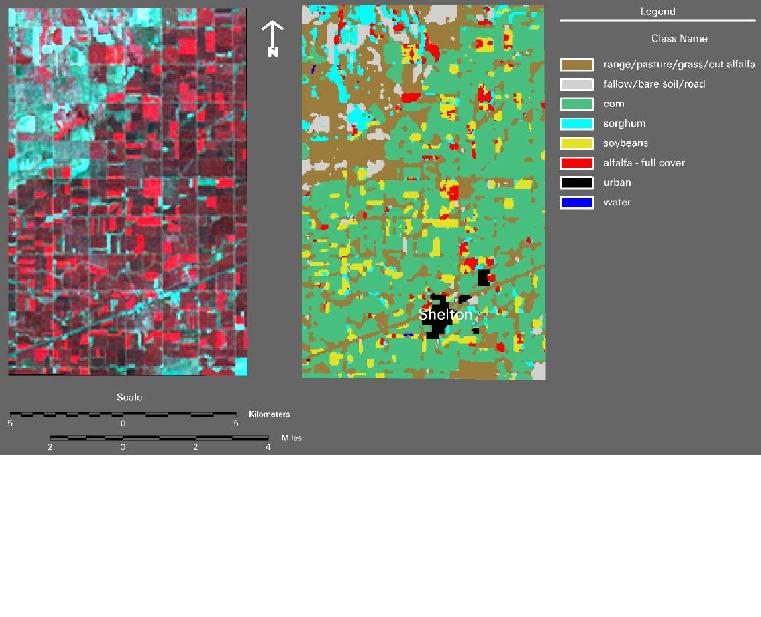
In the first study, we used satellite imagery to reconstruct historical
crop patterns in south central Nebraska using historical Farm Service Agency
records as a source of ground reference data (Ward et al., 2000) (Figure 3). Residences from a population-based
epidemiologic study of non-Hodgkin's lymphoma (NHL) were mapped in the
GIS. Corn, soybeans, sorghum, and
alfalfa were the major crops grown in the study area and 22 percent of
residences had one of these crops within 500 meters of the residence, an
intermediate distance for the range of drift effects from pesticides applied in
agriculture. We estimated probable
exposure to crop pesticides by assessing the proximity of residences to
specific crop species, and assigning probabilities of pesticide use based on
available pesticide use data (Ward et al., 2000) (Figure 4). This study
demonstrated that by using a GIS, zones of potential exposure to agricultural
pesticides and proximity measures can be determined for residences in a
study. We are currently using the same
method to estimate probable exposure to pesticides in a NHL study in Iowa, and
in a childhood leukemia study in California.
In both of these studies, we are measuring levels of pesticides in
carpet dust samples from the participants residences in order to calibrate and
validate the GIS-based exposure metric.
In the second study, we are using a GIS to estimate
exposure to drinking water nitrate for census block groups (average population
= 1000) in the Platte River Valley of Nebraska and northern Colorado. Nitrate levels for water supplied by
utilities in the study area were obtained from the respective State Health
Departments. We matched census block
group populations to utility-based nitrate levels using a GIS-based matching
procedure developed at Colorado State University (Small et al., 2001). The procedure matches on utility name,
township name and location, and/or on location of utility-specific point locations
in the water distribution system. We are using a GIS-based statistical modeling
approach (Nuckols et al., 2000) to estimate nitrate levels for census block
groups where the population uses
private wells as a water supply.
Our approach is based on a method reported by Drunliner et al. (1996) by
which nitrate levels in wells located in the High Plains Aquifer of Nebraska
were predicted based on land-use and geophysical variables in a zone of
hydrologic influence around each well. We used remote sensing and GIS technology to locate and
quantify 12 different geophysical and land use variables related to nitrate
transport in ground water for the period 1990-2000. We are currently in the process of
calibrating and validating this model using measurements of nitrate in wells in
the 1990s. We will calculate exposure
metrics for each census block group based on the nitrate levels in public and
private supplies weighted by the population served. We will evaluate the association between the nitrate exposure
metrics and cancer incidence rates from 1990-1999.
Spatial
data analysis
NCI is active in the development and
use of methods for spatial data analysis.
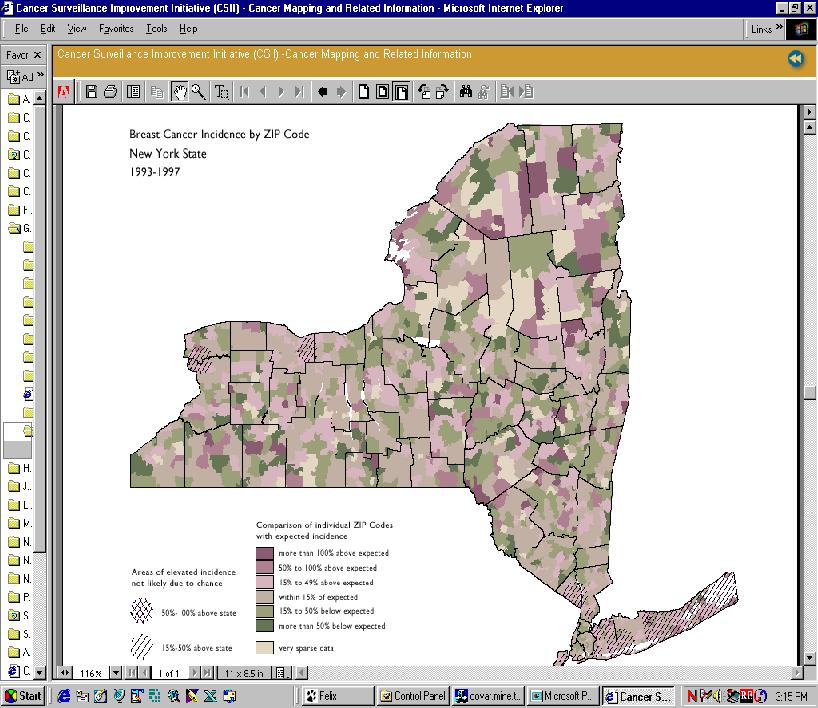
Software to detect and evaluate the statistical significance of spatial
or space-time disease clusters is available on our web site (SaTScan at http://srab.cancer.gov/othersoft.html;
Kulldorff 1997a). This software has
been used, for example, to identify significant clusters of high rates of
several cancers at the zip code level in New York (Figure 5) and has been used
numerous times to evaluate cancer clusters brought to our attention by the
public (Kulldorff 1997b, Kulldorff 1998). We are currently working to extend
this program to detect elliptical clusters; the current version detects
circular clusters.
Multilevel hierarchical statistical
models are being used for a number of applications at NCI. One major project is the prediction of the
number of new cancer cases expected in states without a tumor registry (Pickle
2001). Poisson models are used to
predict cancer incidence from cancer mortality and sociodemographic and
lifestyle covariates for the counties with registries, then the results are
applied to other counties to make predictions on the basis of their mortality
and covariate data. Tables and maps by
state will be first published next year for the four most common cancers. Plans are to expand the project to include
non-NCI-sponsored registries’ data in the future and to report on more types of
cancer.
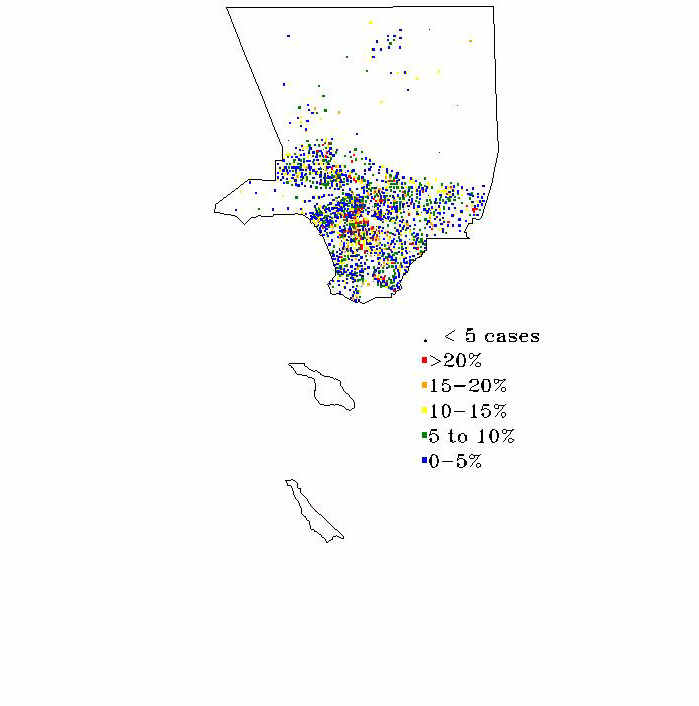
A more standard type of spatial
analysis is exemplified by a study of the geographic patterns of late stage
breast cancer in Los Angeles county (Figure 6). Here, we modeled the proportion of all incident breast cancer
cases in the county who were diagnosed with late stage disease for the purpose
of identifying population subgroups and geographic areas that could benefit
from additional mammographic screening.
For this study, a “late” diagnosis was defined as distant stage at
diagnosis, or regional stage with tumor size greater than 1 cm. The multilevel
logistic model included covariates specific to the individual and her tumor as
well as socioeconomic characteristics of the census tract where she resided at
the time of diagnosis.
A GIS was used to compute distance between the census
tract centroid for each case and the nearest mammographic facility and this
distance was also included as a predictor. Because of the requirement to maintain
confidentiality of cancer patients, this cancer registry only provided a
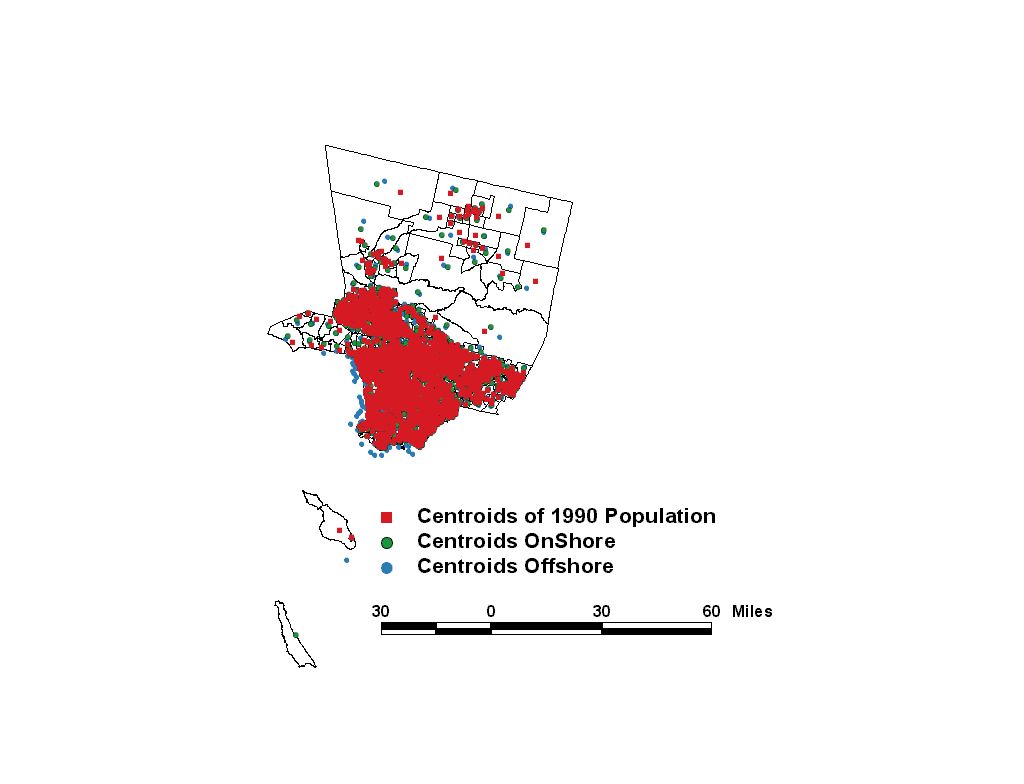
patient’s census tract location as a geographic reference for analysis. The analysis plan was to use geographic
centroids for the census tracts provided on the CensusCD+Mapsä as a surrogate for the location of cancer
cases. However, the centroids for most
tracts along the coastline were actually in the water because these centroids
were based on polygons that included state waters (“centroids off shore” in
Figure 7). In order to have a more
accurate location for residences of cancer cases, centroids were determined
based only on the onshore portions of the tract polygons using an ArcView
script (“centroids on shore” in Figure 7).
The large size of tracts in the northern half of the county suggested
that perhaps population centroids would better reflect the distance to facility
for most residents. LandScan estimates the spatial distribution of residential
populations using census data and other geospatial data such as land use/cover,
slope, topography, roads and nighttime lights.
Centroids for census tracts were based on the population distribution at
a resolution of 15 minutes, about 450 meters (“centroids of 1990 population” in
Figure 7). These were little changed
for the urban tracts but were relocated onshore for the coastal tracts and
relocated closer to the developed areas for the more rural northern tracts.
Exploratory
spatial data analysis
Exploratory spatial data analysis
tools are a hybrid of analytic and data visualization tools. NCI is taking an
active role in the development of such tools through in-house research, small
contracts with university researchers, and participation in a grant from the
National Science Foundation for Digital Government Quality Graphics. Innovative
graphical designs are evaluated using focus groups, usability tests and
cognitive experimentation. Examples include parallel coordinate plots linked to
maps (MacEachren 2001), micromap plots of linked panel graphs and maps (Carr
1998), conditional choropleth maps (Carr 2000) and animated maps (MacEachren
1998). These interactive graphical tools allow the researcher to explore the
geographic patterns in the data over time or in conjunction with graphs of
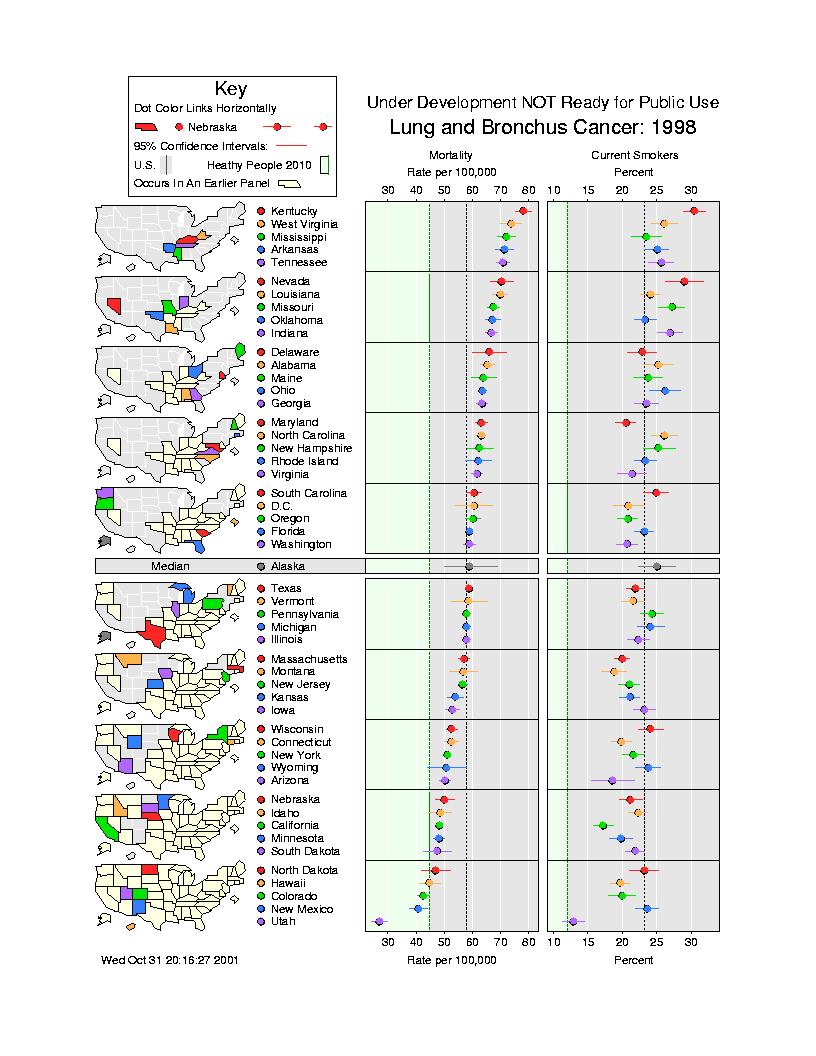
related statistics. For example, Figure
8 shows an ordered graph of lung cancer mortality by state alongside a graph of
the proportion of residents who ever smoked cigarettes. These graphs are
visually linked to geographic location by color coding on the small maps to the
left of the graphs. The maps can be used as an index by finding the place on
the map first, then reading across to find the statistical values for that
state. Alternatively, the reader can start by examining the values of the
cancer rates or behavioral factor, then looking for clusters of states that
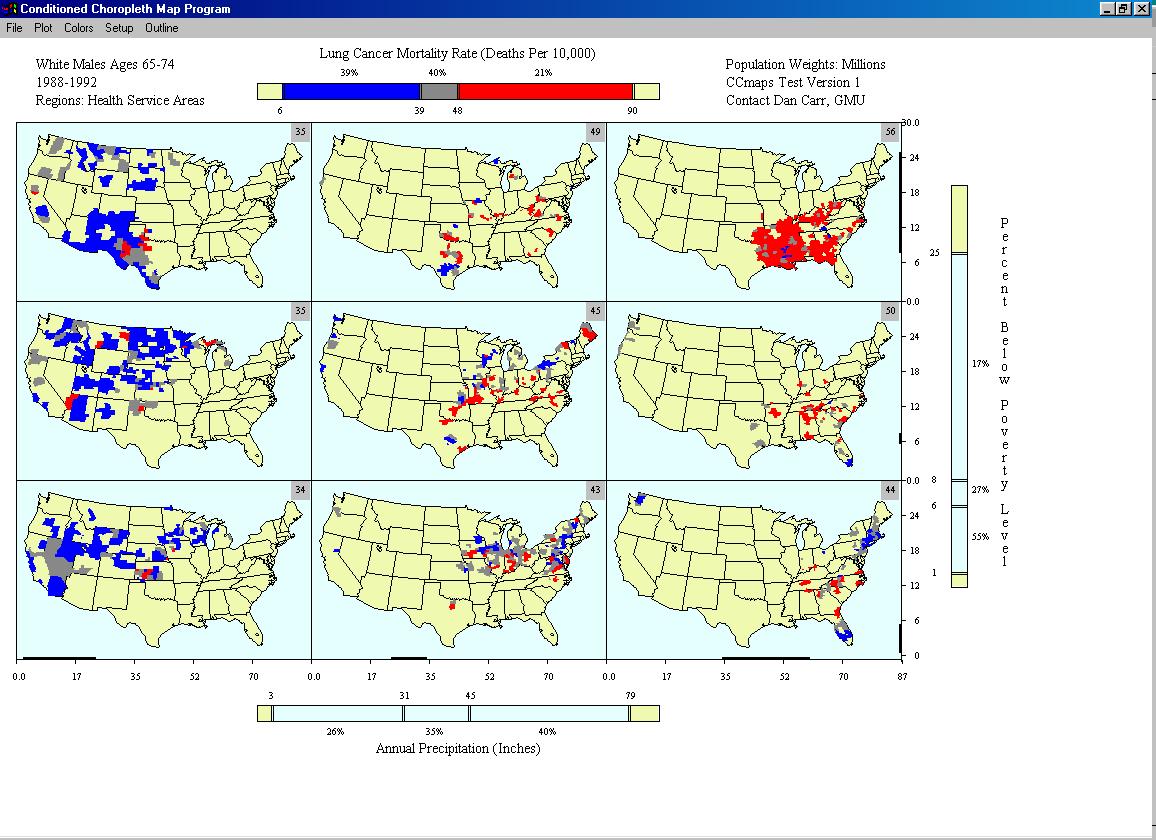
rank similarly on the graphs. Another
new exploratory tool is the conditioned choropleth map, where a single
choropleth map of cancer rates is decomposed into several separate maps
according to values of other characteristics of the places (Carr 2000). For
example, Figure 9 shows lung cancer mortality rates for older white males
stratified by the proportion of residents living below poverty and by the area
rainfall amount. This interactive graphic can be used to explore the
associations of low income and damp weather conditions on lung cancer rates.
Slider bars allow the user to try different cutpoints for all the variables in
order to focus on patterns of interest.
Communication of cancer statistics
In addition to designing tools that
are useful to researchers, there is a need to communicate georeferenced data to
policy makers, clinicians, patients, and the lay public. We are conducting
research in the area of data visualization, a continuation of work begun at the
National Center for Health Statistics for paper maps and graphs, which is now
being extended to computer-based presentation.
A major project where we are applying this research is the State Cancer
Profiles Project, a web-based system that characterizes the cancer burden in
each state. Interactive graphs and maps
will be used to visually support decisions on where to focus cancer control
efforts. Thus this system is targeting
cancers for which effective screening or prevention interventions are
available: stop smoking campaigns for lung cancer, screening for colorectal,
breast and prostate cancer, sun avoidance education for melanoma of the
skin. This system will integrate
surveillance data with cancer control planning, characterize geographic areas
and demographic groups in each state and identify potential health
disparities. Several of the exploratory
spatial data analysis tools are being tested for inclusion in this web-based
system. Conditional choropleth maps are
being used, for example, to show the geographic distribution of counties within
a state that have high versus low cancer mortality rates cross-classified with
the direction of change in these rates.
Challenges in communicating
information graphically for the State Cancer Profiles Project include ensuring
correct interpretation of the statistics by a diverse audience and complying
with Section 508 (29 U.S.C. ‘794d). In
1998, Congress amended the Rehabilitation Act to require Federal agencies to
make their electronic and information technology accessible to people with
disabilities. The technical standards
took effect June 21, 2001 (http://section508.gov/). By their nature, geographic information systems are visual but
now we have the challenge of ensuring that the visually impaired also have
access to the information displayed in maps.
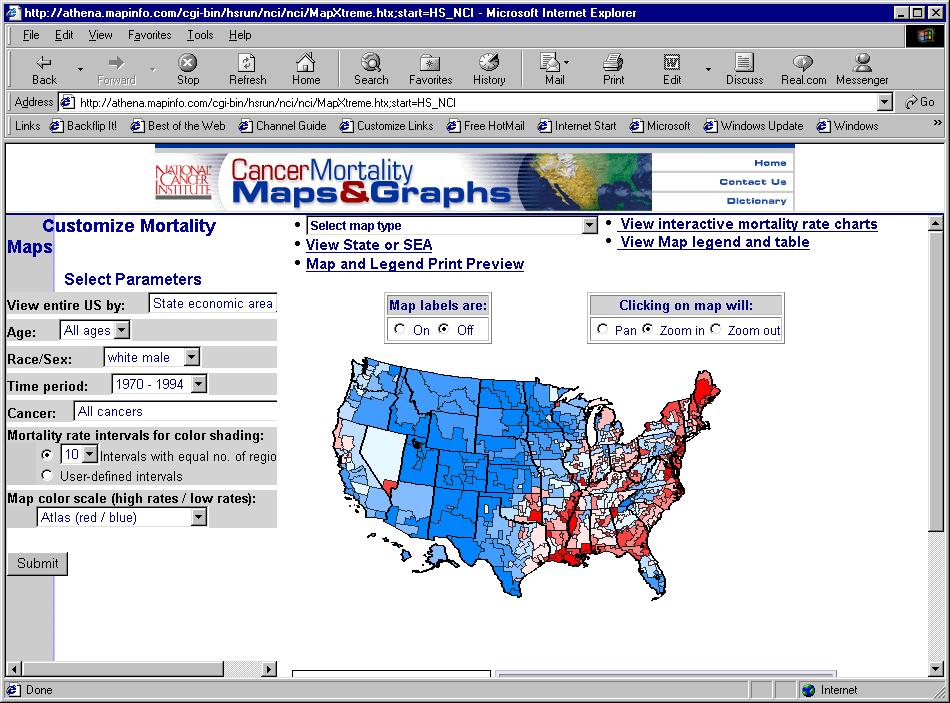
The
new website for the latest NCI cancer atlas (http://cancer.gov/atlasplus/) may
be the first web site at NIH to be compatible with Section 508
requirements. This site provides more
information than was included in the printed atlas (Devesa 1999), including
interactive maps, graphs (which are accessible to the blind and
visually-impaired), text, tables and figures showing the geographic patterns
and time trends of cancer death rates for the time period 1950-1994 for more
than 40 cancers (Figure
10).
GIS
grants
NCI published a Program Announcement for “Geographic-based research in cancer control and epidemiology” last year (http://grants.nih.gov/grants/guide/pa-files/PAS-00-120.html and http://grants.nih.gov/grants/guide/pa-files/PAS-00-121.html). We have just awarded our first grants in this area, including
References Blot WJ, Harrington M, Toledo A, et al. Lung
cancer after employment in shipyards during World War II. New England Journal of
Medicine 299:620-4, 1978. Carr DB, Wallin JF. Carr DA. Two new templates for epidemiology
applications: Linked micromap plots and
conditioned choropleth maps. Statistics
in Medicine 19:17-8, 2000. Carr DB, Olsen AR, Courbois JP, Pierson SM, Carr
DA. Linked micromap plots: Named and
described. Statistical Computing &
Graphics Newsletter, Vol 9 No 1. pp. 24-32. 1998. CensusCD+Maps, GeoLytics, Inc., East Brunswick,
NJ. Devesa SS, Grauman DG, Blot WJ, Pennello G, Hoover RN,
Fraumeni JF Jr. Atlas of cancer mortality in the United States, 1950-94.
Washington, DC: US Govt Print Off, 1999. [NIH Publ No. (NIH) 99-4564]. Drunliner AD, Chen HH, McGrath TS. Relations of
non-point source nitrate and atrazine concentrations in the High Plains Aquifer
to selected explanatory variables in six Nebraska study areas. Water Resources Report 95-4202. U.S. Geological Survey. Lincoln, Nebraska.
1996. Kulldorff
M: A spatial scan statistic. Communications in Statistics: Theory and
Methods, 26:1481-1496, 1997a. Kulldorff M, Feuer EJ, Miller BA, Freedman L. Breast
cancer clusters in northeastern United States: A geographical analysis. Amer J
Epidemiol 146:161-170, 1997b. Kulldorff M, Athas WF, Feuer EJ, Miller BA, Key CR.
Evaluating cluster alarms: A space-time scan statistic and brain cancer in Los
Alamos. Amer J Public Health 88:1377-1380, 1998. LandScan: A high resolution population
distribution model. Oak Ridge National
Laboratory, U.S. Department of Energy, http://www.ornl.gov/gist. MacEachren
AM, Boscoe FP, Haug D, Pickle LW. Geographic Visualization: Designing
manipulable maps for exploring temporally varying georeferenced statistics.
Proceedings of the IEEE Information Visualization Symposium, Research
Triangle Park, NC, Oct. 19-20, 1998, pp. 87-94. MacEachren AM, Hardisty F, Wheeler M, Gahegan M,
Dai X, Guo D, Takatsuka M. Supporting visual integration and analysis of
geospatially-referenced statistics through web-deployable, cross-platform tools.
Proceedings of the National Conference for Digital Government Research, Los
Angeles, CA, May 21-23, 2001. Mason TJ, McKay FW, Hoover R, et al. An atlas of
mortality from selected diseases. Washington: USGPO (DHHS pub no (NIH)
81-2397), 1981. Mason TJ, McKay FW, Hoover R, et al. Atlas of
cancer mortality among U.S. nonwhites: 1950-1969. Washington: USGPO (DHEW pub
no (NIH) 76-1204), 1976. Mason TJ, McKay FW, Hoover R, et al. Atlas of
cancer mortality for U.S. counties: 1950-1969. Washington: USGPO (DHEW pub no
(NIH) 75-780), 1975. Nuckols JR. Estimating Exposure to Nitrate and
Pesticides in Drinking Water in the Platte River Valley. Contract P896943 – NCI-OEB. Westat, Inc. Rockville, Maryland. 2000. Pickle LW, Mason TJ, Howard N, et al. Atlas of U.S.
cancer mortality among whites: 1950-1980. Washington: USGPO (DHHS pub no (NIH)
87-2900, 1987. Pickle LW, Mason TJ, Howard N, et al. Atlas of
U.S. cancer mortality among nonwhites: 1950-1980. Washington: USGPO (DHHS pub
no (NIH) 90-1582, 1990. Pickle LW.
Prediction of incident cancer cases in non-SEER counties. Proceedings of
the Biometrics Section of the 2000 Annual Meeting of the American Statistical
Association, 2001, p. 45-52. Small L, Maxwell S, Ward MH, Nuckols JR. Using technology to investigate the
association of land use and exposure to nitrates. Abstract. Proceedings: 3rd Intl Conf geospatial Information in
Agriculture and Forestry. Nov 5-7, 2001,
Denver, Colorado. Veridian, Arlington, VA. 2001. Ward MH, Nuckols JR, Weigel SJ, et al. Environmental
Health Perspectives 108:5-12, 2000. Winn D, Blot WF, Shy CM, et al. Snuff dipping
and oral cancer among women in the southern United States. New England Journal of Medicine 304:745-9, 1981. Figure Legends Figure 1. The Long Island Breast Cancer Study Project Figure 2. The Long Island Breast Cancer Study
Project home page Figure 3. Original Landsat image (left) and the land cover
map (right) for a region of Buffalo county including Shelton, Nebraska (Ward et
al. 2000) . Figure 4. Probable
exposure to crop pesticides at individual residences (Ward et al. 2000). Figure 5. Cancer incidence at the zip code level in New
York, with significant clusters hatched
(http://www.health.state.ny.us/nysdoh/cancer/csii/nyscsii.htm) Figure 6.
Proportion of new breast cancer cases with late stage at diagnosis in Los
Angeles county. Figure 7. A
comparison of geographic and population centroids for census tracts in Los
Angeles county. Figure 8. Sample
micromap plot of lung cancer mortality rates linked to smoking information by
state. Figure 9. Sample
conditioned choropleth map of lung cancer mortality rates stratified by degree
of poverty and rainfall. Figure
10. Customizable map selection on the NCI Atlas web page.