Locating Facilities for EMS Response to Motor Vehicle Collisions
Ellen K. Cromley and Xiaojing Wei
Network analysis is used to model locations of existing ambulance dispatch sites and coverage areas in relation to the locations of all motor vehicle crashes in Northeastern Connecticut. Different patterns of actual EMS response are observed in areas with different coverage. Location analysis identifies candidate sites for improving EMS response.
INTRODUCTION
Motor vehicle collisions are a leading cause of mortality and injury in the U.S. and in Connecticut (National Highway Traffic Safety Administration, 1997; Department of Public Health, 1999). Emergency medical systems (EMS) are an important service addressing this problem. Geographic information systems and related technologies like GPS are being used to improve emergency operations or to study patterns of actual response (Foley, 1994; Nale, 1995; Reiach, 1999). A limitation of this research is that utilization is not an unbiased measure of availability. GIS has less frequently been used to model the likely coverage areas of existing ambulance locations to identify gaps in coverage and to assess factors that limit the area an ambulance can cover even if it is available with a crew assembled (Estochen, Strauss, and Souleyrette, 1998).
The purpose of the research presented here was to assess the locations of existing ambulance facilities in Northeastern Connecticut in relation to the locations of motor vehicle collisions to identify areas that may not have adequate coverage. Network analysis was used to model coverage areas for each existing ambulance site. Overlay analysis identified the collisions that are and are not covered within the modeled response time. Candidate sites for adding ambulance facilities were identified and evaluated to determine how many uncovered collisions could have been served by each site. The results of this analysis were used as input in a maximal covering model to identify the best site or sites to open to improve coverage.
DATA AND METHODOLOGY
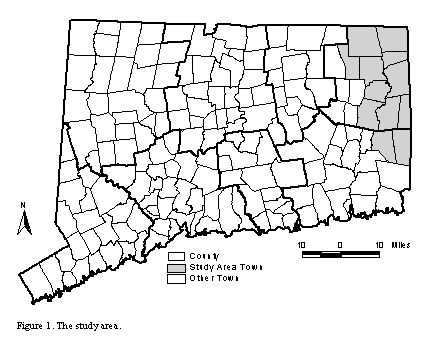
The primary study area includes 12 towns in Windham and New London Counties in Northeastern Connecticut (Figure 1). The study area is approximately 470 square miles and had a population of approximately 90,000 in 1995 (U. S. Census Bureau, 2000). This area is ex-urban, rural in character but with fairly high population densities. Towns are the basic unit of local government in Connecticut and correspond to Census minor civil divisions. There are 169 towns in the state. There are no unincorporated areas in Connecticut.
The delivery of EMS services in Connecticut is the responsibility of town government and the lack of regional systems for EMS delivery is a recognized problem. The 12 towns in the study area are served by Quinebaug Valley Emergency Communications, Inc., a non-profit corporation founded in 1974 to establish and administer an improved emergency notification and dispatch system in Northeastern Connecticut (DonFrancisco, 2000). The agency receives 911 emergency calls, dispatches the appropriate police, fire, or ambulance service, coordinates emergency communications at the scene, and provides continuous radio coverage through the 12-town area. Three databases are needed for the analysis: a database of ambulance facilities in the study area, a database of motor vehicle collisions in the study area, and a road network database for modeling coverage areas.
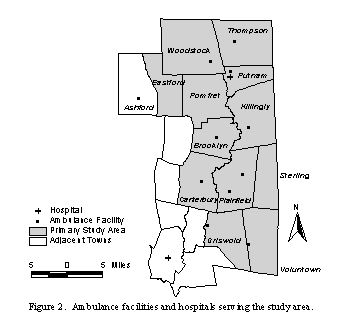
Data on existing ambulance service were obtained from Quinebaug Valley Emergency Communications, Inc. (DonFrancisco, 2000). There are 11 locations dispatching ambulances to towns in the study region (Figure 2). Only Plainfield has more than one facility. Plainfield ambulances cover Plainfield and Sterling, where no facilities are located. Like Sterling, two other towns do not have facilities. Pomfret is covered by the Brooklyn facility. Eastford is covered by the ambulance service in Ashford, outside the primary study area. There are 18 ambulances available across the 11 locations.
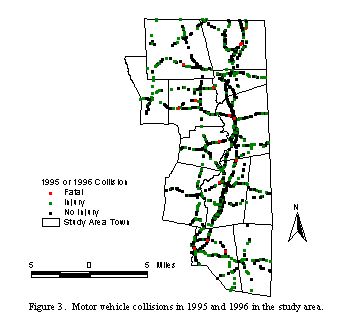
Data on the locations of motor vehicle collisions in the study area were obtained from the Connecticut CODES (Crash Outcome Data Evaluation System) GIS (Cromley, 2001). The Connecticut CODES project was funded by the National Highway Traffic Safety Administration (NHTSA). The purpose was to link motor vehicle crash data and medical outcome data to describe motor vehicle injuries and to develop protection systems. The CODES database includes all collisions occurring in 1995 and 1996 that were reported to police. All collisions on state roads are included. Collisions on local roads are included if the police accident report indicates an injury or fatality. Data for the 2,418 collisions occurring in the study area were extracted from the statewide database (Figure 3). These collisions involved 6,646 people. Of the total number of crashes, more than half (1,311) involved an injury or fatality.
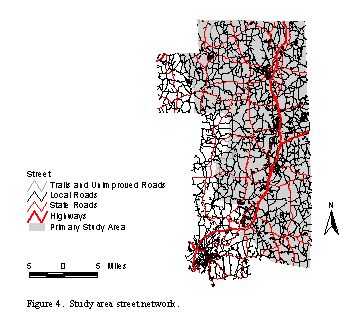
The street network database used for the study was prepared from streets segments in the TIGER/Line files for the region (MAGIC, 1990). These segments were used to create a network for the secondary study area including all of the towns in the primary study area and adjacent towns through which ambulances might have to pass to travel to an accident scene or to a hospital.
The record for each street segment was modified to add a field estimating average ambulance response travel speed. These speeds ranged from 20 to 60 mph depending on the type of segment as identified in the Census Feature Class Code. An additional field was added estimating average travel time in minutes needed to traverse the segment given its length and the estimated average ambulance response travel speed (Figure 4).
Network analysis functions were used to model 10-minute coverage areas around each ambulance facility. A 10-minute response period was used because the Connecticut Department of Public Health recommends 6-8 minutes as the desired time limit for basic ambulance response (Connecticut EMS Advisory Board Planning Committee, 1997). This allows at least 2.0 minutes and up to 4.0 minutes between the time the 911 call is received and the ambulance leaves the facility in response. Assuming that a crew is available at the facility at the time a call is received, the modeled lag time is realistic.
Once the coverage areas were determined, overlay analysis was used to identify towns where more than 15% of collisions were not covered. Candidate facility locations in these towns were identified from fire stations, police departments, town halls, and medical facilities in or near the uncovered areas. Two maximal covering models were developed to determine which candidate sites would maximize coverage of collisions and which candidate sites would maximize coverage of road network segments regardless of whether a collision had actually occurred there (Church and ReVelle, 1974). Both models were solved under varying assumptions about the number of candidate facilities that could be opened given a budget constraint.
The formulation for the models is:
Min Z = S iÎ Iaiyi
(Minimize the number of collisions or road segments not covered by an open facility within the critical response time)
Subject to:
S iÎ Nixj + yi ³ 1 for all i
(An individual collision or road segment must be within the critical service
time of at least 1 open ambulance facility or it is not covered)
S
jÎ
Jxj = P
(Exactly P ambulance facilities must be opened)
xj = (0, 1) for all j
(A candidate ambulance dispatch facility must be either opened or closed)
yi = (0, 1) for all i
(An individual collision or road segment is either covered within the critical service time of an ambulance facility or it is not
Where:
Z is the objective function
I is the set of collisions or road segments and the subscript i is an index denoting a particular collision or road segment
J is the set of candidate ambulance facilities and the subscript j is an index denoting a particular ambulance facility
ai is the number of collisions or road segments at site I
Ni is the set of ambulance facilities where the distance between collision or road segment i and candidate ambulance facility j is less than or equal to the critical time (dij £ s)
s is the critical service response time
xj is 1 if the ambulance facility is opened at site j or 0 if the ambulance facility at j is not opened
yi is 1 if the collision or road segment i is not covered by an open ambulance facility within s and 0 if the segment is covered by an open ambulance facility within s
P is the number of facilities to be opened
RESULTS
The results of the coverage analysis show that, in general, coverage is adequate in the primary study area towns (Figure 5). Assuming that ambulances provide service only in the towns they are designated to serve, 90 percent of all crashes and 88 percent of all crashes involving an injury or fatality could likely be covered within 10 minutes from the existing ambulance facilities. If ambulances could travel outside of their service areas, additional portions of the study region could be covered within 10 minutes, covering almost 95 percent of all crashes and almost 94 percent of all crashes involving an injury or fatality.
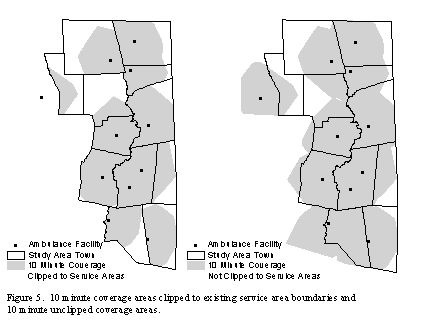
In three towns, however, less than 85% of crashes could likely be covered within 10 minutes, even if service could be provided outside of existing town service areas. Eastford (80% covered) and Pomfret (75% covered) are served by ambulances based in neighboring towns and Woodstock (73% covered) is a large town with an ambulance facility located in the southeastern corner of the town. These towns were the focus of the analysis to evaluate candidate sites for improving ambulance response by location additional facilities.
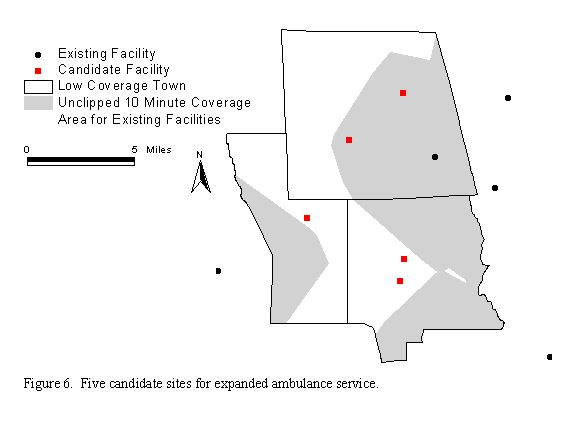
In the three towns, there were 89 collisions that could not be covered and 744 road segments that could not be covered by existing facilities. Five sites were selected as candidates for locating ambulance facilities including one fire station in Eastford, one in Pomfret, two in Woodstock, and Pomfret Town Hall (Figure 6). Each uncovered collision and road segment was evaluated to determine whether it could be covered within the 10-minute response period by each of the five candidate sites. This information formed the data input for the maximal covering problems. Each covering problem was solved five times to reflect a budget adequate to open 1, 2, 3, 4, or all 5 candidate facilities.
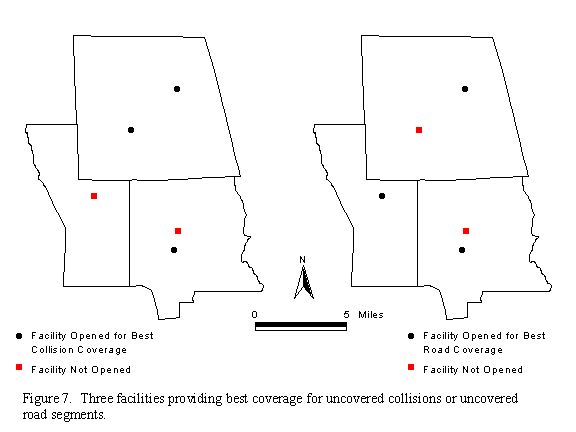
The results of the analysis indicate that different facilities would be open to maximize coverage of collisions versus road segments for a budget of 1, 3, or 4 facilities. At least 3 facilities would have to be opened to cover at least 90 percent of the uncovered collisions or uncovered road segments (Figure 7). But, there would be very little marginal improvement in coverage from opening more than 3 facilities and opening all five facilities would still leave 2 percent of collisions and 4 percent of road segments uncovered.
CONCLUSION
This research models the likely ambulance coverage in the region assuming that an ambulance and crew are available at the time a call comes in. Under these assumptions, the availability of service is fairly high. In only five of the 12 towns, however, is ambulance service covering the town a paid service and in only one of these towns is the service 24 hours. In the remaining towns and times, ambulance service is volunteer. Most ambulances are based at fire stations. Basic ambulance service is only one level of response within the EMS system. The results of this analysis could be used to place first response personnel in areas where coverage within the specified 6-8 minutes for basic ambulance response is probably not attainable based on the locations of existing ambulance facilities.
The results of this research also support the idea that Connecticut would benefit from regional EMS services. More collisions and road segments could be covered within a given response time if ambulance services could be extended across town boundaries.
Significant improvement in coverage could be made in the towns where modeled coverage was lowest by adding 1 to 3 facilities. Given that there are 5 ambulances currently based at 3 sites serving these towns, it might be possible to achieve better coverage by relocating ambulances, perhaps for only part of the day.
GIS and related technologies will continue to play a role in improving the quality of EMS operations for those providers that can afford to implement them. GIS analysis also has a useful role to play in highlighting temporal and spatial constraints on service delivery to identify areas that cannot be served by existing facilities because crews cannot reach those areas within appropriate response times even under the best of conditions. A clear picture of these constraints is essential for EMS evaluation and planning.
ACKNOWLEDGMENTS
The Connecticut CODES project was funded by a grant from the National Highway Traffic Safety Administration to the Connecticut Department of Public Health. The Connecticut Department of Public Health supported the creation of the Connecticut CODES GIS through Memorandum of Agreement Log No. 98-434-1.
REFERENCES
Church, R. and ReVelle, C. 1974. The Maximal Covering Location Problem. Papers of the Regional Science Association 32:101-118.
Connecticut EMS Advisory Board Planning Committee. 1997. Connecticut EMS Plan. Hartford, Connecticut: Office of Emergency Medical Service, Department of Public Health.
Cromley, E. K. 2001. Case Study 2: GIS and Road Accidents in Connecticut. In K.C. Clarke, Getting Started with Geographic Information Systems, Third Edition, (pp. 257-261). Upper Saddle River, New Jersey: Prentice Hall.
Connecticut Department of Public Health. 1999. Injuries – Looking Toward 2000 State Health Assessment. [Online]. Connecticut Department of Public Health. Available: http://www.state.ct.us/dph/Publications/OPPE/sha99/injuries.htm [July 22, 2000].
DonFrancisco, R. J. Personal Interview with Xiaojing Wei. Quinebaug Valley Communications, Inc. September 14, 2000.
Estochen, M. B., Strauss, T., and Souleyrette, R.R. 1998. An Assessment of Emergency Response Vehicle Pre-Deployment Using GIS Identification of High-Accident Density Locations. Transportation Conference Proceedings. Ames, Iowa: Center for Transportation Research and Education, Iowa State University.
Foley, J.M. 1994. Ambulance Dispatch Calls on NT. PC Week 11:29.
MAGIC (Map and Geographic Information Center). 1994. Town Data, 1994 Streets – Census TigerLINE (Line Feature) 1990. [Online]. Map and Geographic Information Center, Homer Babbidge Library, University of Connecticut. Available: http://magic.lib.uconn.edu [August 16, 2000].
Nale, D., Ed. 1995. GIS Combines with Emergency 911 Services. American City & County 110:30.
National Highway Traffic Safety Administration, National Center for Statistics and Analysis. 1997. Traffic Safety Facts. Washington, D.C.: U.S. Department of Transportation.
Reiach, L. 1999. GIS Value Demonstrated During Storm of the Century. Public Works 130:47-49.
U.S. Census Bureau. 2000. Population Estimates for Minor Civil Divisions: Annual Time Series, July 1, 1990 to July 1, 1999. [Online]. Population Estimates Program, Population Division, U. S. Census Bureau, Washington, DC. Available: http://www.census.gov/population/estimates/metro-city/mcdts/MCD99_CT.txt [October 20, 2000].
Ellen K. Cromley
Professor
University of Connecticut
Department of Geography Unit 4148
215 Glenbrook Road
Storrs, CT 06269-4148
Voice: (860) 486-5952
Fax: (860) 486-1348
ecromley@uconn.edu