Title
Modeling historical environmental exposures using GIS:
Implications
for disease surveillance
Authors
Theresa C. Kennedy, Julia G. Brody, Joan N. Gardner.
Abstract
The reconstruction of historical exposures is vital in epidemiological
studies of diseases with long latencies like breast cancer. Biological sampling,
while
important in ongoing surveillance efforts, provides little information relevant
to the etiologic period or timing of exposure. In the
Cape
Cod Breast Cancer and Environment Study we used GIS to assess exposures to mixtures of chemicals
during 1948 – 1990 from sources including wide-area pesticide application
and drinking water impacted by land use. Using data from federal, state, and
local sources, and modified drift models, we calculated relative exposure intensities
for 2100 women at over 4000 addresses. As well as demonstrating the emerging
usefulness of GIS for exposure assessment, this paper will describe some of
the barriers to successfully integrating historical environmental datasets,
and practical solutions developed during the study. The work has implications
for epidemiological studies and other disease surveillance efforts that rely
on existing, often disparate geospatial data.
Introduction
Breast cancer is the most commonly diagnosed non-skin cancer in women. This year over 200,000 women will be diagnosed with invasive breast cancer, and about 40,000 women will die of the disease (1). Risk factors for breast cancer are related to lifetime exposure to estrogen, via early menarche, late menopause, nulliparity, body size, and alcohol consumption. Breast cancer risk has increased steadily since the 1950s to a lifetime risk of 1 in 8 today. Evidence of an environmental influence on breast cancer risk stems from observations in wildlife and in human breast cancer cell lines that certain synthetic chemicals found as pollutants in the environment can mimic estrogen or otherwise disrupt hormones (2). Exposure to these chemicals over a lifetime from aerial pesticide drift, contaminated drinking water or use of certain products in the home may represent a preventable risk for a number of hormonally related health effects, including breast cancer. This paper presents an update to previously published work conducted at Silent Spring Institute using GIS to reconstruct historical environmental exposures to 2100 women in a breast cancer study. In particular it describes new methodologies developed subsequent to publication, with relevance to the appropriate use of disparate geospatial data in health studies and surveillance efforts.
Background
On Cape Cod, Massachusetts, age-adjusted breast cancer incidence was approximately 20% higher in comparison with the rest of the state for the period 1982 through 1994 (3). The Collaborative Breast Cancer Study also reported that incidence was elevated even after statistically controlling for a long list of established and hypothesized risk factors for breast cancer, including family and reproductive history, physical exercise, alcohol, tobacco, and certain aspects of diet (3).
Cape Cod’s long history of pesticide use in support of tourism, cranberry cultivation and other agriculture is also quite distinctive (4). Forests were repeatedly sprayed for gypsy moth and other tree pests, and wetlands were sprayed for mosquito control. Other wide area uses include applications to manage golf courses and rights of way. The Cape’s sandy soils allow pollutants from particular land uses or septic systems to travel quickly to groundwater, which is the sole drinking water source and Cape Cod residences have been developed in or adjacent to pesticide use areas or on land where pesticides were previously applied. Persistent organochlorine chemicals including DDT and dieldrin were widely used on the Cape from the late 1940s to the mid 1970s, and less persistent compounds including carbaryl, malathion, and carbamates have been applied in more recent years (4).
The Cape Cod Breast Cancer and Environment Study (Cape Cod Study) was initiated in 1994 to study the excess incidence on Cape Cod. A collaborative effort between Silent Spring Institute, several academic institutions and local advocacy groups, the study has been recognized as a national model for including public participation in research (5). The Cape Cod study involves 2100 women who lived on Cape Cod between 1988 and 1995. Women diagnosed with breast cancer during those years were compared with women of similar age who had not been diagnosed. Interviewers collected information on where the women had lived on Cape Cod and on established risk factors for breast cancer, including family history of breast cancer, menstrual and reproductive history, height and weight, and education, an indicator of socioeconomic status. Interviews also included topics of interest in recent studies as possible breast cancer risk factors: alcohol and tobacco use, physical activity, and pharmaceutical hormone use. Other questions assessed use of home pesticides, tap water, and certain consumer products.
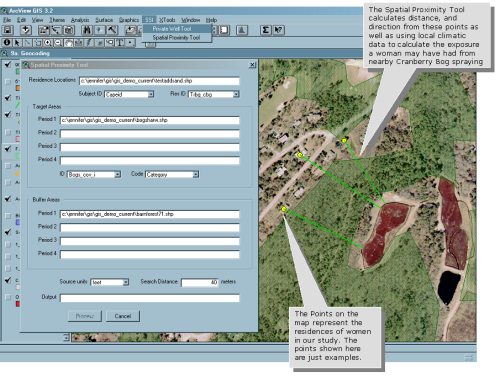
A Spatial Proximity Tool was developed as an extension to ArcView in order to relate the women’s residential address history with the historical environmental data like pesticide spraying areas (Figures 1 and 2).
|
| Figure 1: The Spatial Proximity Tool |
The tool is based on modeling of spray drift and deposition, and takes into account the distance of a residence from the pesticide use area, the size of the area, and the wind direction typical during the early morning hours in spring when pesticides were applied. The goal was to reconstruct spatial, temporal, and intensity or “dose” information. Given the expected limitations of historical records, the focus was on assessing relative intensity – i.e., on correctly ranking higher and lower exposures and differentiating exposed from unexposed residences.
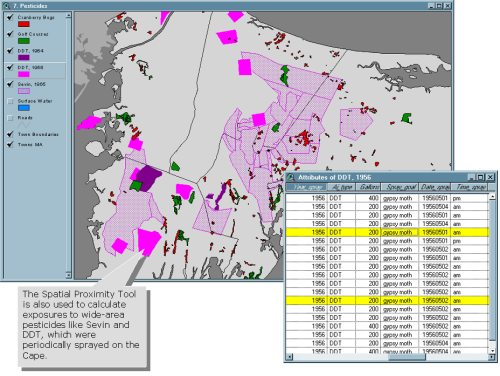 |
| Figure 2: Wide Area Pesticide Applications |
A woman’s total exposure score for each source, or group of like-sources (e.g. all aerially sprayed pesticides) was calculated by adding together all appropriate exposures for each year at each address over the period of residential history. Cumulative exposure to residual pesticides, stemming from the previous application of persistent chemicals to residential areas or adjacent land was also calculated. Results of the analysis comparing aggregated exposure scores with breast cancer risk are in preparation.
Data Quality and the Geocoding Process
One of the significant challenges in the study was the geocoding of residential history data gathered at interview. Early automated methods of geocoding women in our study involved using town parcel maps to place them in the center of the land parcel corresponding to their street address. The parcel maps however, like many publicly available datasets, had been created independently by each town on the Cape, using different source data, and at varying resolution and scale. The net result is that while the parcel maps are useful basemaps for each individual town, they do not represent a uniform basemap across the Cape, and are subject to local variation in accuracy and completeness. The environmental datasets, originating from uniform state-, or nationwide basemap data, did not therefore ‘fit’ with the parcel maps in some areas, introducing the possibility of underestimating (or overestimating) a woman’s exposure to a particular source.
In order to overcome the limitations of the parcel maps, we used high resolution aerial photographs to move the women directly onto their house rooftops, using a process of on-screen editing and digitization. The aerial photographs, available from MassGIS (6), constitute the state basemap for Massachusetts, and represent a consistent cape-wide reference. This process, undertaken by Institute researchers and Applied Geographics Inc. (AGI), maximizes the quality of the residential history data, and has the additional benefit of reducing error associated with the significant number of large parcels found on the Cape, in which the center of a parcel may be some distance away from the actual residence.
Incomplete Residential Address Data
We conducted additional analyses to assess and minimize the effect of missing data. Cape addresses that were not geocoded as “certain” matches are one source of missing exposure scores. As might be expected, earlier addresses are more likely to be missing, a pattern that is problematic because they represent exposures to certain compounds, particularly persistent organochlorines, during years relevant to a disease with long latency. To mitigate this problem, we developed a method for imputing pesticide exposures at addresses that were geocoded to the middle of a street or not geocoded. To impute pesticide exposure scores when the street name was known, but the house number was missing or did not correspond to available numbers on that street, we identified all residential parcels on that street using the land use map for the appropriate years (Figure 3), calculated relative exposure intensity for all residential parcels, and assigned the mean of those scores.
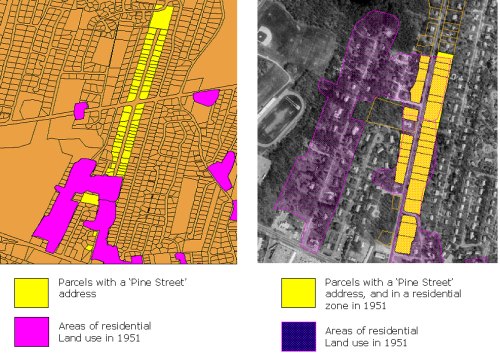 |
| Figure 3: Imputing exposures for 'uncertain' locations |
This methodology was only applied to streets below a set threshold length. A method similar to this one was previously used by Weinberg et al (7) to impute exposures for missing addresses in a study of radon. Further analysis to refine this technique is planned and a more detailed manuscript is in preparation.
Conclusions
Limitations due to disparate datasets and missing exposure information, as discussed in this paper, are unfortunately typical in retrospective environmental health studies (4), and remain a serious barrier to meaningful research. Nevertheless, the GIS methods applied here hold promise for getting the maximum benefit from existing data, while simultaneously identifying data gaps and setting priorities for future data needs. The development of methodologies which can creatively, yet judiciously address underlying gaps in data will become increasingly important as we design and develop integrated health surveillance systems. In the long term, standardized data collection, consistency across geographical boundaries, and time-series monitoring, are critical to the success of initiatives such as Health Track (8), in which the integration of many kinds of health and environmental data offer hope for studying the long-term effects of the environment on health. GIS has the potential to address research questions about exposures with long latency to disease and exposures during critical periods in the life cycle, both areas of priority in understanding breast cancer.
For more information please visit Silent Spring Institute and the Cape Cod Breast Cancer and the Environment Atlas.
Acknowledgments
This work was supported by an appropriation of the Massachusetts legislature administered by the Massachusetts Department of Public Health. Additional support came from the Kohlberg Foundation and the Community Foundation of Cape Cod.
References
1. American Cancer Society (2003). Cancer Facts & Figures
2003. Atlanta, GA, American Cancer Society, Inc.: 4.
2. Rudel, R. A., P. Geno, S. J. Melly, G. Sun and J. G. Brody (1998). Identification
of alkylphenols and other estrogenic phenolic compounds in wastewater, septage,
and groundwater on Cape Cod, Massachusetts. Environmental Science and Technology
32(7): 861-869.
3. Silent Spring Institute, 1997. Cape Cod Breast Cancer and Environment Study:
Final report, December 8, 1997, Newton, MA.
4. Brody, J.G.; Vorhees, D.J.; Melly, S.J.; Swedis, S.R.; Drivas, P.J.; Rudel,
R.A. 2002. Using GIS and historical records to reconstruct residential exposure
to large-scale pesticide application. Journal of Exposure Analysis and Environmental
Epidemiology, 12: 64-80.
5. McCormick, S.; Brody, J.G.; Brown, P.; Polk, R. In Press. Public involvement
in breast cancer research: An analysis and model for future research. International
Journal of Health Sciences.
6. MassGIS. Massachusetts Geographic Information System. Boston, MA: MassGIS,
Executive Office of Environmental Affairs. accessed on January 31, 2003 [accessed
at: http://www.state.ma.us/mgis/massgis.htm].
7. Weinberg, C. R., Erik S. Moledor, David M. Umbach and Dale P. Sandler (1996).
Imputation for exposure histories with gaps, under an excess relative risk
model. Epidemiology 7(5): 490-497.
8. Trust for America's Health. Trust for America's Health Reports. Washington,
DC. Available at: http://healthyamericans.org/resources/reports/; accessed
February 2003..
Author Information:
| Theresa Kennedy, Staff Scientist/GIS Specialist, Silent Spring Institute, 29 Crafts St., Newton, MA, 02458. Tel (617) 332 4288 x13, Fax (617) 332 4284, kennedy@silentspring.org |
| Julia G. Brody, Executive Director, Silent Spring Institute, 29 Crafts St., Newton, MA, 02458. Tel (617) 332 4288 x23, Fax (617) 332 4284, brody@silentspring.org |
|
Joan Gardner, Chairman, Applied Geographics Inc., 355 Congress St., Suite 300A, Boston, MA 02210, Tel (617) 292-7125, Fax (617) 292-7911, jng@appgeo.com |
16th May 2003.