SOFTWARE PACKAGE FOR MODELING AEROSPACE MONITORING
AND ENVIRONMENTAL CONTROL ("GEODIALOG")
L.A.Vedeshin, Russian Academy of Sciences (RAS),
B.M.Balter, V.V.Egorov, Space Research Institute, RAS,
A.I.Kanaschenkov, Stock Company " Corporation Phasotron - NIIR"
Introduction.
Environmental problems recently have been acquiring an acute character and become a major concern for the world community. Monitoring the environment with an adequate timeliness and spatial range is possible only with the aerospace remote sensing systems. They have reached a satisfactory level of development. However, their informational potential is not used effectively. There are several reasons for that.
First, their output information does not match well the practical problems of environmental control. Therefore, it loses a large part of its value - speaking thermodynamically, it simply dissipates. There is also a reverse side to this problem: the aerospace monitoring systems are not instructed to take into account the effects of environmental control based on their information, and so lack the major feedback channel for optimizing the information collected. Consequently, the monitoring devices and the domains of practical applications of their data are functionally disjoint and do not form a complete monitoring - control feedback system.Second, in the process of remote sensor development usually no modeling of the virtual practical application of their data is done. Therefore, the parameters of sensors - radars, radiometers, scanners, cameras - are selected, to a large degree, on the basis of a subjective judgment. Therefore, the information obtained from such sensors, has some unnecessary built-in limitations, which no subsequent experience can alleviate.
Optimizing the aerospace remote sensing systems and using their data more effectively for environmental control calls for new methods of information design and analysis. This was the reason for developing the software package 'Geodialog'.
The main idea of GEODIALOG.
Ecosystem's evolution in time, remote monitoring, target control of the environmental state, model building and fitting… All these issues may well be separate in theory, but they are inextricably knotted in almost any practical problem. It seemed promising to embed into a single package the knowledge of mathematical ecologists, specialists in optimal control, remote sensing people, builders of complex models, data processers and some programming art. You may use this knowledge base even if yours is one of these fields at most. Since all this is wired into the program's structure. It's mostly behind the screen and only the simple-to-use levers are displayed for your control.
The payoff we expect is not so much solving all above-mentioned problems, as opening new vistas for the user. The one we emphatically recommend arises from locking monitoring and control into a sort of feedback (see fig. 1). Both obey the optimality theories: one for driving the ecosystem's state to a preset target, another for filtering the monitored signal. Both deal with information and their optimality criteria may be formulated through information-related entropy. Control is based on the information provided by monitoring; conversely, by using clever control, new features are opened for monitoring. So they form a consistent information cycle. Can't we use the capabilities of each to enhance another's effectiveness? It is then, natural to use the full information cycle entropy instead of two partial entropies as the criterion to be optimized. Then, we are no longer free to drive the system to our target by any means. It's possible only if the system's entropy-measured complexity is not damped, since this would decrease the quality value. The criterion adapts our controlling efforts to the natural homeostasis of the system. It's no longer obvious, who controls whom and who observes whom: both do both things, as in a dialogue. Hence the name of GEODIALOG.
Another possibility is opened by creating the dynamical monitoring scenarios, which adapt to the ecosystem change in such a way as to optimize information entropy. This opens the way, say, to designing the adaptive space-based sensors. GEODIALOG should handle this combined optimization problem in the same way it handles monitoring and dynamics separately. Such "mixed scenarios" may be used also for fitting the models in situations, when both the ecosystem state drifts and the monitoring conditions change. These are realistic situations. Then, as in the preceding case, the optimality criterion should simply be made dependent on parameters describing both the ecosystem state and the monitoring conditions.
We hope that GEODIALOG will make practical the synthetic simulated experiments which heretofore have been prohibitively clumsy.
GEODIALOG functions.
GEODIALOG is a multipurpose modular program package designed for simulating the dynamics of ecosystem and other complex image-like structures or vectors, the process of monitoring them by remote sensing, the user-defined or automatic control of parameters characterizing both the dynamics and monitoring. It does the following:
Package organization and what is on the screen.
GEODIALOG has 4 main program blocks (see fig. 2). Each outputs an image, which corresponds to one of the bold rectangles in fig. 1:Each block can be opened, and then one can define the respective parameters and check their influence on the 'transfer function' of this block, without involving other blocks. Thus, to set up the ecosystem evolution scenario, one doesn't need the monitoring block or the control block.
In this separate compartment regime, one can load from the database a ready-to-use definition of a ecosystem, a sensor, a state-to-spectrum function, or a control schedule. In the same way, new definitions are saved. After that, any block brings its updated content to a common forum provided for their interaction - the information cycle screen. There, each block is represented by a 128x128 pixel picture window in one of four corners of the screen (see fig. 2).
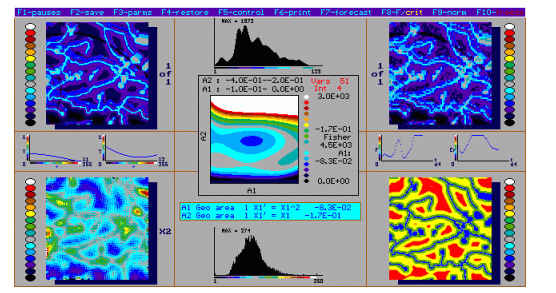
Figure2 The main screen of GEODIALOG showing the monitoring-control cycle. See description in text.
The ecosystem state image (below left) shows color-coded values of a state variable: black-violet for small, red-white for large values. There is a separate image for X1 variable and for X2 variable. X1 and X2 interact in dynamical equations. One can have several objects on these images, so that X1 and X2 have a different meaning for each object. The histograms for X1 and X2 are shown below. They are used in control algorithms.
The reflectance image window (above left) shows how the ecosystem looks in a narrow spectral channel and under a unit-intensity white illumination. The shades of gray it would have are color-coded just like the ecosystem state values. Usually several spectral channels for a sensor will be defined, and they are modeled in turn. Reflectance map values are computed from state map values transformed by the state-to-spectrum function (left, middle). The latter is specified beforehand. It is different for different objects.The sensor block takes the reflectance map, adds the illumination conditions, then pushes the signal through radiation detector and other intricacies of sensor model. 5 sensor types are available: multispectral scanner, spectrometer, SLAR, SAR, microwave and IR-radiometer. The resulting image is shown above right. It's what one can see in the respective spectral channel of a scanner, in a radar signal printout etc. The probability histograms of the output signal in each channel are shown above, middle. They are used in filtering algorithms. The filtering produces estimates of actual ecosystem state, based on the sensor output. The estimated state maps are shown overlapping the same image.
The filtering-control block takes on this output. It produces the estimates of the future ecosystem state map, and computes the optimal control to drive the ecosystem to the specified target state map (shown below right). Depending on the mode chosen, this image shows the estimated/forecasted state map, the target state map or the control map (that's, where on the map what amount of control is applied). The block computes two kinds of quality criteria: deviation of the state map from the target map (or of the sensor output from the 'ideal' output, if so chosen) and the value of Fisher information contained in the sensor output w.r.t. the mean values of state variables for each object. The contributions of each variable and each object to the overall criterion are taken with the weights specified by the user.
This closes the cycle and a pause is made when the user can change control strategy settings. After that, the ecosystem block takes the new values of controls and the cycle runs the next step. The history of criteria values obtained on each step is displayed (right, middle), to show the overall slant.
In the pause, the user has access to the runtime menu displayed in the upper row. It presents several technical opportunities, such as saving/restoring the results, changing normalizers which define the color code table etc. But only two are important ideologically: setting/changing the controlled parameters and the optimality criteria.
Several parameters of each of the four main blocks (or several dozens, depending on the number of objects and channels) are open to be selected as optimizable controls. One may have only two controls at each iteration of the cycle, because it is impractical to optimize more at once. Controls can be manipulated by the user or optimized automatically. The remaining parameters not set as controls may be simply changed manually. E.g., to optimize the relative positions of spectral channels, one may choose the centers of two of them as controls, but simultaneously set their widths by hand. Or one may assign two coefficients of the ecosystem dynamic differential equations as two controls and change the remaining coefficients by hand.
The optimization unit is, functionally, the fifth main block. It has its own window displayed on request in the center of the screen. However, algorithmically, it is a part of the filtering/control block, since it performs in the interactive mode what the latter block is meant to do automatically. The central window displays the values of Fisher information or of the deviation-from-target as color-coded optimization criteria against two controls. The window displays criteria values obtained from all cycle iterations since the last control assignment was made. One can choose manually the next point (i.e. the controls value), so that the criterion shown is expected to improve. The unit interpolates between the criterion values for all points or for a subset of them and suggests the promising control values as red and white regions
GEODIALOG applied.
There are several promising domains for using GEODIALOG.
In Remote sensing, GEODIALOG is a way to test the existing and find the new designs of remote sensors, information processing procedures, observation schedules etc. It does so with a hard and computable criterion: the problem-related information flow or control capability or both. It is a computer-assisted facility for sensor structure design and space systems parameter choice.
In Fundamental science, GEODIALOG is for:In Resource management, GEODIALOG is an instrument of expertise for large scale projects with ecological impact. It implies a new kind of (simulated) interaction with ecosystems. It admits only the monitoring-based actions, which don't decrease the overall information flow criterion. This provide a feedback channel for ecosystem to prevent any homeostasis-breaking action. Thus, a model resource management scenario found within these constraints, may be applied in practice with a reasonable chance that it wouldn't irreversibly damage the ecosystem. In Education, GEODIALOG is a demonstration and experimenting package for students in mathematical ecology, remote sensing, optimal control. It provides an extensive visualization and lets the user change almost any parameter with the immediate display of its extrapolated influence on quality criteria.