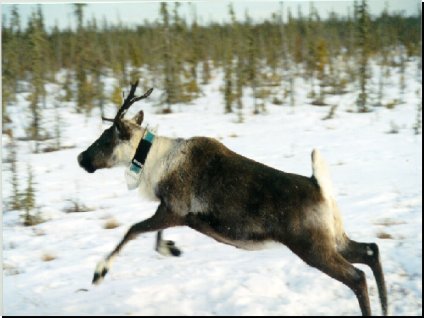
Woodland caribou (Rangifer tarandus caribou) are considered endangered in Alberta, Canada. Rapid expansion of oil and gas development in northeastern Alberta has raised concerns about the effects of industrial development on the movement and distribution of caribou. In 1998, a total of 36 caribou were outfitted with programmable GPS collars that collected data for a one-year study. 43,415 locations were used to categorize the locations of the animals with respect to well sites, roads, and seismic lines. Results indicated that functional habitat loss through avoidance was significant. In addition, a modeling exercise was undertaken to discover whether or not the caribou were crossing roads and seismic lines at the same frequency as randomly distributed linear features. Roads appeared to be a significant barrier to caribou movements, and seismic lines were not barriers. This study presents hard data that can be used as a mitigation strategy in light of provincial guidelines for oil and gas activity on caribou range.
The Committee on the Status of Endangered Wildlife in Canada (COSEWIC), recently had the Woodland Caribou placed on the "threatened" list (COSEWIC 2000). This new designation will most likely increase the visibility and awareness, at a national scale, of the various pressures the Woodland Caribou are being subjected to. In the province of Alberta, Woodland Caribou have been considered endangered since 1994 (General Wildlife Regulation 1994).
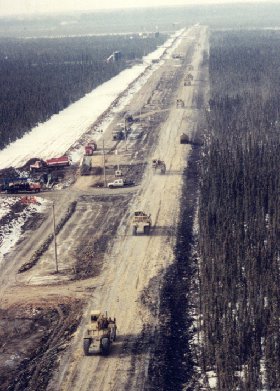
Woodland Caribou distribution and numbers have declined since the turn of this century along the southern fringe of their range in Alberta where human encroachment has been greatest (Alberta Environment 1999). In recent years, the rapid expansion of industrial activity such as forestry, oil and gas exploration and development and agricultural expansion has infringed on the traditional caribou range in Alberta. The cumulative human impact of these industrial activities as well as the recreational activities associated with access into the caribou range are believed to be causing strain on the Woodland Caribou population.
The Woodland Caribou (Boreal Ecotype) is a relatively sedentary mammal when compared to the Barren Ground Caribou (Rangifer tarandus groenlandicus) which migrates hundreds of kilometres annually. Studies which analyze the effects of petroleum development on the Barren Ground Caribou are plentiful (e.g., Horejsi 1981; Fancy 1983; Smith and Cameron 1983; Curatolo and Murphy 1986; Murphy and Curatolo 1987; Cameron et al. 1992; Nelleman and Cameron 1996). Studies of the effects of petroleum development on Woodland Caribou were not as plentiful, studies related to the petroleum industry infrastructure were absent in the literature.
Geographic Information System (GIS) and Global Positioning System (GPS) technologies were identified as tools which could be used to empirically study the effects of oil and gas exploration and development on Woodland Caribou. Simple analytic techniques were identified as being the methods of choice to study the problem and justify solutions. A coordinated effort between industry, academia and government is being utilized to study the effects of human resource development on the Woodland Caribou. This paper presents some of the preliminary results from the Wabasca area.
On July 12, 1991 the Alberta Department of Energy released Information Letter 91-17: A Procedural Guide for Oil and Gas Activity on Caribou Range (IL 91-17). This policy document stated that "Petroleum and natural gas exploration and development activities can occur on caribou range, provided the integrity of the habitat is maintained to support its use by caribou." (Alberta Resource Development 1991)
IL 91-17 also outlined the establishment of standing committees consisting of companies involved in oil and gas operations in the caribou zones. The purpose of these committees was "to foster cooperation, to share information and advice on the level of protection required for the caribou, and to develop area-specific mitigation plans." IL 91-17 also included an option to involve representatives with broader industry interests. The forest industry took interest in participation as some of the caribou zones were adjacent to or overlapped areas of harvestable timber.
A summary of many of the initiatives underway and those which have been completed can be found at the Boreal Caribou Research Program's website at http://www.deer.rr.ualberta.ca/caribou/BCRP.htm
 The Wabasca Area, like many regions of Alberta, has had oil and gas activity for years.
New technology for oil extraction has opened up many areas to increased industrial activity
and this trend will continue into the future (Marr-Laing and MacCrimmon 2000). The Wabasca
area was identified as an area which would be subjected to increased activity.
In February of 1998, 23 Woodland Caribou were captured via net gun and fitted with GPS
collars (Lotek Engineering Systems, Newmarket, Ontario). A data collection program
followed in which a variety of suppliers were used to obtain the most current infrastructure
data available. In January of 1999, the caribou were recaptured for collar battery replacement.
The Wabasca Area, like many regions of Alberta, has had oil and gas activity for years.
New technology for oil extraction has opened up many areas to increased industrial activity
and this trend will continue into the future (Marr-Laing and MacCrimmon 2000). The Wabasca
area was identified as an area which would be subjected to increased activity.
In February of 1998, 23 Woodland Caribou were captured via net gun and fitted with GPS
collars (Lotek Engineering Systems, Newmarket, Ontario). A data collection program
followed in which a variety of suppliers were used to obtain the most current infrastructure
data available. In January of 1999, the caribou were recaptured for collar battery replacement.

After 12 months of caribou location data collection, 2 preliminary studies were conducted. One employed a compositional analysis which analyzed caribou locations in disturbance buffers around anthropogenic disturbance (roads, seismic lines and well sites). The second study utilized a spatial modeling exercise to examine whether or not the caribou were crossing linear disturbances as much as would be expected.
A key component to conducting analysis is understanding the data which are being used. The importance of this component, especially with geographic analysis, has often been overlooked or simply misunderstood. Historically, a researcher would outline his/her spatial requirements for a project and assume that the scale, consistency and accuracy of the data provided by industry or government agency, would meet the projects' requirements. This type of scenario has played itself out many times. It is no fault of the researcher, but more a product of a new technology being used, without a developed support structure in industry, academia and government in place to ensure integrity and accuracy.
One standard set of well sites, seismic lines and roads would have been ideal for this study. Government approval of industrial activity would lead one to believe that the necessary data sets would be obtainable through a government directed agency. While the data required for this project was readily available in one form or another, the geometric accuracy, scale and currency of the government data did not meet the projects requirements.
The datasets acquired from industry required significant processing to make them a feasible option for this project. The petroleum exploration industry in Alberta uses Computer Aided Design (CAD) based software for much of their inventory and exploration programs. As such, metadata and data dictionary are terms with little meaning for many involved in the collection of spatially enabled data.

 We utilized the services of a contractor to analyze and project all of the infrastructure
data.
They provided back to us the most accurate and current data for seismic exploration
lines, roads and well sites. However, the data still did not meet the requirements of the
project. Access for petroleum development is largely governed by season, as much of the
Wabasca area is only accessible on frozen ground. There is a fuzzy area of interpretation
of road data. Seismic lines cut for exploration, often have a lease of occupation taken out
on them. This allows the lease holder to utilize the seismic line for access. A seismic
line which has a lease of occupation, does not guarantee that it is used for road access.
Many of these lines are only accessible during the winter while others are used to restrict
access to other companies and protect current or future interests of the lease holder.
We utilized the services of a contractor to analyze and project all of the infrastructure
data.
They provided back to us the most accurate and current data for seismic exploration
lines, roads and well sites. However, the data still did not meet the requirements of the
project. Access for petroleum development is largely governed by season, as much of the
Wabasca area is only accessible on frozen ground. There is a fuzzy area of interpretation
of road data. Seismic lines cut for exploration, often have a lease of occupation taken out
on them. This allows the lease holder to utilize the seismic line for access. A seismic
line which has a lease of occupation, does not guarantee that it is used for road access.
Many of these lines are only accessible during the winter while others are used to restrict
access to other companies and protect current or future interests of the lease holder.
We decided to collect our own data for roads. This was accomplished by strapping a GPS unit on the roof of a truck and heading out on a road trip. A road was classified as being an "all season road" if it was drivable with a four wheel drive truck during the summer. In all, 286 kilometers of road were recorded in the study area. There was 7,167 kilometres of seismic exploration lines.


 To supplement our analysis we used a classified Landsat image for a vegetation coverage,
higher resolution vegetation data was not available at the time of the study. The classified
imagery was created by Terrain Resources Ltd (formally from Lethbridge,Alberta) from imagery
taken in June/July 1992.
To supplement our analysis we used a classified Landsat image for a vegetation coverage,
higher resolution vegetation data was not available at the time of the study. The classified
imagery was created by Terrain Resources Ltd (formally from Lethbridge,Alberta) from imagery
taken in June/July 1992.
The total study area encompassed 6,172 km2 of terrain. The area is largely dominated by lowland areas of Black Spruce and Tamarack, Fens and Bogs. The fringes of the study area include some upland areas of Trembling Aspen, White Spruce and Jack Pine.
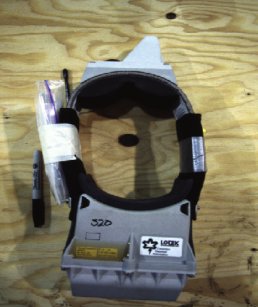 The GPS collars report temperature, activity level and location information on a programmable
fix interval. The information for all fix attempts are stored in the collar until the modem
is contacted and the information is downloaded. This was done on a bi-monthly basis via
fixed wing aircraft.
The GPS collars report temperature, activity level and location information on a programmable
fix interval. The information for all fix attempts are stored in the collar until the modem
is contacted and the information is downloaded. This was done on a bi-monthly basis via
fixed wing aircraft.
Once the collar information was downloaded, it was differentially corrected with N3Win Version 2.4 (Lotek Engineering) against the Alberta-Pacific Forest Industries base station (54 55" 17.60387 N, 112 51" 44.99926 W). The correction process was necessary to compensate for selective availability. As such, the correction process resulted in the data becoming accurate to +/- 4-5 meters. Subsequently, the data was transformed into an Arc Info point coverage and projected into UTM 12 NAD 27.
The collars recorded the location of each of the Caribou at 2 hour intervals. The quality of the data is far superior to traditional VHF telemetry data. Traditional methods typically recorded locations accurate to 100 meters during daylight hours on good flying days. Additionally, the frequent fix intervals are valuable in that the trajectory or movement of Caribou can be presented with far more accuracy than with traditional telemetry data.
| Time Period | Dates | Caribou Available |
| Late Winter | 22 February 1998 � 30 April 1998 | 23 |
| Calving | 1 May 1998 � 30 June 1998 | 19 |
| Summer | 1 July 1998 � 15 September 1998 | 11 |
| Rut | 16 September 1998 � 15 November 1998 | 10 |
| Early Winter | 16 November 1998 � 21 February 1999 | 17 |
The sample sizes vary as a function of mortality, collar malfunction and proximity to the study area. The time periods were selected to reflect periods of biological importance to Woodland Caribou. The selected periods closely resemble those reported in Bergerud 1975.
The flat terrain allowed us to use minimum convex hull polygons (Mohr 1947) for the home range generation for each caribou in each time period. Convex.aml (anonymous script) was modified and used for batch processing.

Buffer coverages were generated at 100, 250, 500, 1000, 2000 and 3000 meters for each
of the disturbance data sets (wells, seismic lines and roads). The disturbance buffers
were clipped to each home range, the number of animal locations which fell into each
buffer , for each time period were counted and tabulated.
To account for the possibility that roads were concentrated in open areas, separate analyses were conducted for open coniferous wetland and closed coniferous wetland (the dominant cover types in the area). This would reduce the possibility of biasing the results due to the confounding effects of habitat association as it was possible that roads could have been built in more open areas to reduce the costs of construction.
Trajectories of the caribou movement were compiled as a line coverage for each study period in each home range. The number of crossing events with roads and seismic lines were recorded.
A random line coverage was generated by connecting 100 pairs of points within the extents of each home range. These lines were then clipped to the home range. Lines in the random coverage were randomly reselected until the length of lines was within 10% of the actual length of roads or seismic lines in each home range. The caribou trajectory was then overlayed and the number of crosses was recorded. This method was repeated 100 times for each home range to provide a control for how many times a caribou would cross a random road network.


This approach to modeling of animal movement differs from other methods which have been reported in Schippers et al. (1996). Three main types of animal movement models; distance based, diffusion, and random walk models; were described. A further review of random walk and distance based models can be found in Johnson et al. (1992). Our approach differs from these methods as we model the feature of interest against the actual trajectory of the caribou.
Statistical Analysis and Results
Normality of the data was tested using Kolmogorov-Smirnov tests.
Log ratio analysis of compositions (Aebischer et al. 1993) were used to analyze the selection of buffers by the caribou. In essence, this method compares the caribou locations in proportion to the availability of habitat. The availability of habitat is represented by the area of disturbance buffers. Summaries of results are presented to show significantly less use than the outer buffer (p < .05) (Aebischer et al. 1993). All processing of the resultant data was done in Microsoft Excel spreadsheets.
Table shows the avoidance effects after analysis. N/S = not significant.
| Time Period | open roads | closed roads | new wells | old wells | seismic |
| Late Winter | 250m | 250m | 250m | 500m | 250m |
| Calving | 250m | N/S | 1000m | 500m | 100m |
| Summer | 250m | 100m | N/S | 250m | 100m |
| Rut | 250m | N/S | 250 | N/S | 100m |
| Early Winter | 250m | N/S | 250 | N/S | 100m |
Paired Sample T-tests were used to compare the mean of the randomly generated crossings to the actual number of crossings. SPSS (Version 6.1 SPSS Inc., Chicago, IL) was used to analyse the crossing results.
Table shows a summary of the percentage of expected crossings. 100% would be expected.
| Time Period | roads | sample size | seismic | sample size |
| Late Winter | 18% | 8 | 100% | 23 |
| Calving | 34% | 6 | 101% | 16 |
| Summer | 33% | 6 | 106% | 11 |
| Rut | 29% | 5 | 118% | 9 |
| Early Winter | N/S | N/S | 101% | 17 |
Discussion
The compositional analysis revealed that caribou displayed avoidance of disturbance features for each of the time periods. The degree or distance of avoidance from the different disturbance features varied. The varying degrees of avoidance appear to mirror the level of activity for different times of the year. Oil and Gas exploration and extraction activities are most intense when the ground is frozen.
Traffic classifiers were used to obtain data on frequency of road usage. Use of automated techniques proved to be difficult as road surface graders frequently severed the recording loops. Battery reliability during the cold winter months confounded the problems. Human surveys proved to be the most efficient way to catalogue road usage.
During the late winter time period, 600-800 vehicles per day were recoded on selected roads in the study area. While during the summer time period, less than 100 vehicles per day were recorded. Traffic was not classified for the remaining time periods, but it is believed that the frequency of usage would rest somewhere between the recoded high and low levels as a result of the reduction in industrial activity during the summer months .
The caribou data showed avoidance for each type of disturbance and the most avoidance for the late winter time period. It is important to note that the avoidance trends are most likely related to use of the disturbance features by humans rather than the mere presence of the disturbance features.
The crossing analysis results showed that roads are not crossed as much as would be expected. Therefore, it would appear that roads in the study area appear to be a permeable barrier to caribou movement. It is interesting to note that the caribou crossed roads the least during the late winter time period, when the level of industrial use is highest.
It should also be noted that the sample sizes for road crossings were small. Many of the collared caribou did not have roads in their home ranges. Thus, the results could be viewed as conservative.
Results showed that seismic lines were crossed at least as often as would be expected. This could be reflective of seismic lines being ubiquitous features across the study area. It could also be an indication that seismic lines are used infrequently and do not act as barriers to the movement of caribou.
Conclusion
The paper has shown that advanced technologies, such as GPS and GIS, can be used to quantify industrial effects on an endangered species. However, it has also been shown that application of GIS/GPS need not be impeded by complicated scientific and technological methodologies to reveal solid evidence of avoidance and barriers.
Simple analytic techniques such as counting caribou locations in anthropogenic buffers and overlaying movement trajectories on randomly generated lines can be used to come to concrete conclusions. Synergies realized by approaching this study from a multi-disciplinary perspective aided in its timely completion and the integrity of results.
All modeling exercises employ some level of assumption building. GIS modeling is a very powerful tool which, as a result of advances in technology, will become more common place in the future. Understanding the input data sets is a crucial step to providing results with integrity. Assumptions of the input data must not only be recognized and understood, but they must be accounted for to avoid tainting of modeling results. In this study, we recognized the assumptions of our data sets and corrected for them. Accuracy, consistency, scale and currency of data is of extreme importance, the quality of data is an issue which must be stressed in any GIS modeling exercise.
The cumulative effect of the disturbance buffers must be acknowledged. From this study, it would be easy to conclude that caribou may be avoiding disturbances associated from oil and gas development. The power of GIS allows us to view these disturbances and the modeling results in a cumulative fashion.
A merged coverage of all disturbance buffers which showed significant avoidance for the Late Winter period reveals that 48% of the study area was avoided. If the adage "habitat avoided is habitat lost", it is clearly evident that current practices in the Wabasca study area should be evaluated and mitigated in the spirit of the government guidelines outlined in IL 91-17.
Adaptive management approach should be looked at as a strategy to deal with the apparent caribou avoidance of the petroleum infrastructure. A balance between resource extraction and caribou habitat conservation should be sought in light of the findings of this study. Cumulative effects of other activities in or adjacent to the caribou range should also be addressed. These include forestry operations, human settlement and natural processes such as wild fire.
Individuals
Tony Gaboury, Stephanie Kurulok, Mike Krupa, Karla Magnusson, Jennifer Zatorski
University of Alberta
Dr. Stan Boutin, Dr. Colleen Cassady St. Clair, Dr. Fiona Schmiegelow
Agencies
Commonwealth Scholarship Program,
Alberta Energy - Minerals Division,
Alberta Environmental Protection,
Department of National Defence,
Alberta Conservation Association,
World Wildlife Fund Canada
Companies
Alberta Energy Company,
Alberta-Pacific Forest Industries,
Anderson Exploration,
Amber Energy,
Bearspaw Petroleum Ltd.,
BP-AMOCO,
Canadian Hunter Exploration,
Canadian Natural Resources,
Chevron Canada Resources,
Coparex Canada Ltd.,
Corker Resources Inc.,
Crestar,
CS Resources/Pan Canadian,
Daishowa-Marubeni International,
Gulf Canada Resources,
Husky Oil Operations Ltd.,
Lakeland Peat Moss Ltd.Manning Diversified Forest Products,
Marathon Camp,
Millar Western,
NorAlta Camp,
Northstar Energy,
Paramount Resources,
PetroCanada,
Pinnacle Resources,
Rio Alto Exploration,
Shell Canada,
Suncor,
Superman Resources Inc.,
Talisman Energy,
TransCanada Pipeline Inc.,
Wascana Energy Inc.
Photograph Credit
Seismic Line Photo courtesy of Evergreen/Lorrnel Land Use Consultants, Calgary, Alberta
References
(URL's current as of June 2, 2000)
Aebischer, N.J., Robertson, P.A., and Kenward, R.E. 1993. Compositional analysis of habitat use from animal radio-tracking data. Ecology. 74:1313-1325.
Alberta Environment. 1999. Alberta's Threatened Wildlife. URL:http://www.gov.ab.ca/env/fw/threatsp/
Alberta Resource Development. 1991. Information Letter 91-17. URL: http://www.resdev.gov.ab.ca/room/updates/letters/1991/91-17.htm
Bergerud, A.T. 1975. The reproductive season of Newfoundland caribou. Canadian Journal of Zoology 53:1213-1221.
Cameron, R.D., Reed, D.J., Dau, J.R., and Smith, W.T. 1992. Redistribution of calving caribou in response to oil field development on the Arctic Slope of Alaska. Arctic 45:338-342.
COSEWIC. 2000. Updated List of Species at Risk in Canada. Press Release May 8. http://www.cosewic.gc.ca/cosewic/COSEWIC2000.pdf
Curatolo, J.A., and S.M. Murphy. 1986. The effects of pipelines, roads and traffic on the movement of caribou, Rangifer tarandus. Can. Field-Nat. 100:218-225.
Fancy, S.G. 1983. Movement and activity budgets of caribou near oil drilling sites in the Saganavirktok River floodplain, Alaska. Arctic 36: 193-197.
General Wildlife Regulation 50/87 to AR 182/92. 1994. Alberta Environmental Protection, Edmonton, Alberta, Canada.
Horejsi, B. 1981 Behavioral Response of Barren Ground Caribou to a Moving Vehicle. Arctic 34:180-185
Johnson, A.R., Wiens, J.A., Milne, B.T. and T.O. Crist. 1992. Animal movements and population dynamics in heterogeneous landscapes. Landscape Ecol. 7: 63-75.
Marr-Laing, T. and , G. MacCrimmon. 2000. Executive Summary, Patchwork Policy, Fragmented Forests: In-situ oil sands, industrial development and the ecological integrity of Alberta's boreal forest. Pembina Institute Publications. http://www.piad.ab.ca/pubs/p-policy.htm
Mohr, C. 1947. Table of equivalent populations of North American small mammals. American Midland Naturalist 37: 223-249.
Murphy, S.M., and J.A. Curatolo. 1987. Activity budgets and movement rates of caribou encountering pipelines, roads and traffic in northern Alaska. Canadian Journal of Zoology 65:2483-2490.
Nellemann, C. and R.D. Cameron. 1996. Effects of petroleum development on terrain preferences of calving caribou. Arctic 49(1):23-28.
Roberts S. 2000 'Having Fun While Saving Canada's Species'. National Post May 6
Schippers, P., Verboom, J., Knaapen, J.P., and R.C. Apeldoorn. 1996. Dispersal and habitat connectivity in complex heterogeneous landscapes: an analysis with a GIS-based random walk model. Ecography 19:97-106.
Smith, W.T. and R.D. Cameron. 1983. Responses of caribou to industrial development on Alaska's Arctic Slope. Acta Zoologica Fennica 175:43-45
Movement and Distribution of Woodland Caribou in Response to Industrial Development in Northeastern Alberta http://www.deer.rr.ualberta.ca/caribou/SD_MSc.pdf
Boreal Caribou Research Program http://www.deer.rr.ualberta.ca/caribou/BCRP.htm
Lotek Engineering Inc. http://www.lotek.com
Author Information
Jack O'Neill BES, GIS Dipl.
GIS Analysis and GIS Project Management
Alberta-Pacific Forest Industries Inc.
c/o JOGIS
jogis@home.com
Simon Dyer MSc
Wildlife Biologist
Alberta-Pacific Forest Industries Inc.
dyersi@alpac.ca
Shawn Wasel MSc
Business Unit Leader, Environmental Resources
Alberta-Pacific Forest Industries Inc.
waselsh@alpac.ca