ABSTRACT
Natural resource delineation for multi purpose management is becoming more critical as the social and biological demands on land use increases. The continued development of accurate management tools inventorying resources and predicting resource availability, use, and development are essential for successful long term natural resource management. A habitat and wildlife inventory was completed in the 15,000 acre Nulhegan Deer Wintering Area in Vermont. In a pilot section of 3 square miles in this deer wintering area, Global Positioning System (GPS) technology was used to ground truth established winter deer corridors. Using a grid transect of 104 points at 250 meters apart (created through PC ARC/INFO Generate), point locations were ground truthed using Real Time GPS as a navigational tool. At each point Trimble PRO-XR GPS Data Logger were used to collect 14 species habitat requirement variables selected from DeGraaf's Index on New England Wildlife: Management of Forested Habitats.
The purpose of our analysis was to determine, using Geographical Information System (GIS) ArcView Spatial Analyst through interpolation modeling, where the highest probability is of finding White-tailed Deer (Odocoileus virginianus) winter yard habitat in the Nulhegan Basin based on using DeGraaf's index as a predictive model with the ground truth habitat variable data. The resulting composite suitability map representing high, medium, and low probable occurrence of optimal nonbreeding, winter shelter and feeding habitat for white-tailed deer was overlaid onto the deer corridor data to determine if indeed what the deer were actually using corresponded with what the model had predicted as optimal deer habitat. The model accurately predicted moderate to high probability of optimal deer habitat along the ground truthed GPS deer corridors. The ramifications of using Real Time GPS and GIS technologies as natural resource management tools will benefit future land use and species conflict resolution, leading to enhanced long term management objectives with increased accuracy and efficiency.
Key Words: Global Positioning Systems (GPS), Geographic Information System (GIS), Spatial Analysis, White-tailed deer optimal winter yard habitat management, multi purpose management using GPS/GIS technology.
Natural resource delineation for multi purpose management is becoming more critical as the social and biological demands on land use increases. There is a need for the continued development of accurate management tools inventorying resources and predicting resource availability, use, and development. These elements are essential for successful long term natural resource management.
A case study in Vermont concerning a multi-faceted natural resource management problem exemplifies this demand and need for accurate management solutions. The Nulhegan Basin in Vermont is a unique 15,000-acre ecosystem that sustains the largest, most northern, deer wintering herd in Vermont, a rich timber resource, as well as several uncommon species of flora and fauna. A joint resolution passed by both houses of the Vermont state legislature formalized a cooperative management agreement involving 11,268 acres of Champion International Corporation owned land and 1,993 acres of Vermont Agency of Natural Resources owned land for the multi purpose of deer herd management and timber production. Currently the area has changed ownership and is a cooperative venture between private, state, and federal agencies. The main reason driving the resolution in terms of deer population was public interest and desire to "see more deer" in the state of Vermont. Even though the White-tailed deer is not originally an indigenous species to Vermont, the deer harvest and deer sightings are an important part of the culture and tradition in Vermont as well as a part of its wilderness and rural surroundings. Therefore, public opinion strongly supports an increase in deer numbers whether the population and environment can sustain expansion or not.
The winter season is a stressful time for deer and in order to conserve energy and reduce susceptibility to starvation and death, they will converge in habitat that maximizes shelter from snow conditions and access to food with minimal energy exertion. These areas are called winter deeryards and are critical to deer survival during the winter months. As a result, to secure deer numbers managing these wintering areas by protecting or enhancing winter yard conditions becomes important for deer sustainability during winter seasons. Since the largest deeryard in Vermont is located on Paper Company lands actively managed for timber production, the resolution was essential to promote compatible management of both resources. Multi purpose uses such as recreational and non-timber activities are also permitted in the area and are accounted for in management of the area. Over the past five years forestry practices have been making a difference in winter deer shelter and levels of browse (for example increased forage available from timber litter etc.) which is important to assess in terms of future management practices for both deer and timber production.
Champion International Paper has conducted timber inventories and stand typologies however, in order to compliment and enhance compatible management, an inventory and assessment of the area was needed in order to facilitate these management practices and was requested using new, state of the art technology. GPS/GIS technology was provided by Lyndon State College and this study became a collaborative effort among Champion International Paper Inc., Vermont Division of Forestry in the Department of Natural Resources, and Lyndon State College and was funded in part by a School to Work Grant. Global Positioning Systems (GPS) and Geographic Information Systems (GIS) Spatial Analysis (Esri, 1996) methods were used to achieve these goals. The power of GIS lies in its ability to analyze data by measuring areas, overlaying different data sets, or carrying out a range of standard types of spatial analyses modeling (Goodchild, 1997). GPS is a tool that enhances geographical analyses through increased reliability and accuracy and in combination with GIS reflects an increased level of geographic representation (Goodchild, 1997).
In addition to providing this technology to conduct an inventory study, this was an opportunity to test theoretical natural resource predictive habitat models of the probable occurrence of optimal habitat for a species in an area with actual ground truthed data of the species' real use of and whereabouts within that area. GPS/GIS were used in the Nulhegan ecosystem in Vermont to gather ground truthed habitat data to identify optimal deer wintering habitat based on DeGraaf's Index on New England Wildlife: Management of Forested Habitats (DeGraaf et al., 1989). This index describes vegetation habitat requirements for several species using several variables as indexes to optimal habitat. The index of minimum requirements differentiates between preferred or utilized habitat attributes during the winter/winter feeding, nonbreeding season/shelter, and nonbreeding season/feeding period. Based on these predicted habitat requirement variables, actual data collected in an area can be analyzed to delineate species habitat requirements. The collected ground data and this index can then be incorporated to predict or identify what species requirements are being met in the area of interest and determine compatibility and accuracy of prediction. This is useful for decisions about habitat management especially when specific distinctions between optimal and minimum requirements need to be made. Collection of evidence of actual species use in the area, such as winter corridor use and browse, serve as validation procedures to the testing of this potential predictive model.
As the area and habitat need to be managed for multi-purposes and different goals, this type of information and technology can truly enhance long-term management by taking different needs and requirement into account. GPS/GIS technologies can give access to the relationships between various features and illustrate their significance and importance in relation to each other. This has implications for how and where management actions are implemented. This study evolved to illustrate this powerful relationship as a tool for natural resource management.
Our objectives in this study were to:
1) Use Real Time GPS and GIS technology to conduct a habitat index inventory
2) Use GIS Spatial Analysis to determine where the highest probability is of finding winter yarding White-tailed deer using ground truthed habitat data and DeGraaf's Index on New England Wildlife (DeGraaf et al., 1989) as a predictive model. To date this model has not been applied spatially using GIS technology.
3) Collect deer corridor data and evidence of browse to use as a validation of the DeGraaf nonbreeding, shelter, and feeding habitat.
4) Assess the field application of GPS/GIS technology for natural resource management purposes for biological as well as sociological intentions.
A habitat and wildlife index inventory was completed in the 15,000 acre Nulhegan Deer Wintering Area in northern Vermont in the spring and fall of 1997. In a pilot section of 3 square miles in this deer wintering area, GPS was used to ground truth established winter deer corridors and collect habitat and wildlife inventory data. Using a grid transect of 104 points at 250 meters apart generated in PC ARC/INFO Generate and overlaid onto a base map (Figure 1), point locations were ground truthed using Real Time GPS as a navigational tool. Trimble ProXR GPS receivers and Trimble TDC2 data loggers were used to navigate to each grid plot point using Real Time Correction from a signal beacon 50 miles away transmitted from the Canadian Coast Guard Station in St. Jean, Quebec. The degree of accuracy between the plotted grid point and the actual recorded ground truthed grid point ranged from 0.1 to 5 meters.
Figure 1. 104 GPS Collected Data Points in the Nulhegan Study Area.
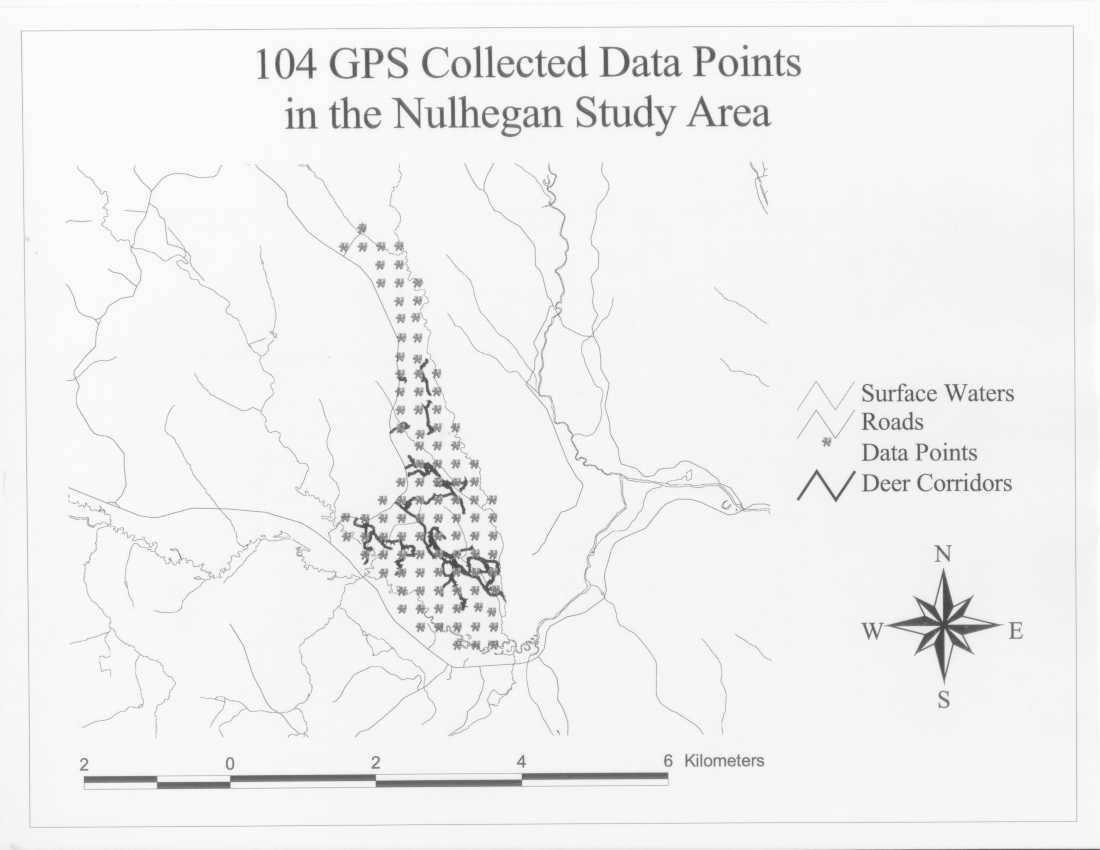
GPS receivers and data loggers were used to gather deer corridor data by walking snow packed deer paths that intersected and were within the study area while the receiver recorded the locations of the deer travel routes in the spring of 1997. The corridors were not difficult to identify as they were well packed and had obvious deer sign and droppings as well as actual deer.
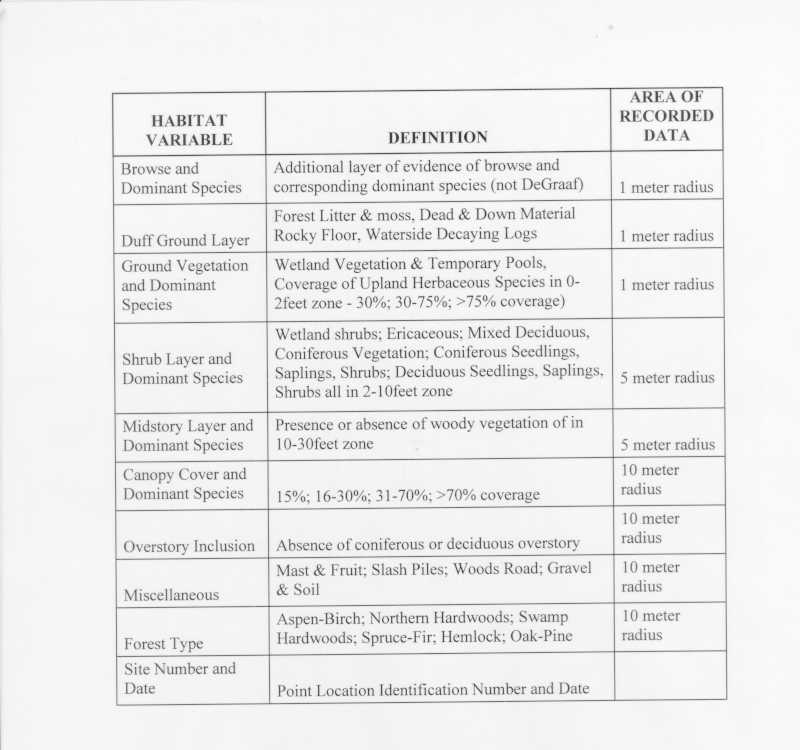
In the fall of 1997 researchers navigated to the pre-established 104 transect grid points and used the GPS data logger to collect 14 species habitat requirement attribute variables selected from DeGraaf's Index on New England Wildlife: Management of Forested Habitats (DeGraaf et al., 1989). These variables included: Duff Ground Layer, Ground Vegetation, Ground Vegetation Dominant Species, Shrub Layer, Shrub Layer Dominant Species, Midstory Layer, Midstory Layer Dominant Species, Canopy Cover, Canopy Cover Dominant Species, Overstory Inclusion, Miscellaneous, and Forest Type (DeGraaf et al., 1989) as well as Browse, Browse Dominant Species, Site Number, and Date (Table 1). Presence of browse as well as the dominant species of each variable (when appropriate) was added to be able to display distribution of species in the area as well as to validate DeGraaf's index data prediction. The Browse, Duff Ground Layer, and Ground Vegetation Layer data were recorded within a 1-meter radius. The Shrub Layer and Midstory Layer data were recorded within a 5-meter radius. The Canopy Cover, Overstory Inclusion, Miscellaneous, and Forest Type data were recorded within a 10-meter radius (Higgins, 1996) (Table 1).
Table 1. Habitat Variables Collected Using GPS in the Nulhegan Basin Based on DeGraaf's Habitat Index.
A data dictionary containing all the deer criterion variables was loaded into the data logger for this habitat variable data collection. Each variable was coded and a key sheet and tree/shrub identification guide were carried along in the field. Data were collected in the data dictionary while the receiver recorded the location, which is what makes it possible to attach the data variables to the exact point location. While collecting data, researchers were accompanied by undergraduate students in the field, exposing students to and giving them the opportunity to experience real resource management issues and data collection methodologies. Using these GPS/GIS technologies in a curriculum is an example of enhancing learning in higher education. This also expedited data collection as the researchers were given plenty of help in collecting the data with additional man-hours. Once completed, both corridor and inventory data sets were processed from the GPS data loggers through Trimble Pathfinder Software (version 1.1) and exported into ArcView GIS software (Esri, 1996) for analysis.
All these variables were collected so that this model could be applied to any species. However, the minimum habitat requirements for yarding White-tailed deer can be narrowed down to preferred or utilized during the winter/winter feeding, nonbreeding season/shelter, and nonbreeding season/feeding period according to DeGraaf et al., (1989). According to this index during this specific time of year, white-tailed deer require by utilization or preference:
1) Canopy Cover of 31%-70% and/or Canopy Cover of 70%,
2) Shrub Layer of deciduous seedlings, saplings, shrubs in 2-10 feet zone and/or ericacious vegetation in 2-10 feet zone,
3) Coniferous Overstory Inclusion,
4) Forest Type of Aspen/Birch, Northern Hardwoods, Swamp Hardwoods, Spruce Fir, and Hemlock (there was no red oak in the Nulhegan),
5) Mast and Fruit (Miscellaneous) {this variable was excluded from analysis as there were no data available for this variable}.
Using GIS ArcView Spatial Analyst (Esri, 1996) through interpolation modeling, the purpose of our analysis was to determine where the highest probability is of finding wintering White-tailed Deer (Odocoileus virginianus) in the Nulhegan Basin based on using the index as a predictive model with the ground truth habitat variable data. The variable criterion that represented preferred or utilized habitat were re-coded and assigned a value of 1. The remaining index variables not utilized and/or preferred by deer that did not meet deer habitat needs, were re-coded and assigned a value of 0. This re-coding of the data was done to generate surface inference over area surfaces. The range of data then becomes continuous between 0-1, representing a probability of 0 being poor habitat and 1 being optimal habitat. Having re-coded these variables, the data file containing all the variables from the 104 points was queried in ArcView based on DeGraaf's Index of Forested Habitat and Structural Habitat feature requirements restricted to winter, winter feeding, nonbreeding season/shelter, and nonbreeding season/feeding to reflect deer yarding needs in order to start the spatial analysis of these data.
A surface interpolation was conducted on each criterion variable using the Inverted Distance Weight Method (IDW) and by using either a fixed radius or nearest neighbor of 12. The cell extent was set at 10 meters to reflect the actual field data collection area for these variables (Higgins, 1996) rather than the 30-meter cell size often used in modeling to accommodate other images such as DEM models etc. As a result, this produced a grid of 10-meter cells, which means the actual data point within a 10-meter cell has either a value of 1 or 0. The surface interpolation now needs to infer the probability of the 10-meter grid point data values onto each 10-meter cell between all 104 grid points. This method acts like a ripple affect: the value of the point is strongest at the actual 10-meter point location and the probability of a cell having that value slowly diminishes the further away from the point you get. In this way, this method infers the probability of the point value on the neighboring cells and each cell value will be influenced by its neighbor. There are several Spatial Analysis methods such as the Theissen Model and Kriging (Esri, 1996) however, these models introduce a variety of spatial inference static. For example, the Kriging method actually replaces cell values without any rippling affect.
After the interpolations, these images were then summed, averaged, evenly weighted, and arithmetically evaluated through the map calculator to produce a final composite suitability map representing optimal yarding White-tailed deer habitat in the Nulhegan study area. This method is not strict Boolean logic where an area would be rejected because it doesn't meet the Boolean model. In this study, probability values were assigned using IDW, and then this method calculated the probability of finding that value in a pixel. These were then averaged and evenly weighted in order to obtain a low, medium, high probability of that value meeting requirements for deer wintering habitat. Future research needs to address standardized methods of this methodological procedure.
The resulting composite suitability map representing the probable occurrence of optimal habitat for white-tailed deer was overlaid onto the deer corridor data to determine if indeed what the deer were actually using corresponded with what the model had predicted as optimal deer habitat. As a final evaluation of the actual use of this predicted optimal deer habitat, we interpolated the browse coverage variable and overlaid this image and the deer corridor coverage with the suitability map to see if these occurred in the same place.
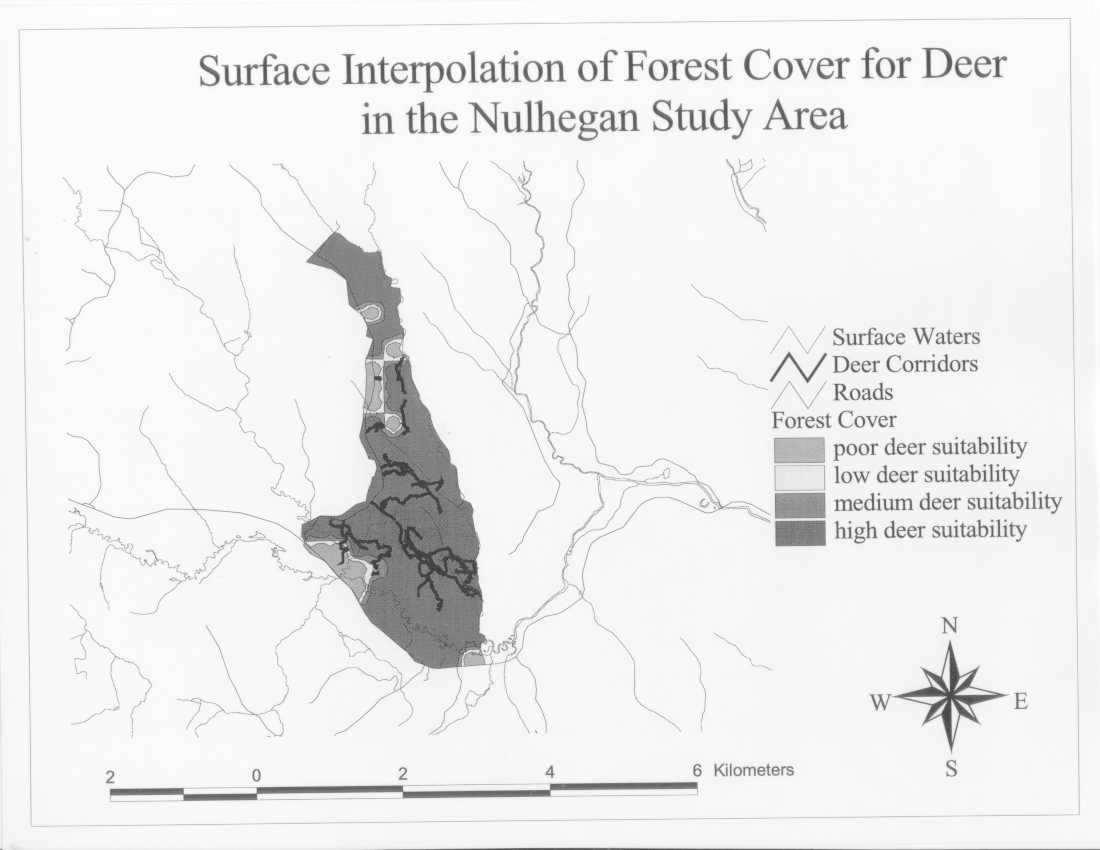
In order to relate the interpolation process to managers concerning potential deer presence, absence, habitat suitability, or unsuitability and consequential multi resource management, the resulting interpolation probabilities were organized into four categories representing: poor deer suitability areas, low deer suitability areas, medium deer suitability areas, and high deer suitability areas. This allows a direct transfer of the results spatially to what management practices are needed for the Nulhegan habitat area management.
As each step in the interpolation process develops from Shrub Layer, to Canopy Cover, to Overstory Inclusion, to Forest Cover Type (slightly broader due the extensive spectrum suitable for deer), a pattern of medium to high deer habitat suitability areas starts to develop within the study area (Figures 2, 3, 4, and 5).
Figure 2. Surface Interpolation of Shrub Layer for Deer in the Nulhegan Study Area.
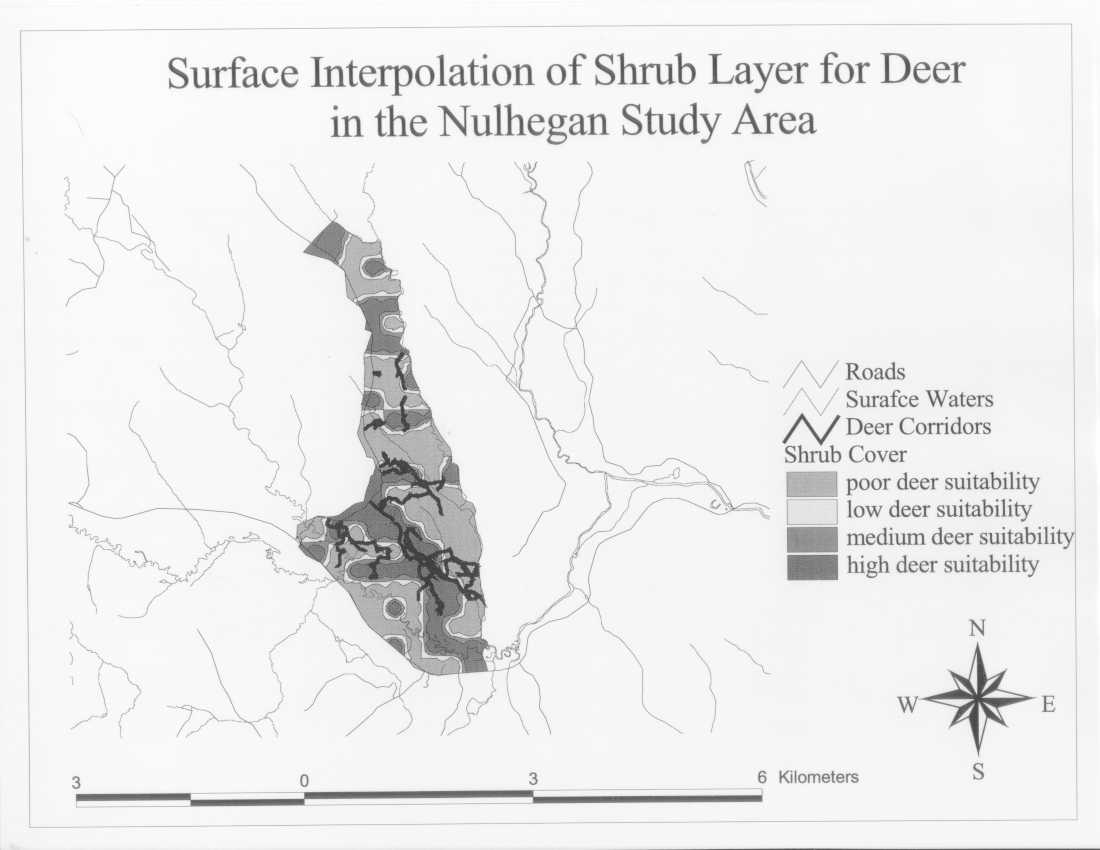
Figure 3. Surface Interpolation of Canopy Cover for Deer in the Nulhegan Study Area.
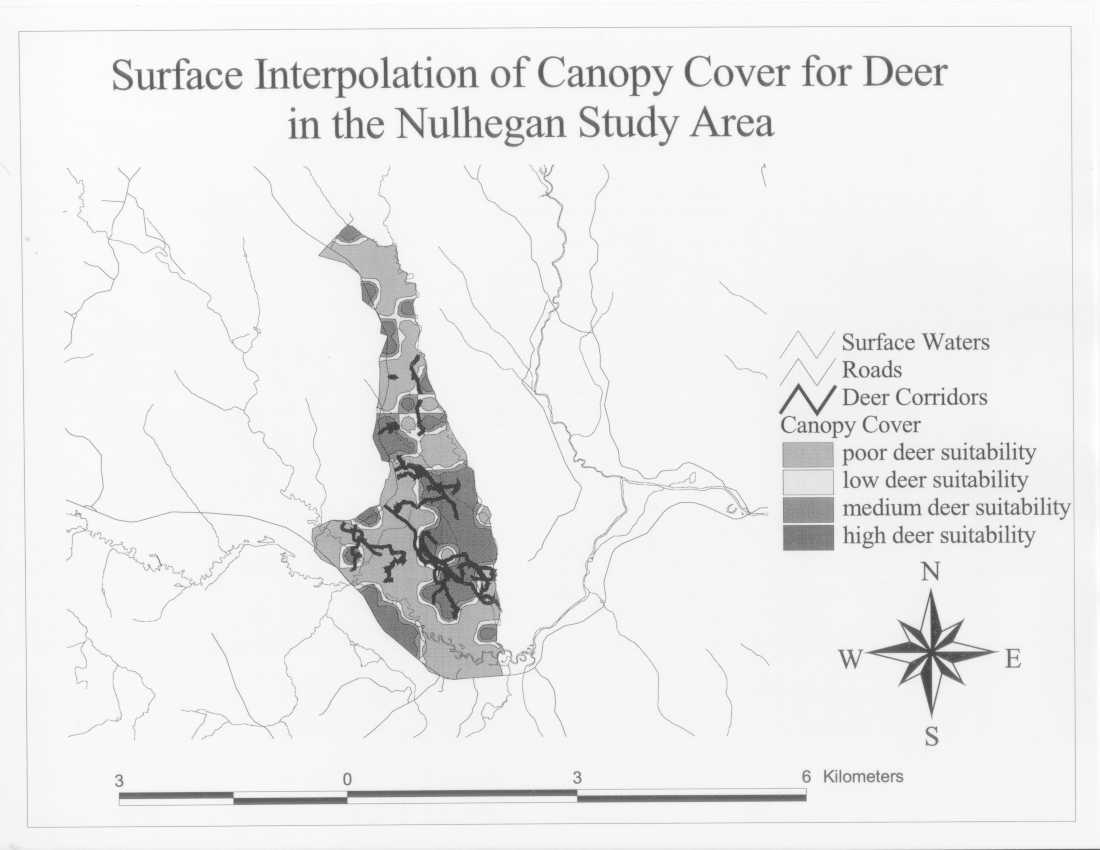
Figure 4. Surface Interpolation of Overstory Inclusion for Deer in the Nulhegan Study Area.
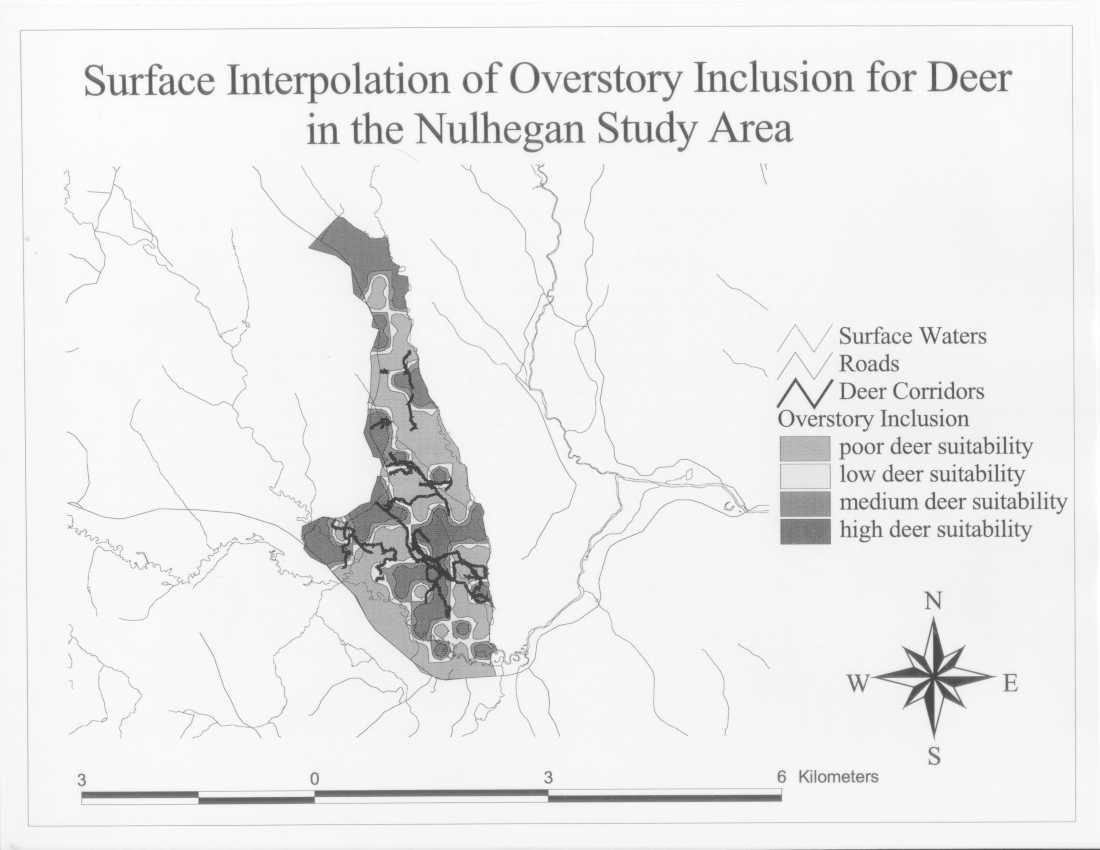
Figure 5. Surface Interpolation of Forest Cover for Deer in the Nulhegan Study Area.
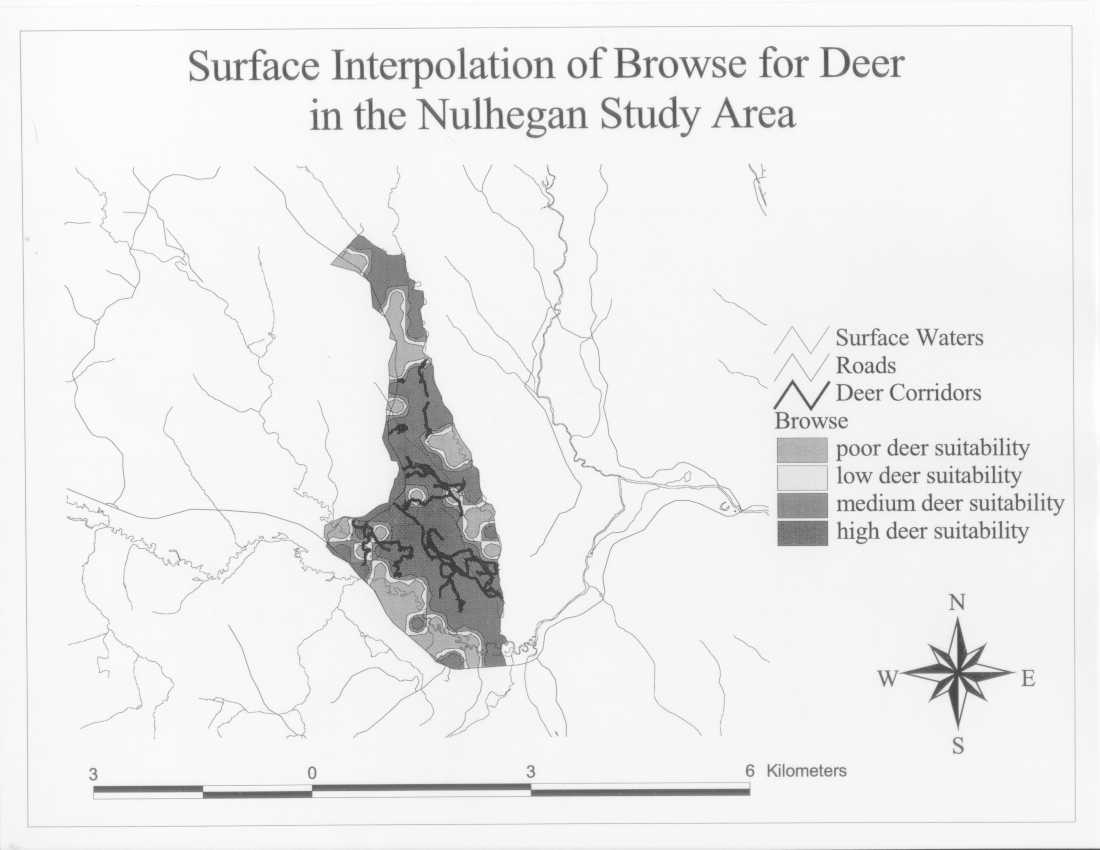
In the concluding evaluation of all these variables in to the final composite suitability map depicting optimal deer wintering habitat in the Nulhegan, the focus of medium to high deer suitability areas is concentrated along a diagonal through the study area. The deer corridors pass right within these medium to high deer suitability areas (Figure 6). As mentioned earlier, the deer browse variable was interpolated as another check of this predictive model using ground truthed data, and again the medium to high browse areas follow the final composite suitability optimal areas as well as the deer corridors (Figure 7). Even though the browse interpolation areas are more extensive than the final composite areas, it displays the same trend of medium to high suitability areas. This model accurately identified and predicted where deer utilization within the study area occurred. This interpolated model as well as the deer corridors selected out the managed forestry areas from the past five years, indicating that deer are using these managed areas during the winter months.
Figure 6. Final Deer Habitat Composite Suitability Map for Deer in the Nulhegan Study Area.
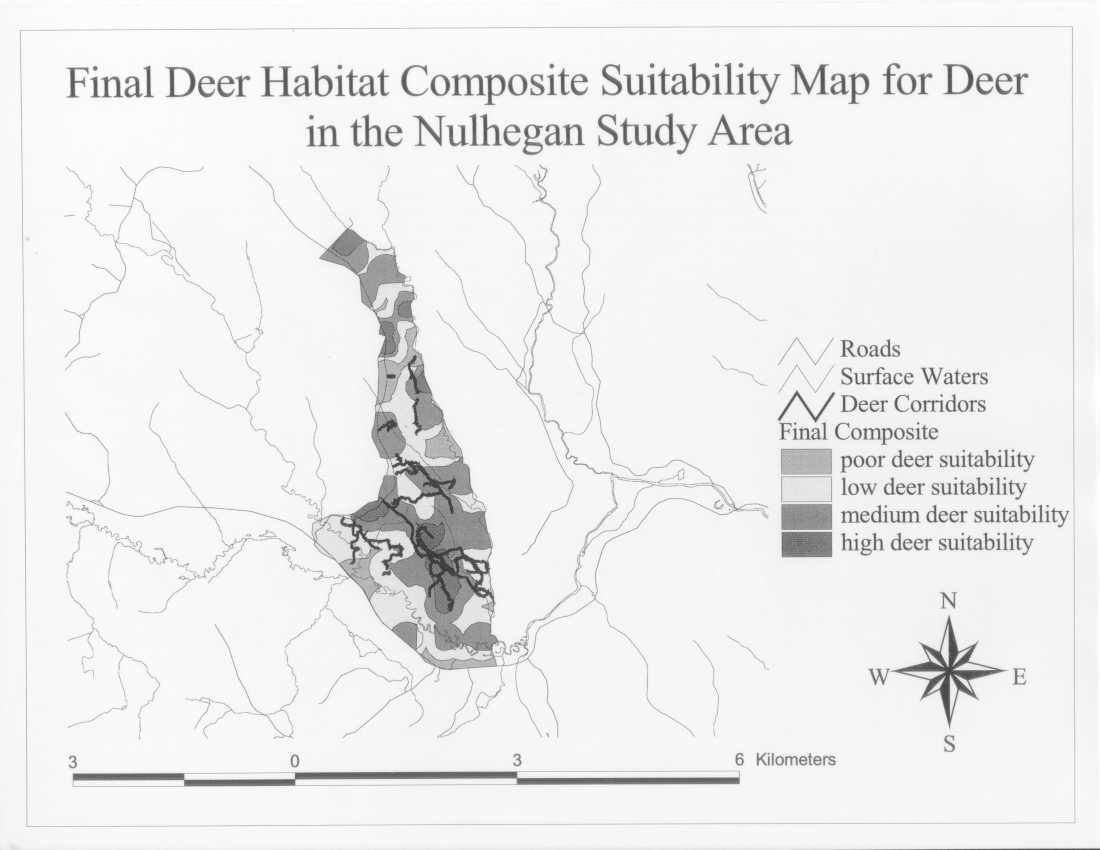
Figure 7. Surface Interpolation of Browse for Deer in the Nulhegan Study Area
To numerically substantiate the geographic representation of the data, meters of deer corridor per hectare within the different poor, low, medium, and high deer suitability areas were calculated. The high suitability area contains 53 meters of deer corridor per hectare, the medium to low areas contain 27 and 25 meters per hectare respectively, and the poor area contains 7 meters of deer corridor per hectare. We ran a chi-square (X2 = 7.81) on these data (df = 3, a = 0.05) and confirmed that there is an association between suitability areas and deer corridors. From all these results, it is apparent that the model accurately predicted moderate to high probability of optimal deer habitat as checked along the ground truthed GPS deer corridors and browse.
Although the model accurately predicted optimal wintering deer habitat areas in the study area, the model did not include variables such as species range, climate, timber variables (pole size, saw log, forex data), etc. The presence or absence of these variables will affect species use of an area as well as the actual availability of an area to a species. In addition, the importance or weight of each variable to the species is not accounted for, climatic conditions are not included, and factors such as home range or territory size are not incorporated in the model.
The reason a 250-meter grid with 104 data collection points within the study area was created was dictated by the window of time available for data collection. This could be compared to other methods such as random or cluster point methods. However, experience on two other studies conducting similar habitat inventories demonstrated that these methods do not pick up changes in vegetation zones that a systematic grid plot forces you to do. However, the confidence in the accuracy of the inference of the surface interpolation between data points might increase if the distance between data collection points was decreased, since this would mean having fewer neighboring cells to infer upon. Currently the researchers are conducting a new study testing the accuracy of the grid point system with 200-meter distances. There is discussion about what the minimum and maximum grid distance should be. Traditionally 100-meter grids have been used. One of the underlying purposes of using this technology is to increase productivity (such as decreasing labor intensive field time by using the 250-meter grid for example) while maintaining the quality and validity of the data. This results in a constant tension between these elements that will only be resolved through continued research on what distance is most efficient as well as reliable and valid. There is a need to standardize this issue in order to have compatible and comparable results in the future.
This type of ground truthing methodology lends itself to accurate Surface Interpolation modeling because the habitat data are sub-canopy and are actually known within 1-10 meters versus satellite digital imagery or any remote sensing where the data are above the canopy and the sub-canopy has to be inferred from the top down. The difference in this study is this method is looking from known data on the ground and then moving upward whereas remote sensing data infers from the top down to the ground. To achieve this type of ground truth data collection however, entails intensive field hours. Applying this model is not cost effective due to this non-traditional sub-canopy intensive field approach but the results can demonstrate to be more accurate.
However, the model had difficulty predicting moose habitat even though use of this species was evident in the field. The questions then are do the model variables accurately reflect moose habitat requirements or do the data collected not adequately represent moose habitat use? Re-testing the model by collecting random data points in the study area and observing if the data fits the model surface inference of the habitat variables would validate the model. The reason for this step is that there are few accepted statistical analytical models for establishing levels of confidence in terms of accepting data. Spatial and Geo Statistics are in their infancy and those models that are established have been developed for the validity of satellite digital imagery and not for ground truthed data modeling.
Documentation of GPS equipment durability and quality of results in the field is still in the process of being addressed and assessed (Moen et al. 1996, Rempel et al. 1995, Rodgers et al. 1995, Rodgers et al. 1996). Therefore, in addition to these results in terms of natural resource management implications, it is important to report that during this study the Trimble GPS equipment (receivers and loggers) operated well under various and adverse climate and habitat conditions during data collection. These conditions included operation in temperature ranges from 0 degrees Celsius to 15 degrees Celsius. The receivers were able to collect real time correction data under dense canopy as well as through and under dense shrub and midstory layers. In addition, the receivers continued operation during rain and snowstorms (with as much precaution and protection taken as possible in those field conditions). These are important features to be taken into account for future application of this technology in the natural resource field, which often requires extreme habitat and weather field conditions for data collection.
The capability of this GPS/GIS technology in the natural resource field will benefit land use and species conflict resolution due to its ground truthing and surface interpolation accuracy. These technologies will or have the capability to enhance natural resource restoration, conservation, and protection goals by helping and validating the decision-making processes. An ethical caveat to determining these predictive maps of species locations is who might use these data other than managers. If the general (non-research/management) public has access to optimal species habitat location information, will this increase the number of people and traffic to an area, or potentially change the habitat or behavioral patterns of species in the area and therefore result in impacting the species that are being managed? These are interesting issues to keep in mind as modern data accessibility becomes more readily available. However, as biological and social demands and pressures on land use and our natural resources increases, positional accuracy and efficiency of data collection, and their inferences are important for compatible long-term management objectives, planning, and increasing field data collection productivity. These data reflect the potential for long term management by using predictive models, especially if factors such as time, growth, range, climate, disturbance etc. can be included for long range planning purposes. In addition, this study exemplified the importance of using GPS/GIS technology to enhance learning in higher education. The ramifications of using this Real Time GPS and GIS technology as a natural resource management tool will benefit future land use and species conflict resolution, leading to enhanced long term management objectives with increased accuracy and efficiency.
Berry, J.K. 1995. Spatial reasoning for effective GIS. GIS World, Inc. Fort Collins, CO. 208pp.
DeGraaf, R.M., M. Yamasaki, W.B. Leak, and J.W. Lanier. 1989. New England wildlife: management of forested habitats. Northeastern Forest Experiment Station, USDA Forest Service, Radnor PA, General Technical Report NE-144. 271pp.
Esri. 1996. ArcView GIS and Spatial Analyst. Environmental Systems Research Institute, Inc. Redlands, CA. 350pp and 48pp.
Goodchild, M.F. 1997. Geographic information systems. In: S. Hanson (ed.) Ten geographic ideas that changed the world. New Brunswick, NJ, Rutgers University Press, pp. 60-83.
Goodchild, M.F. 1996. GIS and environmental modeling: progress and research issues. GIS World, Inc. Fort Collins, CO. 486pp.
Higgins, K.F., J.L. Oldemeyer, K.J. Jenkins, G.K. Clambey, and R.F. Harlow. 1996. Vegetation sampling and measurement. In T. A. Bookhout, (ed.), Research and management techniques for wildlife and habitats. pp. 567-591, 5th ed. The Wildlife Society, Bethesda, Md.
Moen, R., J. Pastor, and Y. Cohen. 1996. Accuracy of GPS telemetry collar locations with differential correction in theory and practice. Journal of Wildlife Management, 60(3).
Rempel, R., A. Rodgers, and K. Abraham. 1995. Performance of GPS animal location system under boreal forest canopy. Journal of Wildlife Management, 59.
Rodgers, A., R. Rempel, and K. Abraham. 1995. Field trials of a new GPS-based telemetry system. Biotelemetry XIII:172-178.
Rodgers, A., R. Rempel, and K. Abraham. 1996. A GPS based telemetry system. Wildlife Society Bulletin, 24(3):559-566.