Stacy D. Myers
Michael H. Broker
Robert M. Brown
Rudy Smith
The use of ArcView, ArcView Image Analyst Extension and ArcInfo by the South Florida Water Management District has become a crucial tool used for documenting violations that impact the water resources of South Florida (surface waters, wetlands, etc.). Three case study violations that utilized these technologies to assess and document impacts to wetland and upland systems are reviewed in this paper.
The purpose of this paper is to describe how the Environmental Systems Research Institute's (Esri) ArcView, ArcView Image Analyst Extension, ArcInfo, and Trimble's GeoExplorer and ProXR GPS Units are utilized by the South Florida Water Management District to assess and document violations that impact the water resources of South Florida (surface waters, wetlands, etc.). The case studies listed below describe how the use of these tools was instrumental in documenting violations.
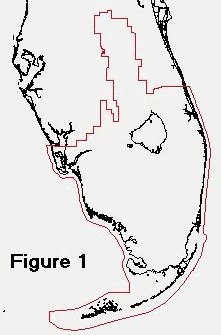
The South Florida Water Management District (SFWMD) encompasses 16 counties in South Florida (Figure 1). The SFWMD's authority to regulate is from Chapter 373 of the Florida Statutes (F.S.) and has a jurisdiction that spans 17,930 square miles of land and water. On October 3, 1995, the SFWMD began implementation of the Environmental Resource Permitting (ERP) Program. The ERP Program allows the SFWMD to regulate all activities in, on, or over wetlands or other surface waters and the management and storage of all surface waters within its boundaries. Chapter 373 F.S. requires that an ERP Permit be obtained prior to construction or alteration of a stormwater management system, dam, impoundment, reservoir, appurtenant work, or other works. The ERP Program contains aspects of permitting, compliance, and enforcement. This paper centers on the enforcement aspects of the ERP Program.
Compliance and enforcement at the SFWMD begins with the discovery of a violation either by aerial or ground surveillance. On occasion, violations are discovered by a private citizen or by an employee from another State or Federal agency. While the SFWMD relies upon other local and State agencies to assist in enforcement and compliance, the primary means of detection is through the compliance and enforcement staff of the SFWMD's Environmental Resource Compliance Division.1 Aerial surveillance by SFWMD helicopters allows the Division staff to survey many square miles in a relatively short period of time. Documentation of violations by staff during the flights usually consists of hand written notes describing the nature of the violation and 35mm photographs of the actual violation. However, the frequent use of this technology to search and document violations becomes very costly. Furthermore, these assessments are predominately qualitative in nature. Occasionally, field surveys were done to give approximate quantitative assessments of the violations. Without pre-violation impact surveys or imagery, violation acreage assessments can only be approximated. It is also important that violations are properly and consistently documented so as to allow the SFWMD and the violator the ability to quickly reach consensus on the impacts and begin the remediation process thereby minimizing long-term adverse impacts associated with on-going violations2.
Field documentation of a violation is used to:
1. determine the overall strengths and weaknesses of an enforcement case.
2. determine the specific remedial and punitive action required by the SFWMD
3. provide evidence in court or in administrative proceedings.3
The remote sensing/GIS tools now utilized to enhance documentation of enforcement violations include Esri's ArcView, ArcView Image Analyst Extension, ArcInfo and Trimble's GeoExplorer and ProXR GPS units and Trimble's Pathfinder Office Post-Processing software. Esri's ArcView GIS is the leading software for desktop GIS and mapping. ArcView Image Analyst Extension allows the user to import and incorporate raster imagery into ArcView, rectify an image to a map coordinate system, compare images of approximately the same area at different points in time, categorize an image into a number of classes corresponding to land cover types, and spectrally enhance an image. ArcInfo has typically been used for coverage theme editing and other more accuracy dependent functionality. Many of the complex theme editing functions in ArcInfo that were relied upon in the past have been replaced by the wide suite of ArcView extensions. However, in the past, for accuracy dependent operations such as projections and .dxf to arc conversions, ArcInfo and its associated AMLs was the preferred software tool. As the repository of ArcView extensions grows, much of the ArcInfo functionality can be replaced reducing the necessity of ArcInfo support. This new suite of extensions have also increased the flexibility of ArcView and provides new opportunities for work arounds that minimize the need for ArcInfo. Trimble Pfinder and Pathfinder Office are the "work-horse" programs for correcting, manipulating and exporting raw and post processed GPS data. As this collection of software has continued to evolve, a much quicker turn-around time has been achievable in documenting these cases.
In violation cases where imagery and surveys are required to determine extent of violation impact, pre-existing AutoCAD (.dxf or dwg), GIS files or pre-violation dated imagery was used to quantitatively assess the impact. If only hardcopy surveys of the site "prior to impact" exist, then these surveys are digitized or scanned to geometrically overlay the corrected imagery of the site. The geometrically corrected imagery is usually saved to Imagine (.img) format and the data stored as shapefiles.
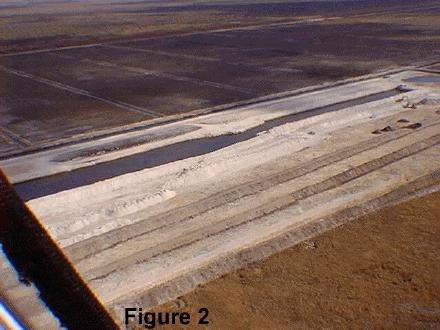
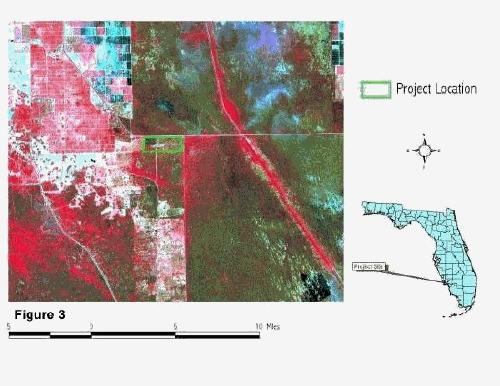
Case Example 1 is a wetland impact violation that was discovered as a result of a field visit to the site. SFWMD staff observed the construction of a mine pit and several irrigation ditches throughout the property. Due to the exposure of hydric soils at the mine location and at several "recently excavated" irrigation ditches, SFWMD staff determined that a wetland alteration violation had occurred. Staff determined that new dredge and fill activities and wetland impacts had occurred. However, staff could not ascertain the extent of the impact in the field. Only after a helicopter overflight of the site (Figure 2), review of historical SPOT Multispectral Satellite Imagery and NAPP aerial photographs could SFWMD staff begin to determine the approximate scope of the violation (Figure 3, Courtesy of SPOT Image Inc.).
To quantify the violation's exact acreage impact, the SFWMD staff opted to document the area utilizing GPS technology. Using a Trimble ProXR and Trimble Explorer GPS Units, SFWMD staff documented the extent of the unauthorized impacts:
a) mine pit boundary
b) spoil disposal area
c) dewatering impoundment
d) lateral ditches, roads and water control structures
e) pump location
After documenting these areas, SFWMD staff devised a gauge for recording the depth of the mine pit (which was filled with water at the time). Due to the remote location and rugged terrain at the site (steep side slopes and unstable berms), a small boat was used for accessing the pit. Utilizing a weighted tape measure and a GPS unit, SFWMD staff created a generalized cross-sectional profile by estimating the depth of the mine pit with the weighted tape (Z and GPS for X and Y) at recorded intervals. This data would be used later for estimating the volumetric data needed for the restoration plan.
Wetland boundaries, including those that were impacted were delineated through photointerpretation of recent and historical SPOT imagery and then later verified in the field with the Trimble GeoExplorer GPS unit.
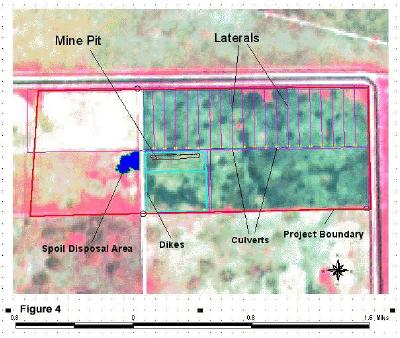
The raw GPS data was post processed using Trimble Pfinder software. Resultant vector data included polygons representing spoil deposits, mine perimeters; and point data representing pump and culvert locations. The point data was created by collecting 180 positions at each location and differentially correcting the files. During the export process the data points were averaged to provide a single point file.4 These points were then exported into the .dxf format and opened in ArcInfo. When in ArcInfo, the coverages were created using the DXFARC command. These coverages were then converted into shape files and utilized by SFWMD staff to prepare visual exhibits documenting the violation overlaid on 1995 SPOT multispectral imagery in Esri ArcView 3.0a (Figure 4, Courtesy of SPOT Image Inc.).
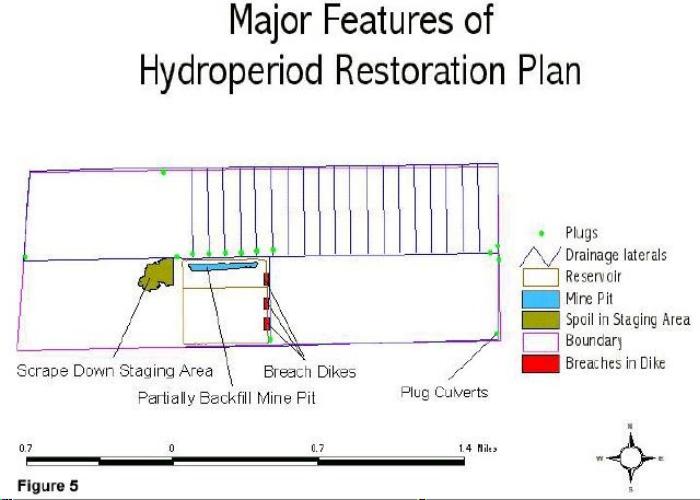
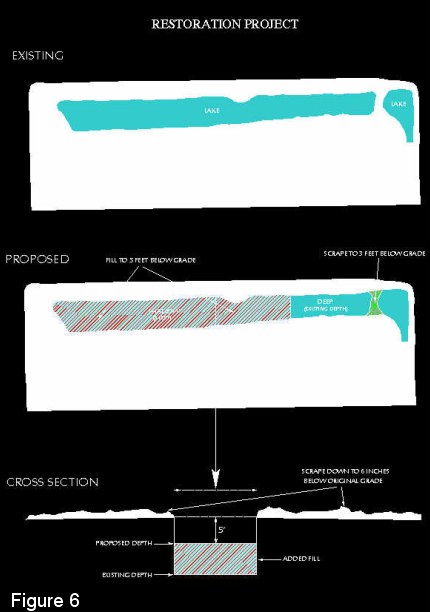
After seeing the ArcView maps delineating the unauthorized activities and the wetland impacts, the violator quickly agreed to develop an interim restoration plan (as they indicated a desire for future "approved" activities in this area). The main concept of the restoration was to re-establish the natural seasonal hydroperiod of the wetlands, backfill the unauthorized mine pit (creating shallow and deepwater habitat in the process), remove the spoil from a disposal area in wetlands and to plug the newly created drainage network. ArcView and ArcInfo was then used to display each restoration step as shown on Figures 5 and 6. Subsequent compliance field visits revealed a successful restoration with the area frequented by numerous wading birds. The detailed geographic data that was collected during the restoration also provided valuable information that was utilized for future wetland mitigation projects.
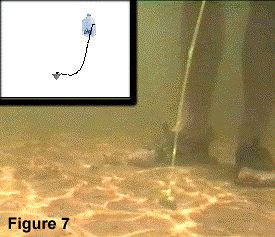
Case Example 2 is a seagrass impact violation that was discovered during the review of an adjacent project by SFWMD staff. During the permit application process, which originally began in 1995, two bathymetric surveys were provided. The first was provided on June 1997 and the second on August 1999. District staff noted some significantly deeper areas on the second survey over those which were depicted on the first. Further investigation in August 1999 revealed the apparent "prop dredging" of the submerged lands in that area. As a result, District staff conducted a field survey to document the extent of the submerged impact area using weighted markers or buoys and then used the GPS to capture the resultant impact perimeter with the Trimble GeoExplorer GPS. In addition to GPS, each of the 28 buoyed locations were videotaped using a Sony High-8 Videocamera in an underwater housing. A "leap frog" approach of delineating the edge of impact, setting buoys, videotaping their position on the bottom (Figure 7), recording the GPS position of each buoy and finally removing the buoy(s) to advance to a new position further ahead in the survey was utilized.
This procedure required the use of four SFWMD staff members, however, it also resulted in the completion of the survey in a single day. The Trimble GeoExplorer model GPS receiver was chosen for the field survey because of its flexibility and compact design, thereby making it ideal for field work and use around water. Due to the harsh nature of the saltwater environment, other models with external antennas and batteries are not practical for staff standing in waist deep water. The GPS files were collected by recording 180 points at each position and later differentially corrected and averaged into a mean location for each vertex. This data was then exported as a .dxf file for use in ArcView and then later converted to a shapefile. Due to the close proximity of the base station to the site (approximately 7.5 miles) the post-processed GPS data provided a high level of accuracy.
SFWMD staff also obtained a seagrass survey that was conducted prior to the "prop dredging" of the seagrasses. The survey was completed by a local governmental agency and was geo-referenced to the Florida State Plane Coordinate System, East Zone (3601) in a .dxf file format. However, the file was not in the datum used by the SFWMD and had to be reprojected from NAD27 to NAD83. This operation was completed in ArcInfo using the Project command, because of a slight error, found to be generated by an earlier version of a third party ArcView Projection extension. After the survey was opened in ArcView, it was converted from the .dxf file to a shapefile.
The June 1997 and the August 1999, bathymetric surveys were only in hardcopy format. These had to be scanned into the TIF file format and then rectified to the existing seagrass survey shapefile (discussed above) using ArcView Image Analyst Extension.5 Both surveys included approximately 14 ground control points (GCPs), and were saved in Imagine (.img) file format.
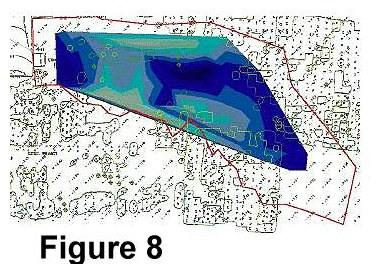
In a new view, the June 1997 bathymetric survey was overlaid with both the seagrass survey shapefile and the submerged lands impact area shapefile (Figure 8).
In another view, SFWMD staff opened up the August 1999 bathymetric survey overlaid with both the seagrass survey shapefile and the submerged lands impact area shapefile (Figure 9).
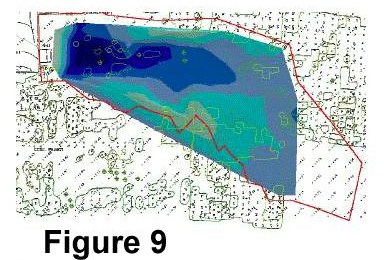
As expected, a side by side comparison of both views revealed a significant change in bathymetry between the two surveys. Furthermore, the changes were limited to the area within the submerged lands impact area. The overlay of the submerged lands impact area over the seagrass survey shapefile also revealed an approximate 1.75 acre seagrass impact (1.75 acres of seagrass that were surveyed prior to the impact were destroyed by prop dredging). It was also at this time that the clipped seagrass coverage provided a quantitative analysis as to the exact impact to the individual species of seagrasses within the impact footprint. Later oblique aerial photographs taken by SFWMD staff also confirmed the extent of the impact area.
Case Example 3 is a compliance violation of an existing permit. The permitted project was required to maintain a wildlife corridor (the location is in an area frequented by the Federally endangered Florida Panther). Approximately three years after the permit was issued, SFWMD staff inspected the site and determined that the wildlife corridor had been cleared and replaced with a citrus grove. After initial review of 1990 and 1993 blueline aerials (1:400 scale) and permitted drawings of the project site, SFWMD staff and the violator's consultant became frustrated in determining the exact location for the corridor and the extent of upland compensation before it was cleared. This was further complicated by the fact that the citrus project was not constructed as permitted. The resultant gridlock between the SFWMD staff and the permittee/violator on this issued forced that case to litigation. Furthermore, during this same time period, the permittee filed for bankruptcy. A prospective new owner showed interest in buying the land and resolving the case. SFWMD staff then proceeded to utilize its archive of satellite imagery and aerial photographs to resolve the questions regarding the corridor/upland compensation acreage. Originally, the extent of the corridor/upland compensation areas were estimated by SFWMD staff using a planimeter on 1:400 aerials with the permitted corridor sketched onto it. Due to differences in acreage determinations by SFWMD staff and the violator's consultant, GIS and remote sensing was used to provide a precise measure to the impact. To ascertain the exact location and spatial extent of the wildlife corridor, SFWMD staff utilized 1988 SPOT Satellite Imagery (panchromatic), 1991 National Aerial Photography Program (NAPP) Color Imagery and SCS aerial photography to quantify the spatial extent of the corridor. However, due to unsuitable image dates and poor image resolution, the historical boundary could not be adequately derived from the imagery. Therefore, a digitized version of the hardcopy survey that accompanied the original permit was used and overlaid onto 1997 SPOT multispectral imagery (Figure 10, Courtesy of SPOT Image Inc.).
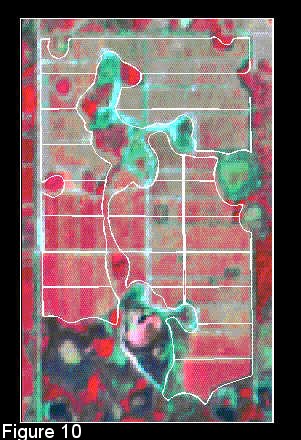
This allowed District staff to disprove the claims by the violators consultant that more preservation had been provided (post clearing of corridor) than was required by the permit.
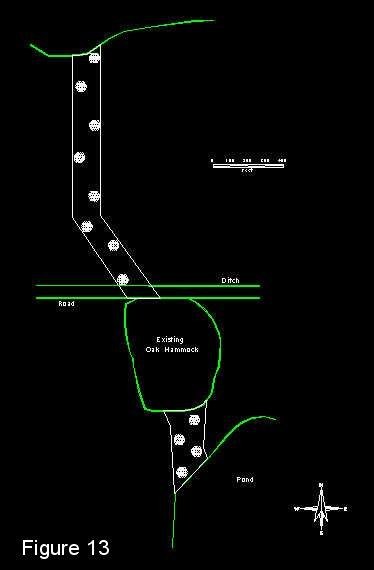
In a continuing effort to resolve the violation, the landowner's consultant submitted a restoration plan for the approximate 1500 ft. long corridor. The original restoration plan, as submitted by the consultant, included a drawing that was not to scale, indicating the proposed replanting scheme for the corridor. The initial restoration plan (Figure 11) illustrates the layout of six tree clusters within the newly recognized corridor footprint. Each cluster is to contain approximately 30 native oak trees planted on 10-foot centers. Additionally, each cluster is to contain approximately 20 cabbage palm trees scattered throughout the cluster.
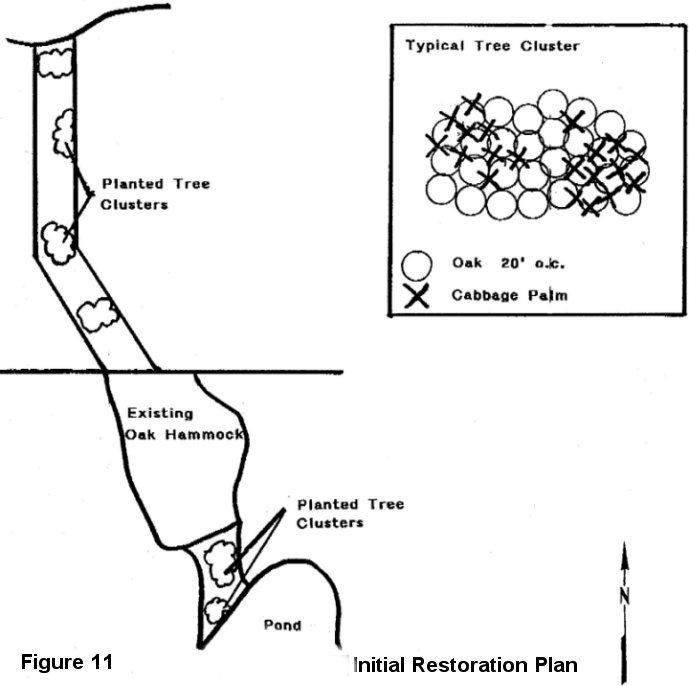
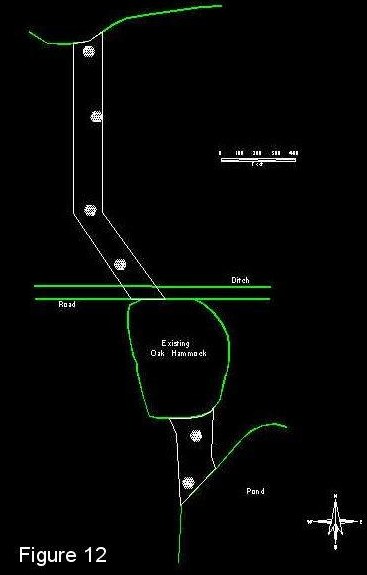
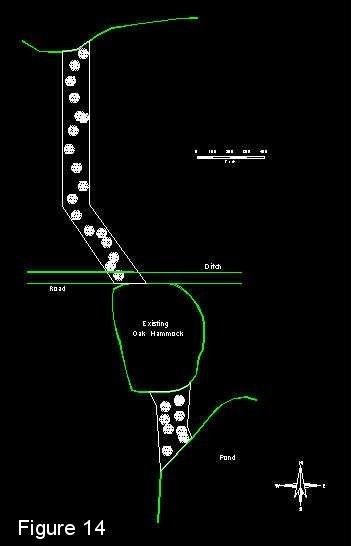
At first glance, this initial restoration proposal visually appeared acceptable (the size and placement of tree clusters seemed adequate as a foundation for restoring the native vegetation in the corridor). However, the spatial features of the restoration proposal were generalized leading SFWMD to suspect that the drawing was inaccurate. As a result, SFWMD staff opted to create multiple (30) scaled tree canopy polygons in ArcInfo, in an attempt to recreate the tree clusters as proposed in the restoration plan. When these newly created tree clusters were placed in the corridor, per the consultant's design, the revegetation scheme seemed sparse at best. In an effort to better negotiate a functional corridor, SFWMD staff created 3 alternative planting schemes. The first (Figure 12), mimicked the consultant's plan and was labeled as such. Next (Figure 13), an intermediate density corridor was created which doubled the number of clusters included in the consultants proposed scenario. The third alternate plan (Figure 14), contained approximately 3 times the amount of tree clusters as presented in the consultant's original plan.These 3 alternative replanting schemes provided SFWMD staff with a visual justification for requiring a greater number of tree clusters in the final restoration plan. The final plan required 8-10 tree clusters.
The ease of use and efficiency of these tools allows for rapid documentation of violations by environmental professionals. The GIS information provided has allowed managers to quickly assess, characterize and summarize the violation toward a negotiated solution. Furthermore, the rapid development of a comprehensive restoration plan in Case #1 was further facilitated by the utilization of these existing coverages and the creation of new restoration themes.
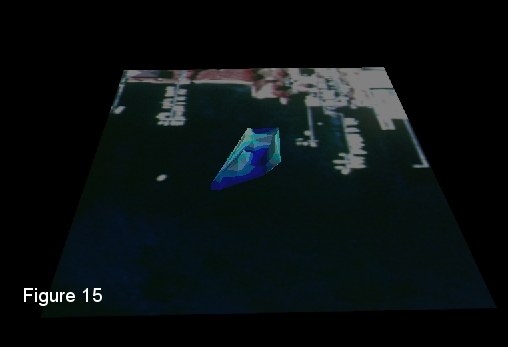
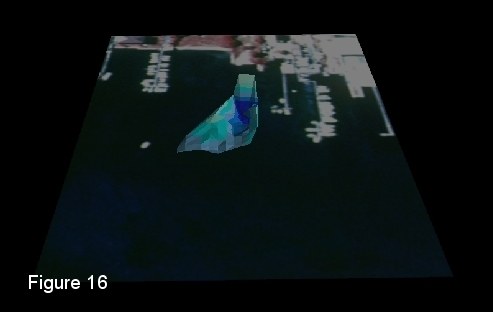
GPS technologies have led to a new level of accuracy in violation documentation. Estimates of wetland impacts can now be quantified in the field with handheld GPS units. As indicated above, the use of the handheld GeoExplorer allowed SFWMD staff to quickly and accurately quantify prop dredging impacts. Other cases where this technology has provided benefits include: estimating fill impacts from improper road construction adjacent to wetlands, ascertaining ownership of "violation" (determining ownership of property where violation occurred), and comparing permitted and as-built construction drawings with what has actually been constructed. In Case Study #2, the violator attempted to suggest that the impact to the seagrasses should be attributed to recreational boaters. However, utilizing Esri's ArcView 3D Analyst with bathymetric data (Figures 15 and 16) SFWMD staff were able to visualize the footprint of the actual corridor created by the violator's barge thereby dispelling attempts to shift the blame.
The importance of these techniques has resulted in a reduction in the number of settlement negotiation meetings between the violator and SFWMD (due to insufficient or poor documentation). This has improved the ability to justify higher penalties and costs while developing comprehensive restoration programs in enforcement cases and also helps in the tracking of violations (particularly for those violators who have a past history of non-compliance or enforcement activities).
The cases described above demonstrate how remote sensing and GIS can be used to accurately survey and quantify violations in South Florida. The first and last cases demonstrate how GIS technology can also aid the violator in providing mitigation or restoration plans toward resolution of a violation. Visual depiction of the restoration plan provides regulators with information needed to assess the long-term viability of a plan and anticipated success of any revegetation (replanting) plan. Quick resolution of a violation reduces daily penalties and associated cost amounts assessed to the violator. Therefore, development of a quick and comprehensive plan for restoration via GIS technology is in the best interest of the violator.
As GIS and Remote Sensing hardware and software continue to improve, government and private sector entities will continue to benefit from this technology. SFWMD staff now have the capability of bringing surveyed conservation easement boundaries via laptop computer, into the field with real-time GPS positioning and DOQQ layers, for quantitatively estimating landscape features. In the case of regulatory enforcement, the benefits we currently see are on a project by project basis. However, in the near future it is foreseeable that these projects will be reviewed and analyzed on a cumulative basis thereby giving new insight to planners and environmental managers. GIS technologies, such as ArcView IMS and ArcIMS, linked through the internet will allow the dissemination of this information throughout an organization or the population at large. It is hoped that this technology will allow us to foresee the cumulative impacts of our destructive practices, so that we will take the necessary steps to prevent them from occurring.
Special acknowledgement goes to John Meyer who was an integral part in the development of these cases.
1 Smith, 1990
2 Smith, 1990
3 Smith, 1990
4 Trimble, 1994
5 ERDAS, 1998
Smith, R.O., 1990. South Florida Water Management District Regulation Department Enforcement Manual, 82 p.
Trimble Inc., 1994. GeoExplorer Operation Manual, 1994, 5.5.7 Improving Positional Accuracy, Revision A, Part Number: 21281-00, April 1994, pp 5-17.
ERDAS, Inc., 1998. Using ArcView Image Analysis, ArcView Image Analysis, Enhanced Image Integration, Display, and Analysis, 1998. 216 p.
Stacy D. Myers, Senior Environmental Analyst
Environmental Resource Compliance Department
South Florida Water Management District
3301 Gun Club Road
West Palm Beach, Florida 33416
(561)682-6208
fax: (561)682-6896
smyers@sfwmd.gov
Michael Broker, Staff Geographer
Regulatory Information Management Department
South Florida Water Management District
3301 Gun Club Road
West Palm Beach, Florida 33416
(561)682-6936
fax: (561)682-6896
mbroker@sfwmd.gov
Robert M. Brown, Director
Environmental Resource Compliance Department
South Florida Water Management District
3301 Gun Club Road
West Palm Beach, Florida 33416
(561)682-6283
fax: (561)682-6896
rmbrown@sfwmd.gov
Rudy Smith, Sr. Regulatory Supervisor
Environmental Resource Compliance Department
South Florida Water Management District
3301 Gun Club Road
West Palm Beach, Florida 33416
(561)682-6599
fax: (561)682-6896
rsmith@sfwmd.gov