John K. Wildgen
High-Resolution Satellite Imagery and Census Geography
It is no secret,
especially to the former Soviet Union, that as Census 2000 approaches, TIGER is
not always up-to-date. To help understand where TIGER lags, the State of
Louisiana funded the acquistion of SPIN-2 1.56 meter pixel imagery of the New
Orleans-Baton Rouge-Slidell triangle. Imagery was acquired in March 1998, and
compared to TIGER 1997 in the summer of 1999. Comparisons with subsequent TIGER
releases continue apace.
There is no simple theory of geography accounting for the SPIN-TIGER
disparities, but this paper rounds up the "usual suspects" geographers rely upon
to explain mapping anomalies. Understanding them may make planning Census 2010
easier.
Statement of the Problem
Assume for the sake of argument that in round
figures every resident's monetary return to a state is about $1000 per year. One
thousand uncounted residents amounts to a million dollars annually. Multiplied a
few times, taken over a decade, and with the addition of compound interest we soon end up talking about what the late Senator Everett Dirksen called "real money." The Bureau of the
Census and most U.S. municipalities pondered this leakage in the count
throughout the 1990s. The outcome has been an aggressive deployment of
statistical and legal tools designed to plug the leak, which has largely been
seen as a problem of inadequate capture of urban linguistic and racial
minorities.
The financial logic applies to a state like Louisiana, but the facts do not,
since the state is not a target of immigration, nor is it a center of urban
growth. Rather, the state's census leakage is likely to come from suburban
sprawl that has outpaced geographical documentation. This raises obvious equity
issues since uncounted whites still affect the state's minority population. It
also raises the central topic of this paper, which addresses problems and
prospects in using cheaper and more rapidly deployed remote sensing data to
document and anticipate shifts in population distribution.
The Physical Setting
Much of urbanized Louisiana lies in the Mississippi
Alluvial Plain, an understated geomorphologists' term for flood zone. 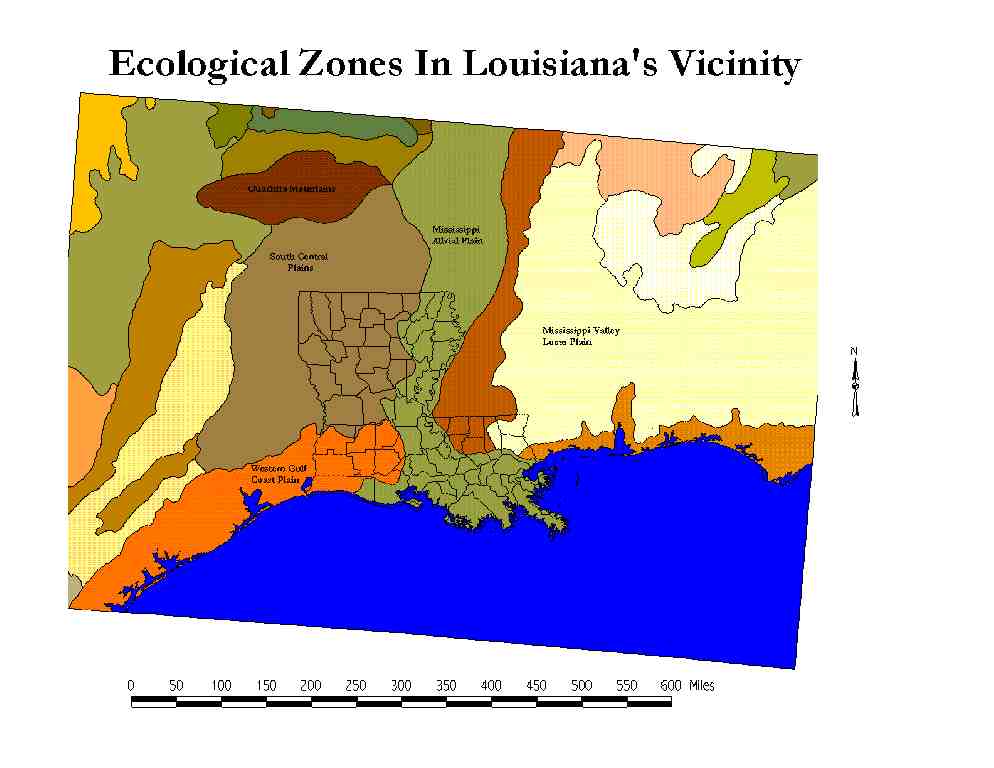 The cities of New
Orleans, Baton Rouge, and Slidell are located near the base of this plain, and
are close to a major estuary of the Gulf of Mexico called Lake Pontchartrain,
the ellipsoidal water body prominent in this part of the state.
The cities of New
Orleans, Baton Rouge, and Slidell are located near the base of this plain, and
are close to a major estuary of the Gulf of Mexico called Lake Pontchartrain,
the ellipsoidal water body prominent in this part of the state.  What this means,
as a practical matter, is that the state's major population concentration is
subject to spring river flooding and fall hurricane flooding. Long-term
residents of south Louisiana use the term "the big one" in a sense similar to
southern Californians' allusion to some cataclysmic seismic event.
What this means,
as a practical matter, is that the state's major population concentration is
subject to spring river flooding and fall hurricane flooding. Long-term
residents of south Louisiana use the term "the big one" in a sense similar to
southern Californians' allusion to some cataclysmic seismic event.
In Louisiana terms the "big one" is a catastrophic hurricane that would
breach the levees in New Orleans on both the Lake and River facing portions of
the city, and then march on towards Baton Rouge. One can visualize the effect in
the next map, which approximates sea level without the benefit of levees and
pumping systems, while it also greatly exaggerates landforms further north. 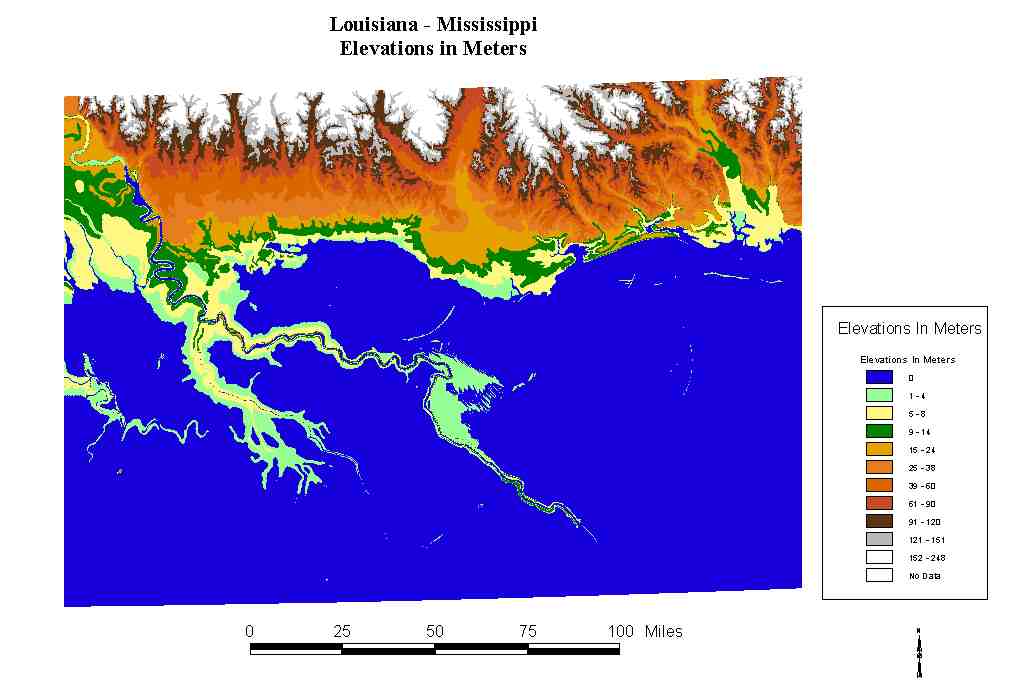 It
is easy to discern the meandering natural levee of the Mississippi, but all that
appears of New Orleans is a thin crescent of swamp on the south shore of Lake
Pontchartrain. In effect, this map models most of the residential areas of this
region as resting five to fifteen feet under water following a Category IV or V
hurricane. These are rare storms, but save for evacuation, they outstrip
foreseeable defensive measures.
It
is easy to discern the meandering natural levee of the Mississippi, but all that
appears of New Orleans is a thin crescent of swamp on the south shore of Lake
Pontchartrain. In effect, this map models most of the residential areas of this
region as resting five to fifteen feet under water following a Category IV or V
hurricane. These are rare storms, but save for evacuation, they outstrip
foreseeable defensive measures.
Demographic Changes
Despite the fact that this area is in the heart of
an "ecology of disaster" -- a term urbanologist Mike Davis invented for Los
Angles -- the demographic shifts around New Orleans have not been guided by
principles of physical geography. Rather, for the past half century, the
perimeter of the levee system has expanded and elevated. Moreover, local
governments have added more pumping capacity.
The resulting population density pattern defies conventional analysis (Reid, 1997),
however, because of the complications added by racial considerations. The Parish
of Orleans, coterminous with the city, is estimated (2000) to be about 65% to
70% black, while Jefferson Parish, to the west, is, possibly, 20% black. Since
Jefferson Parish grew as a dormitory suburb from the 1950s on, it is tempting to
attribute its development to white flight. But the argument is made more
complicated by the fact that since the 1980s the most dramatic growth in the
region has taken place far to the north in St. Tammany Parish, as the following
map illustrates. 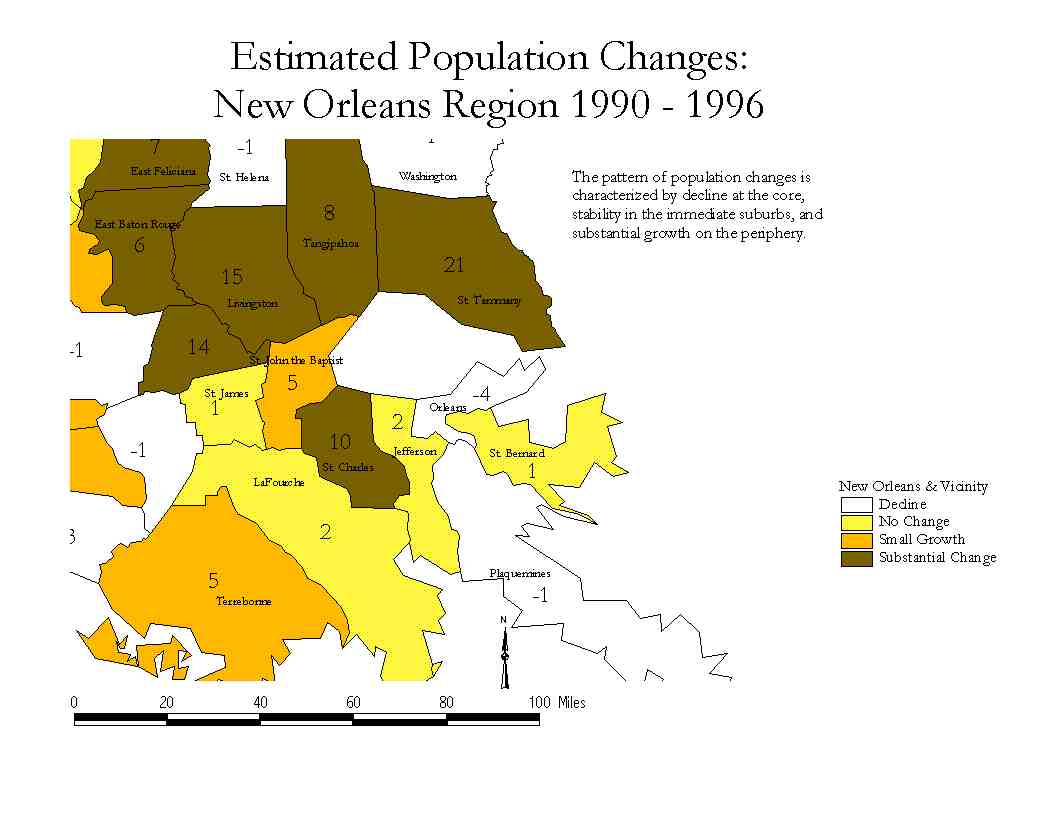
This area has made the urbanologists' term "sprawl" clearly pejorative, even
though the term's connotation is debatable on a nationwide plane (Meyers and
Kitsuse, 1999, Wells Fargo Bank, 1996).
This parish is too far away from New Orleans (50 miles) to fall into the
"white flight" category. It is best characterized as a "squirearchy", more driven by class considerations than by racial issues. Yet New
Orleans developers and politicians, less loudly, denounce St. Tammany's rapid
expansion because it saps both a market and a tax base. There is plenty of room
in New Orleans for housing. Depopulation of the city has left it with about
thirty thousand empty, and often decrepit, dwelling units. Developers are eager
to restore and fill these potential homes. But their eagerness is not matched by
City officials, who have to wonder about the political impact of a substantial
middle-class migration back to the urban core.
At the same time St. Tammany Parish residents denounce sprawl too, and use
minimum lot sizes and various impact fees to keep entry-level housing out of
much of the parish. This has the odd effect of keeping elected officials on both
sides of Lake Pontchartrain at peace. St. Tammany keeps its revenues, while New
Orleans is immune from the country squire values of exurbanites. But there is no
end in sight for frustrated developers who cannot build "affordable" housing" in
St. Tammany, nor easily market gentrified townhouses in the urban core.
The same pattern is found at the other end of the Pontchartrain Basin. Baton
Rouge is another urban core that has spread laterally. In its case Livingston
Parish, to the east, has become a parallel to the Jefferson Parish dormitory
community. Farther to the east lies Tangipahoa Parish, which like St. Tammany,
has developed a tendency to define sprawl as the next family planning to move
in. In the case of both sets of urban cores and satellite parishes, there are
crosscutting problems and paradoxes associated with development and population
dispersion. Politicians put up with sprawl because they can trade lost revenues
for homogeneous, hence predictable, electorates. Developers are frustrated
because neither market nor regulatory mechanisms favor profitable housing models
based on high density and tax relief in the form of federally financed housing
salvage programs.
Tracking Development With Imagery
The logic of physical geography and
the paradoxes of local politics have created a common interest in getting a
command of demography in this region. For any kind of community in this region,
urban, dormitory, or squirearchy, there is a common interest in maximizing the
population count because the most important color in politics is green.
Making the Census effective through, so to speak, the front door with GIS and
companion planning tools has not been a Louisiana priority for most of the
1990s. There is nothing unique or peculiar about this pattern. It merely
reflects the uneven and competing technical priorities inevitable in local
governments.
The background of this should be clear from the problems of physical
geography referred to above. Localities south of Lake Pontchartrain are
preoccupied with urban drainage problems, while north of the Lake streams and
forests were a priority. GIS expertise in the area was largely restricted to
questions of either hydrology or gerrymandering. It was only in the late 1990s
that a regional GIS community became self-conscious, due in part to Census 2000
and the possibility of losing yet another congressional seat.
But technical issues played an important role in increasing geographical
awareness. Inexpensive computing, the transition from tape to CD data storage,
TIGER, USGS digital files, internet servers, and much improved software were
among the most obvious elements in a geographical revolution.
One obvious and persisting problem is updating maps. At mid-decade LORAN and
LANDSAT were being eclipsed by newer tools, but SPOT and positionally degraded
GPS were not suitable for urban planning roles at the block or parcel level. The
standard of resolution we thought necessary for census work was about six feet,
or two meters - enough to resolve an SUV in a driveway. Vehicles in driveways
make a presumptive case for the existence of human habitation. At the end of the
decade the failure of IKONOS to deploy was a major disappointment. In Louisiana
there were hopes, as early as 1998, to exploit its potential to audit new
versions of the TIGER files prior to the 2000 census.
The fallback position was to turn to product from SPIN-2, a Russian
panchromatic instrument designed as an intelligence-gathering tool. Its
resolution is a nominal 1.57 meters, and there was leaf-off and cloud-free 1998
imagery of the Pontchartrain Basin in Russian archives. So, there were adequate
resolution data available for the study area from a suitable epoch.
The main technique for exploiting the data is simple in concept: overlay the
imagery with TIGER line files as in this rendition of an area near the town of
Mandeville, Louisiana. The idea is to look for neighborhoods the KGB (or its
successor) knows about that do not show up in TIGER. 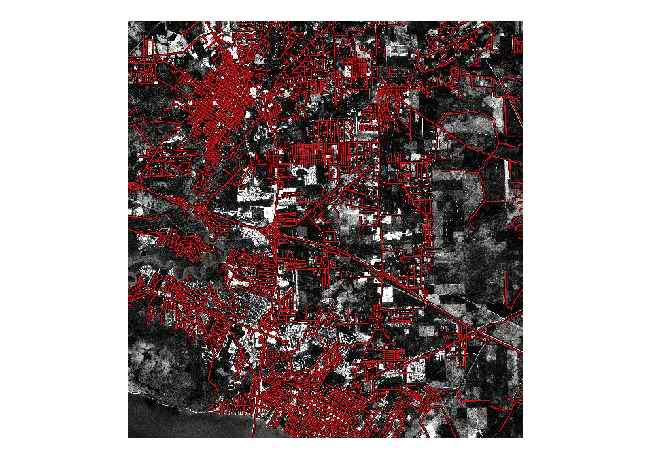
This rendition of the image
does not convey fairly what can be seen at higher resolutions. But it should be
apparent that TIGER (1997) misses some inhabited areas.
There are some complications and opportunities along this route. In one sense
we were just lucky to have suitable Russian data. SPIN satellites have a short
orbital life and it is not always the case that a Louisiana March will be
cloud-free. We never determined the spectral window SPIN uses, but it, sensibly,
is more sensitive to developed land than to swamps and the undifferentiated
coniferous forests of Louisiana. Roadways and excavations are fairly easy to
detect.
Georeferencing the imagery presented some options. Planning GIS practitioners
in the Pontchartrain Basin have informally settled on Louisiana State Plane
NAD83 in feet as a common coordinate system. But the State uses UTM-15 for its
crucial oil-spill response map, even though the most critical area falls in UTM
zone 16. In this case we adopted a political standard. Most local officials are
familiar with paper USGS 7.5' maps and they recognize DRG versions of these
maps. This meant referencing most of the data to UTM-15 and NAD-27. Some images
were referenced to UTM-16 and NAD-27. The principle here is that the first rule
of public cartography is to make the map familiar to the audience. In this case
it was important to bend Russian images to U.S. maps.
SPIN images do not follow LANDSAT rules, in the sense that there is no
apparent pattern to the image footprint. This is, at least in part, due to the
lower orbit SPIN employs. Normally this would not be of interest, but over an
area this large it means that mosaicking becomes crucially important, since we
are trying to yoke a Russian spy satellite to U.S. Census wagon. We found that
IMAGINE's mosaicking tools, and its capability to define areas of interest (AOI)
in terms of ArcInfo polygon coverages (such as municipalities) to be very
helpful.
Another piece of luck we had lay in SPIN's degraded resolution by comparison
to IKONOS. No matter how fast one's computers are, it is still going to take
more time digest 1 meter pixels than 1.57 meter pixels. For this kind of task,
auditing vector files at the scale of a road, SPIN's resolution is not an
apparent limitation that outweighs its reduced storage and processing
requirements.
Current Directions
The most pressing technical issue still far from
resolution is how to turn the SPIN-TIGER sandwich into theoretical and
predictive advantage. Gravity models and central place theory are powerful
tools, but it is not trivial to incorporate major surface discontinuities into
these approaches. Some of the approaches we are experimenting with are GRID
based, just to give us another look at the vector-image sandwich we find so
generally useful. 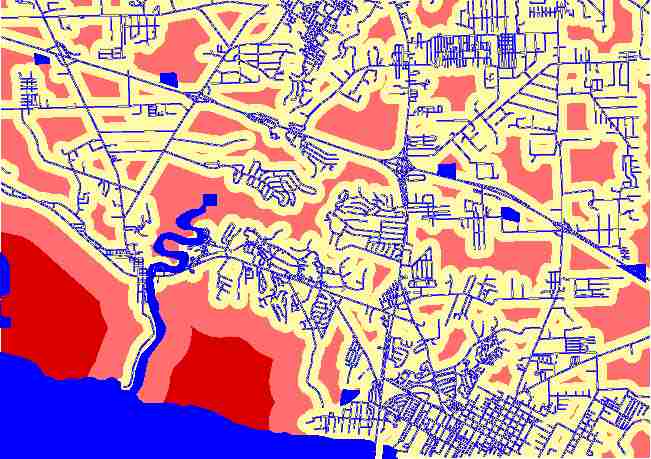
The GRID rendition, a bit Mondrianesque, yields isolated (from
TIGER) polygons. These are, presumably, unpopulated islands. We are attempting
to model their characteristics in two ways. The first is in terms of sheer size
as a function of distance decay from some point. Arc's SPATIAL ORDER tool for
constructing Peano curves of the polygon centroids may helpful here. The second
is in terms of settlement intrusion on these polygons as portrayed by early
editions of TIGER, Russian imagery, and by later editions of TIGER. This means
working out an agenda over a fairly extensive area (in terms of 1.57 meter
pixels) using vector GIS, remote-sensing tools, spatial analysis tools, and
time-series analysis. Only the goal is clear. If it is possible to infer rules
for urban growth missed by the Census it will be possible to improve its aim.
Acknowledgements and References
The Louisiana Technology Innovations
Fund generously provided funds for this research. The opinions expressed here
are, however, the responsibility of the author.
References
Meyers, Dowell and Alicia Kitsuse. 1999. "The Debate Over Future Density of
Development: An Interpretive Review." Lincoln Institute of Land Policy Working
Paper.
Ewing, Reid. 1997. "Is Los Angles-Style Sprawl Desirable?" Journal of the
American Planning Association. Vol. 63: 95-105.
Wells Fargo Bank. 1996. Preserving the American Dream: The Truth About
Suburban Communities and Housing Choice. San Francisco: Wells Fargo Bank.