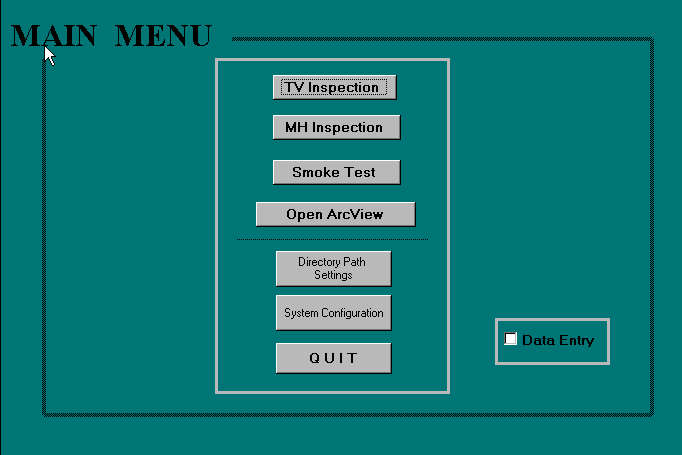
Figure 1: SSES Database Interface Main Menu
GIS-Based Sanitary Sewer Evaluation
Survey
Halfawy, Mahmoud Rashad, Ph.D.
Pyzoha, David, P.E.
Young, Randall, M.A.
Abdel-Latif, Mohamed, Ph.D., P.E.
Miller, Robert, BSCE
Windham, Lori
Wiegand, Richard
ABSTRACT
EMH&T is a consulting engineering firm that provides a full range
of civil engineering services including utility system design, bridge and
highway design, residential planning, and commercial development. This
paper describes work performed to develop a GIS to support Sanitary Sewer
Evaluation Survey (SSES) studies. An SSES study aims at identifying infiltration
and inflow (I/I) sources in a sanitary sewer system to plan and develop
cost-effective system rehabilitation and maintenance activities. EMH&T
worked in partnership with the City of Columbus and with a sub-contractor,
Specialty Sewer Services, Inc., to design and implement an ArcView®-based
GIS to provide City engineers with the capability to access, query, and
manipulate the data stored in the SSES database. The system also provides
tools to easily generate SSES reports and to interactively visualize the
spatial characteristics of the sewer system based on the SSES data.
1. Introduction
This paper describes a specific project case history for the development of a GIS for use in a Sewer System Evaluation Survey (SSES). The SSES was performed for the Department of Utilities, Division of Sewer and Drains (DOSD) in Columbus, OH, in the period from August 1997 to December 1999. This paper discusses the process for how the SSES GIS evolved, not as a specific scope of services requirement, but as a management decision toward making more intuitive and effective design decisions. Armed with a GIS, the Project Team could better assist DOSD improve its aging infrastructure and meet environmental regulations for operation of municipal sanitary and storm sewer systems, specifically elimination of engineered Sanitary Sewer Overflows (SSOs) and mitigation of the potential for Water-In-Basement events (WIBs).
The lead consultant for the project was Evans, Mechwart, Hambleton & Tilton, Inc. (EMH&T) Consulting Engineers, Gahanna, OH. EMH&T offers a full range of civil and environmental engineering services to regional clients in Ohio, Indiana, Kentucky, and West Virginina. Other members of the EMH&T Project Team are noted in the Acknowledgments section of this paper. However, for purposes of the GIS development, Specialty Sewer Services, Inc., a Pitometer Company, Hazelwood, Missouri, was instrumental in the design and development of the attribute database that allowed EMH&T to create the mapping link to fully implement the GIS for the project.
At the onset of this project, the City of Columbus through its long
term planning developed a goal of establishing a regional GIS system. Standardization
of database and mapping information would revolve around ArcView®,
ArcInfo®, and ORACLE® compatible software. The citywide GIS was
not available for use in the SSES but information developed as part of
the SSES project was required to be provided in a format to meet the standardization
objectives of the future GIS program. An SSES project lends itself extremely
well to the benefits of a GIS and the content of this paper attempts to
discuss the power and flexibility that GIS adds to data management, retrieval,
and analysis.
2. Project Description
Typical of most large mid-western cities, Columbus' sewer system is an intricate patchwork of storm sewers, sanitary sewers, and combined sewers. Many segments of the systems show the effects of urbanization and the wear and tear of age that reduce the capacity of sewers to convey both dry and wet weather flows. The specific project area exemplifies the kind of complexities engineers encounter as they design changes to existing sewer systems in developed areas. Located in north-central Columbus, the study area (a.k.a. Maize Road/Morse Road Area) comprises 27 square miles of predominantly residential neighborhoods bounded to the north by a major business corridor. Most of the sanitary sewers within the study area were constructed after 1930, with the majority being built between 1940 and 1960. WIB problems from both storm and sanitary sewer system backups have been a long term chronic concern in this area. Attempts including relief sewers and the construction of 22 SSOs have been implemented to quell the surcharging problems. The first major sanitary sewer improvement project occurred in 1950 to address sewer surcharging. This project involved the construction of a relief sewer and 22 sanitary to storm overflow relief connections into the relief system. As development continued and the sanitary sewer system began to age, the rate of Infiltration/Inflow (I/I) in the system was further reducing the capacity of the sewers resulting in more surcharging and reported WIB problems. A subtrunk sewer was constructed in 1979 in another effort to reduce these problems. Twenty years later CIP 850 seeks to reduce these problems with the added requirements of meeting federal environmental regulatory programs.
The mainline sewer system consists of primarily brick manholes (94%)
and vitrified clay pipe (91%), both of which exhibit varying degrees of
structural deterioration due to age and original construction practices
and materials. Approximately, 80% or 213,893 feet of the mainline sewers
are 8-inches or less in diameter and range in depth from 8 to 12 feet.
The other major component of the collection system is service laterals.
An inventory of the services was not conducted as part of this study, but
the total length of service laterals is typically equal to or greater than
that of the mainline sewer system which totals 267,162 feet.
City engineers employ several techniques to survey and evaluate sewer
systems in order to identify various deficiencies in the system and to
plan and perform maintenance and improvement work. These techniques are
collectively known as a Sanitary Sewer Evaluation Survey, or SSES. To gain
a more intuitive understanding of the sanitary sewer system in the study
area, the DOSD commissioned the SSES project as Phase 4 of a multi-phased
effort to address both storm and sanitary issues in the study area. The
primary goals of the SSES project were to:
3. SSES GIS Scope and Objective
SSES projects typically involve an enormous amount of data with complex relationships. City engineers use this data to make decisions related to sewer system maintenance and improvement. Effective presentation and visualization of the spatial characteristics of a sewer system is a key factor to provide engineers with more understanding and insight into such data. GIS provides an ideal tool to explore, analyze, and visualize the characteristics of the sewer system based on SSES studies. The potential of GISs to support and improve the decision-making process in SSES projects is very well recognized.
The database for the GIS was developed based on the SSES field testing and inspection results of the sewer system in the study area. However, the software was implemented to provide a set of generic tools and functions that could support other SSES projects as well. The main objectives of the SSES GIS can be summarized as follows:
The SSES GIS was developed in four main stages:
The study area digital mapping and the development of the collection
system inventory were key objectives in this project. The software used
to store and manipulate this enormous data included MS-Access®, ArcView®,
and a collection of data in a variety of formats. These other data formats
included database tables, AutoCAD® drawings, shape files, ArcInfo coverages,
and JPEG images. Data manipulation was necessary to merge the data into
a seamless and cohesive system. It is understandable there was linkage
problems, primarily nomenclature and spatial assignment.
It should be noted that the project was first and foremost an engineering
analysis undertaken to address sewer system design issues, not specifically
a GIS project. It must also be mentioned that in practice GIS utilization
was more theory than fact at the time this project was instituted. At the
outset of this project, there was no stated objective to create a GIS and
developing a GIS was not included in the original scope of the project.
The initial goal was limited to the development of a database system to
enable the management and manipulation of the SSES data. As the project
progressed, the forethought of the EMH&T Project Team recognized that
a GIS would be vital in managing and analyzing SSES data and in visualizing
and analyzing the spatial characteristics of the sewer system. . It was
also recognized that a GIS would provide speed and accuracy for preparation
of graphical displays of the SSES data, report queries, as well as portraying
hydraulic model results. The awareness that GIS could provide project engineers
the benefit of visualizing the system holistically rather than as individual
pipe and manhole segments was recognized as a benefit. This was the catalyst
for the Project Team to make the decision that a GIS could enhance how
the Project Team addressed the objectives of DOSD for the study area.
4. SSES Data Collection
SSES is a comprehensive and systematic process aimed at identifying and investigating sanitary sewer system problems (e.g. I/I sources, structural deficiencies) and developing maintenance and rehabilitation methods to solve these problems. During the survey, the sewer system is thoroughly inspected and data about the conditions of various system components are collected. The main field investigative procedures performed in this project included:
Manhole Inspection:
Manhole Inspection aims to evaluate the condition of the manhole structure
and its component parts: cover, frame, corbel, walls, base, and connecting
conduits. The inspectors look for deterioration and evidence of structural
cracks or openings that allow I/I to enter the manhole. The manhole location
was evaluated considering the potential for runoff to enter through the
manhole cover and frame (e.g. does the manhole sit in a depressed area
where water ponds over the cover). A detailed inspection record was prepared
including color photographs showing the manhole, the surrounding area,
and views within the connecting conduits. The data recorded during manhole
inspection included manhole cover type, type of frame, manhole depth, type
of construction used for manhole walls, and an assessment of problems and
repairs needed. Color photographs were taken at each manhole, showing the
manhole, its' surrounding area, and views within the connecting conduits
(i.e. lamping).
Smoke Testing:
Smoke Testing is a broad-spectrum procedure that aims to identify sections
of sewer lines and potential sources where excessive I/I can enter the
sanitary sewer system. In this test, the sanitary mains are injected with
non-toxic smoke. Smoke that escapes from the pipes and emerges above the
ground points to locations where inflow and infiltration (I/I) can enter
the system. The data recorded during smoke testing was primarily locational
(for example smoke around a manhole). Photos were taken where smoke was
observed. The presence of smoke indicates a source for water to enter the
sanitary sewer system.
Closed Circuit Television (CCTV) Inspection:
CCTV inspection was used to verify potential I/I sources and to investigate
the condition of the sewers. The pan-and-tilt cameras used allowed for
close inspection of service connections and joint problems. The data recorded
during CCTV inspection was video footage generated as the camera rolled
through sewer mains. For each TV-inspected pipe, still frames were captured
as JPEG images. Sewer lines are usually cleaned in order to view and record
the internal conditions of the lines.
Dyed Water Testing:
Dyed Water Testing is a verification test of potential I/I sources
identified through manhole inspection, smoke testing, or CCTV inspections.
Potential I/I sources are tested using dyed water flooding (i.e. where
the leak is suspected) and then tracing for its presence in the sanitary
sewer. Dyed water flooding was performed with TV inspection to verify locations
of I/I.
5. Database Development
Past experience of the Project Team in performing SSES work since the early 1970's dictated that a proper data management plan be established at the beginning of the project to allow technicians and project engineers to review and control all data collected during the field investigations listed above. Moderate to larger scale SSES projects are capable of generating data at a rate that can quickly overwhelm even the most experienced project manager. The ability to rapidly input data, to conduct ongoing quality assurance checks, and to publish final forms, tables and reports from a single set of data and a single program was the prime driving force in development of the SSES database.
Field investigation has produced an enormous amount of data that can only be managed efficiently using a database system. The SSES data has been represented using a relational model. Approximately, 70 MB of data has been stored as a collection of tables (or relations), where each table contains a set of records. The SSES database was developed using MS-Access® Relational Database Management System (RDBMS).
Two primary keys are employed within the database to link the numerous
tables and queries associated with Manhole and TV inspection work:
MH ID - a unique number assigned to each manhole structure during
initial data entry;
Line ID - a unique number assigned to each main line and lateral connected
to a manhole structure.
The assignment of the identifiers generated an early coordination effort
for the Project Team. The final product needed to have the key identifiers
to be the assigned manhole and pipe segment numbers created by the DOSD
system of identification. There needed to be a link created between the
database assigned identifier and the City numbering system.
Links to digital photo files are maintained by automatic "update queries"
in the database and photo files are assigned proper names either on the
local hard drive, CD, or server being employed for file storage. CAD drawings
of manholes (corbel/frame cross-section and plan view drawings) are stored
directly in the database for viewing or report generation purposes. Smoke
test drawings are generated directly from the map of the sewer system,
including a "smoke leak" layer, and are copied directly into the database.
The ability to manage, manipulate and correlate a 70 MB database, which expands to a 500 MB file when nearly 7,600 digital photos, reports, and other images are included would be virtually impossible without the use of a database management system. In addition, the open architecture and design of the database allowed the SSES information to be readily referenced, queried, updated and manipulated as the larger GIS project began to be undertaken.
The SSES database enables users to query and view data in three categories: 1) Manhole inspection; 2) TV inspection; and 3) Smoke testing. Figure 1 shows the main database interface form. Using pre-defined queries and reports, users can quickly and easily create and print SSES reports for many topics. The user can navigate through the SSES data using various queries and forms implemented within the database environment. The following list represents a sample of the reports available from the SSES database:
Reports based on general inspections:
Reports based on TV-inspections:
Figure 1: SSES Database Interface Main Menu
The SSES database Main Menu contains seven buttons. The top three buttons
open database forms for TV inspection, manhole inspection, and smoke testing
results; the fourth button opens ArcView® to start the GIS interface;
and the bottom buttons are for changing the system configuration and ending
the session.
TV Inspection Data
The TV Inspection Data button opens the TV Inspections form (Figure
2). This form lists TV-inspected mains and provides a gateway to reports,
information, and images of the main.
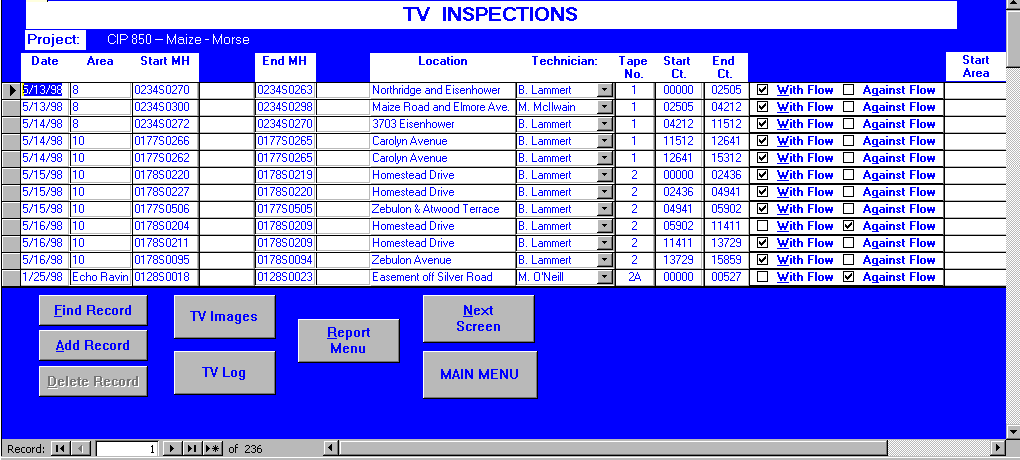
Figure 2: Database Interface Form For TV Inspection Data
For the mains listed on this form, the user can view images taken during TV inspection, or see a written log of the inspection. To display either, the user selects a record of interest by clicking the gray box to the left of the record, and then clicking the appropriate button: [TV Images] or [TV Log]. With the [Find Record] button, the user can search for mains by upstream or downstream manhole number.
The [Report Menu] button opens the TV Reports form, which provides a
menu of choices for generating reports based on TV inspections. Clicking
either button labeled 'By Area' will prompt the user to enter the sub-basin
of interest. After entering the sub-basin, the user is prompted to enter
an optional table name. The system will then generate a pre-formatted report.
Manhole Inspection Data
Clicking the [MH Inspection Data] button on the Main Menu opens the
Manhole Inspections form (Figure 3). This form lists sanitary manholes
within the study area, and serves as gateway to reports, information, and
images of the manholes. To view information about a manhole, the user selects
a manhole from the list by clicking the gray box to the left of the record.
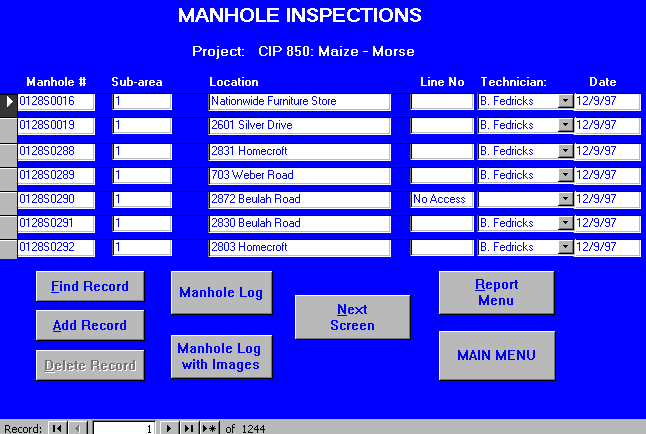
Figure 3: Database Interface Form For Manhole Inspection Data
Once a record is selected, the user can display the manhole's data in
3 different formats:
The [Manhole Log] button presents the manhole's data as a pre-formatted
report.
The [Manhole Log with Images] button presents the same report, with
the addition of images of the manhole taken during manhole inspection.
The [Next Screen] button opens the first of a series of screen forms.
Each form presents information about a particular part of the manhole:
cover, frame and risers, corbel and wall; as well as leakage data.
Smoke Test Data
The [Smoke Test Data] button on the Main Menu opens the Smoke Test
Query form (Figure 4). Here the user defines a query by setting three search
criteria: area, test result, domain. Any combination of categories can
be selected (including none). If no criteria are specified, all smoke-test
records in all areas will be returned when the query executes. As an example,
to list all smoke-test locations in area 4: choose '4' in the AREA category
and leave TEST RESULT and DOMAIN blank. Once the criteria are set, the
query can be executed by clicking [Find Matching Records].
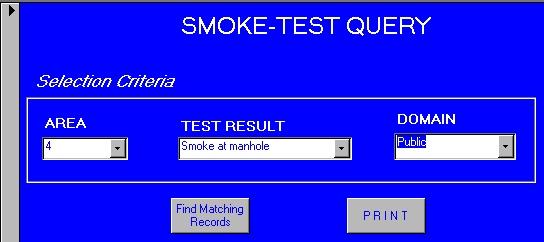
Figure 4: Database Interface Form For Smoke Testing Data
The Query Results form (Figure 5) displays all records matching the
specified search criteria. The user can select a record from the list,
and view detailed data for that record by clicking the [Smoke Details]
button. The [Preview Smoke Report] button displays information for the
smoke-test location on a pre-formatted page.
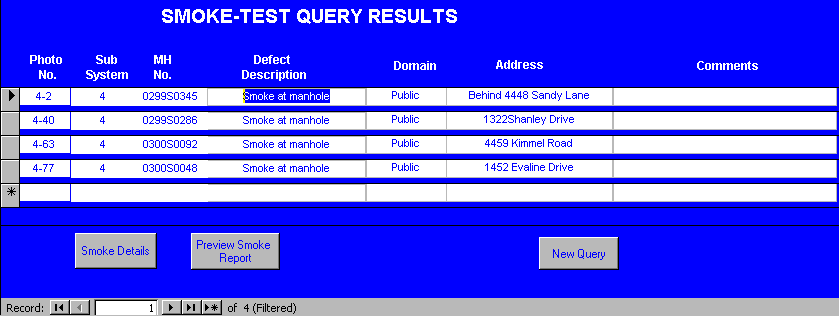
Figure 5: Smoke Testing Query Results
6. Map Production
Map production is generally the most time-consuming task of GIS projects. This task involves defining map layers (or themes) and features, and specifying the spatial relationships among various features. The cornerstone of the digital mapping effort in this project was the base-maps developed by the Franklin County Auditor's Office. Those maps are available from Franklin County Auditor's Office in DXF format, and that format was used since AutoCAD is a well-utilized tool at DOSD. The Franklin County Auditor's maps are ortho-corrected, and use the state plane coordinate system (Ohio South Zone). A specific task of Phase 4 of the project was the completion of digital maps of the sewer system (the existing base-maps within the study area had not been fully digitized) and inclusion of specific attribute layers. EMH&T had been involved in this effort in other parts of the City so this was a natural task for inclusion in this study.
The major tasks were to add sewer lines and structures to the Auditor's base map, and to capture attribute information for those features. Two primary sources of information were used to collect the coordinates and attributes of sewer system features: the City's record plan drawings, and the City's Hansen IMS® database. To map the sewer system, the basic approach was to scan the record plans for all sewers in the study area; geo-register the scanned image with the base-map; and then use AutoCAD tools to draw the sewer system features such as manholes and sewer lines. The match between record plan and the base map was generally very good. Survey information and offsets shown on the record plans were used for accurate positioning. Field surveys were conducted on strategic manholes to enhance mapping accuracy.
AutoCAD "blocks" were employed to represent map features such as manholes, line segments and smoke leaks, with specific attribute assignments for subsequent joining and linking purposes with the SSES database records. Features data are represented as blocks attributes. Each block holds a unique identification number of the feature it represents as a tag. Blocks representing the same feature are drawn on the same AutoCAD layer, which is used to represent a map theme in the GIS interface. Attribute assignments for manholes and smoke leaks were fairly straightforward; however, since AutoCAD lines have no attributes, an additional symbol was placed over each line containing the "Line ID." By joining the "table of lines" and the "table of attributes" in each "View", a unique link could be established between a specific map feature and its corresponding database record.
The sewershed in the study area was subdivided into seven sub-sewersheds. A separate map was produced for each sub-sewershed. The following map themes (or layers) are presented for each sub-sewershed view:
Sewer attributes were also recorded from the record plan drawings.
The key information gleaned from the plans included pipe length, diameter,
slope, invert depths, offsets, material, and year built. Data for those
fields was entered into Hansen's Infrastructure Management System, which
uses ORACLE® as the underlying relational database management system.
That was important, because the City was beginning to create an enterprise
GIS, and wanted to ensure that information collected during this study
could be incorporated into the ORACLE®-based enterprise GIS. The unique
identifier assigned to each pipe segment and manhole was an important detail
related to the database. The City uses a naming scheme whereby manholes
are identified by a 9-digit alpha-numeric 'name', and pipe segments are
named by the upstream and downstream manholes. The same convention was
used while populating the IMS database.
7. SSES GIS Interface Design
The GIS interface is used to present the SSES data in its spatial context and to present the spatial relationships among various map features. The GIS interface was developed using ArcView® and Avenue® programming language. The main function of the GIS interface is to enable the user to visualize the sewer system characteristics on the map and to query the system. The GIS interface allows users to point at map features (e.g. manholes or sewer lines) and retrieve SSES information from the database. It also allows users to run a set of pre-defined queries or build their own queries and to display query results or reports.
A useful feature of the GIS interface is to present and analyze the spatial relationships among map features. Examples of these relationships include adjacency (i.e. manholes in a specific area), connectivity (e.g. sewer lines connected to specific manholes), and containment (e.g. manholes or sewer lines contained in a specific area). An important function of the GIS interface is to produce graphics on the screen or on paper that convey the results of analysis to engineers who make decisions about maintenance and improvement work. Graphical representation of the sewer system characteristics (e.g. I/I sources) can be generated, and thus allowing system users to visualize and understand the SSES data and the analysis of potential events.
Each sub-sewershed is represented as a separate view. Each view contains a number of map themes that the user can choose to display or hide. A sub-sewershed view contains themes for the base map, manholes, sanitary sewer lines, storm sewer lines, street names, right of way, positive smoke testing results, and TV inspected lines, among others. The map interface retains all the standard functionality provided by ArcView. In addition, customized tools provide quick access to key information like manhole depth, images of manholes and sewer lines, inspection reports, and links to orthophotos.
The GIS interface communicates with the SSES database via the Open Database Connectivity (ODBC) standard. An important step during system configuration is to create an ODBC connection to enable communication between the SSES database and the ArcView project. The use of the ODBC standard enables databases developed using other ODBC-compliant RDBMSs to be incorporated into the system in the future.
The GIS interface serves as the link between the SSES database and the project area maps. Early versions of the GIS were designed to permit the constant, ongoing editing of SSES database and AutoCAD map files that is necessary during data collection and review procedures. Design of the ArcView Views, collection of field data, review and processing of field data, and quality control checks all occurred simultaneously, thereby limiting the ability to plan each step in advance. The design of the initial GIS interface was based on using the SSES database and AutoCAD mapping procedures already in place for non-GIS related work on SSES projects.
This GIS interface can be invoked either from the database interface
main menu or by loading the SSES project into ArcView. The project provides
ArcView's standard capabilities, and adds customized buttons to help the
user find and display maps and information. Figure 6 shows the starting
screen of the GIS interface. This view shows an overview map of the entire
study area and its sub-sewershed. Buttons to the right provide access to
detailed maps of each sub-sewershed. For example, clicking the [Area 4]
button opens a more detailed map of sub-sewershed 4 (Figure 7). To view
another sub-sewershed, click [Go to Main Map] to get back to the overview
map, then click the button for the area of interest.
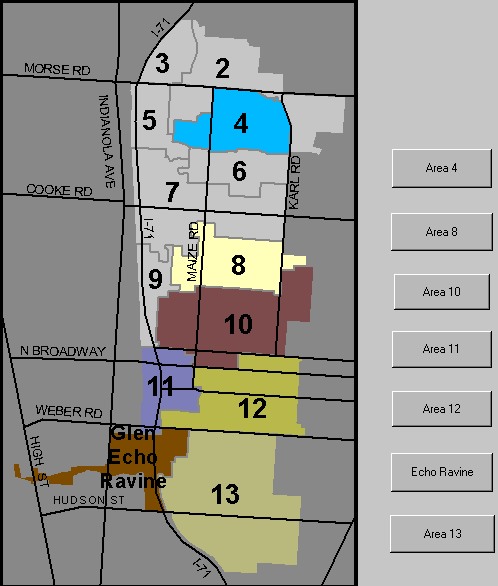
Figure 6: Overview Map of the Study Area With Buttons to Access Sub-Sewersheds
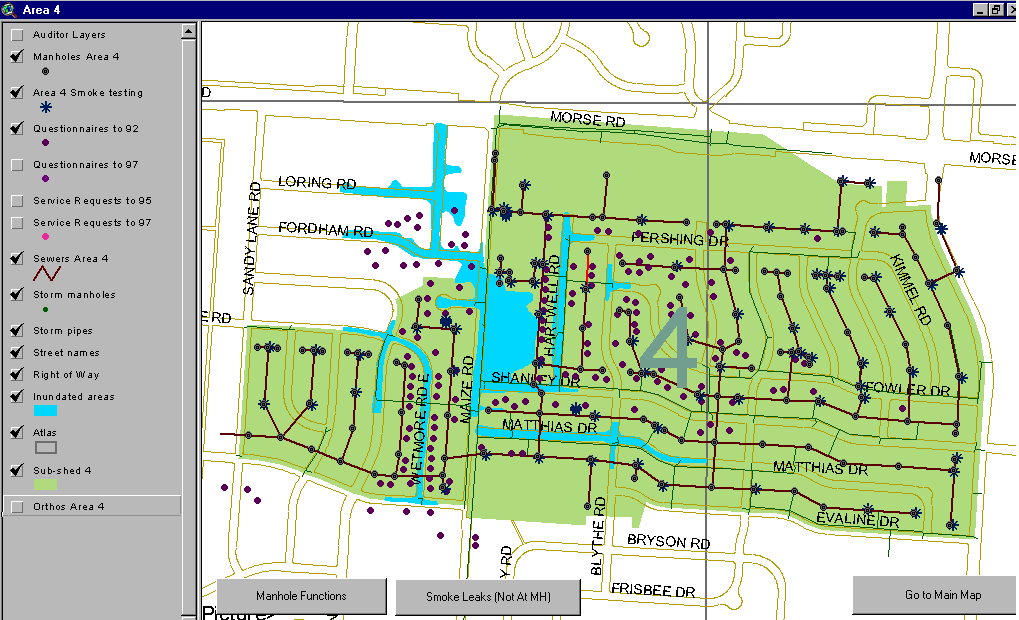
Figure 7: Detailed Map of a Sub-Sewershed
8. GIS Functions
ArcView provides an array of tools for displaying, querying, and analyzing maps and databases. Many of those tools will be useful while exploring the SSES maps and data. Although a discussion of ArcView's capabilities are beyond the scope of this document; ArcView includes thorough documentation in its [Help] pull-down menu. Here we limit the discussion to customized functions we added to facilitate user access to SSES database and GIS functions. These functions are described below. It is worth noting that these functions can be accessed either using buttons on the toolbar or through the pull-down menu.
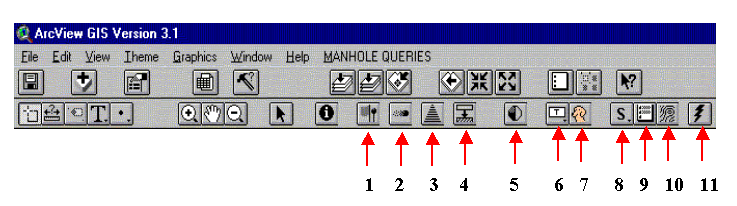
Figure 8: Custom Buttons on ArcView Toolbar
Function 1: Find manholes by street name.
Clicking this button opens a dialog box (Figure 9) that prompts the
user to enter a street name within the study area. When a user types a
street name and clicks [Show Manholes], Arcview â finds and highlights
manholes on that street.
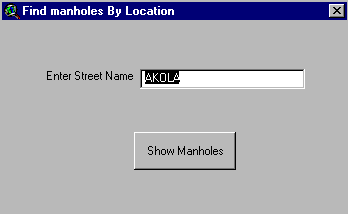
Figure 9: Find Manhole By Street Name Query
Function 2: Display manholes by cover inflow.
This button displays manholes according to cover inflow. After clicking
this button, a dialog box opens (Figure 10), where the user selects a general
level of inflow (from no inflow to high inflow). When [Display Results]
is selected, the SSES database is searched; the results are displayed in
a text box; and ArcView displays the manholes in red.
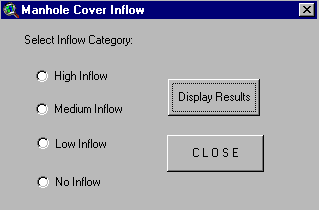
Figure 10: Manhole Cover Inflow Query
Function 3: Find manholes by depth.
This button displays manholes by categories of depth. The dialog box
(Figure 11) that opens presents 3 categories from which the user may choose.
To find all manholes in one of the depth categories, select the category
and then click [Display Results]. ArcView will color the selected manholes
red.
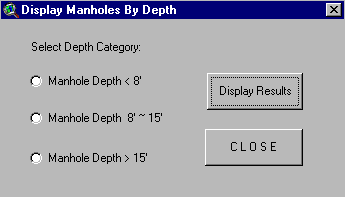
Figure 11: Display Manholes By Depth
Function 4: List manhole covers by type.
This button counts the number of manhole covers of a given type, and
lists the number counted in each sub-sewershed. The user is presented a
list of cover types from which to choose (Figure 12). After making a selection,
clicking [Display Results] submits the query. ArcView then generates
a report listing the count within each sub-shed (Figure 13).
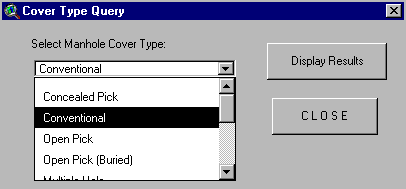
Figure 12: Manhole Cover Type Query
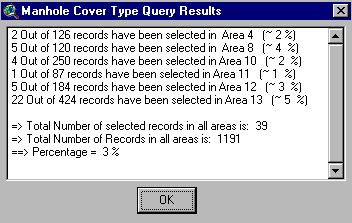
Figure 13: A List of Manhole Cover Type Query Results
Function 5: Manhole inspection reports/photos.
This button opens the Manhole Utility dialog box (Figure 14), a tool
for locating manholes, generating manhole reports, and viewing images.
From this dialog box, a manhole can be selected in 2 ways: from the list
presented, or from the map.
Arcview will color the selected manholes red. After selecting
a manhole, the user may view its manhole report, view images of the manhole,
and/or view its smoke test data (if the manhole had a positive smoke test)
by clicking the appropriate button.
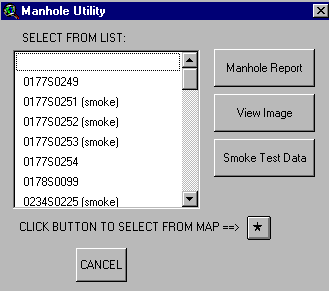
Figure 14: The Manhole Utility Dialog Box
Function 6: Identify TV-inspected mains.
Clicking this button highlights mains that were TV-inspected during
the SSES (Figure 15). Images of those mains can be displayed by clicking
the button to the right, as described below.
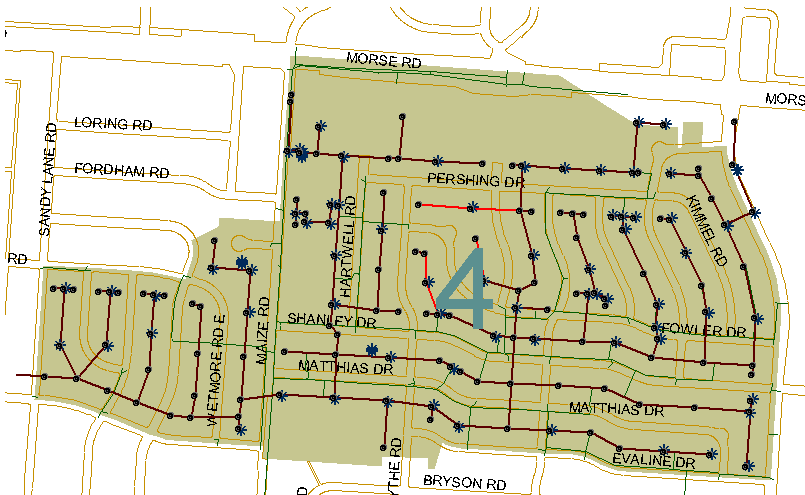
Figure 15: An Example Display Shows the Lines TV-Inspected in Area 4
Function 7: Display images of TV-inspected mains.
This button displays images taken from TV inspections. To display the
images, the user first clicks the button, then selects a TV-inspected main
from the map.
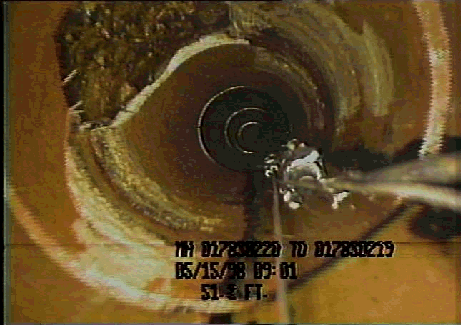
Figure 16: Accessing TV Photos From the GIS Interface
Function 8: Select TV-inspected mains or smoke-test
locations.
This button is used in conjunction with the 2 buttons to the right
of it to display information about TV-inspections or Smoke-tests. This
button is used to select TV-inspected mains and/or smoke-test locations.
Function 9: Display TV Line Information.
This button displays information about selected TV-inspected mains.
Before clicking this button, the user should select one or more TV-inspected
mains by using the "S" button (see No.8 described above).
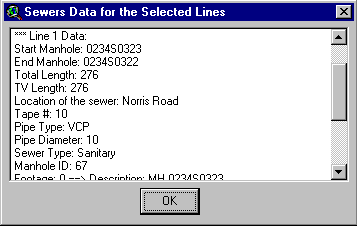
Figure 17: Displaying Data for Selected TV-Inspected Sewer Lines
Function 10: Display Smoke-test results.
This button displays information about selected smoke-test locations.
Before clicking this button, the user should select one or more TV-inspected
mains by using the "S" button (see No.8 described above).
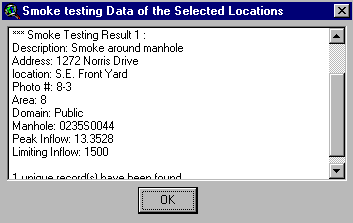
Figure 18: Displaying Smoke Testing Data for Selected Locations
[Smoke Leaks (Not At Manhole)] opens a list-box that presents smoke
leaks found at locations other than manholes. Selecting from the list prompts
Arcview to highlight on the map the smoke leaks in the selected category.
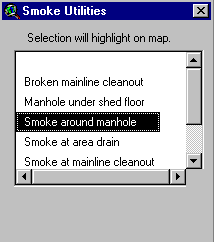
Figure 19: The Smoke Testing Utility List Control
Function 11: Add Ortho-images.
This button adds ortho-images to map views. After clicking the button,
the user chooses a location on the map, and ArcView adds the ortho-photo
for that location to the map view. (A new theme appears at the top of the
legend on the left side of the screen.) To display the ortho-image,
the user must turn it on by checking its box in the legend.
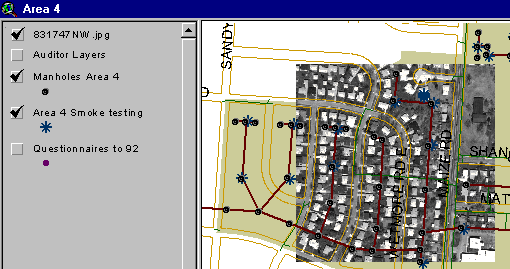
Figure 20: Adding Ortho-Images to Map Views
8. GIS and Hydraulic Model Link
As part of this project, the U.S. EPA's Stormwater Management Model
(SWMM) was used to simulate and analyze the sewer system and to help the
project team evaluate different design scenarios. The models were developed
and calibrated based on measured rainfall, sanitary and storm flow meters,
depth meters in the designed cross connections, and groundwater wells.
The output of hydraulic modeling using SWMM was a text-based report.
That report includes a tabular description of flow within the modeled system,
including information about maximum flow levels and pipe capacity. Engineers
typically rely on their experience to interpret and understand the simulation
results and to predict the performance of the system. Correct and accurate
interpretation of the simulation results is a key to the success of the
entire project. However, due to the enormous amount of data generated from
the simulation runs, visualization is the most efficient tool to enable
the understanding and comprehension of the simulation results. Graphical
representation via the GIS interface brought the model data and simulation
results to life. Since model nodes generally corresponded to manholes or
other structures mapped for the project, it was a straightforward operation
to link the model data to points or lines on the digital map. With a simple
query, the pipes or structures that were flooded could be highlighted (Figure
21).
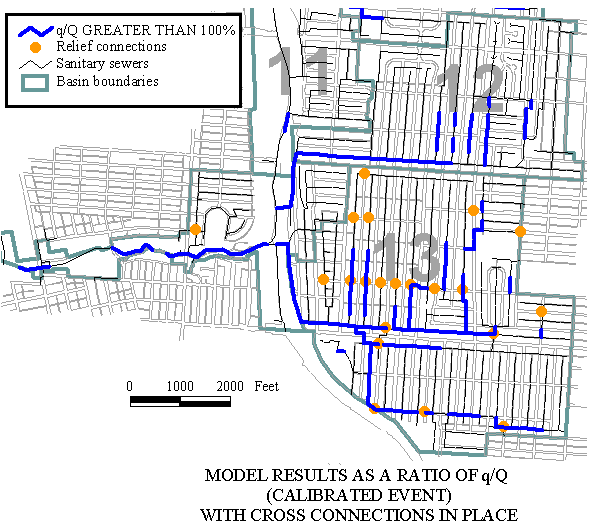
Figure 21: Sewer System Capacity Analysis Based on Model Results
The graphic portrayal of model information was taken a step further
by using ArcInfo's spatial analysis tools. For example, the area-wide extent
of flooding was represented by the difference between a TIN of topography
and a TIN of model data. Using ArcInfo's CUTFILL command, areas of flooding
were represented by areas of fill (filled with water). These representations
of the model data gave engineers a picture of the data beyond the columns
and rows normally available from the SWMM model. The areas of flooding
represented by TINs and polygons could be overlaid with the mapped Complaint
Records as a means to verify model results. For example, if the model showed
a large area of flooding for a given rainfall event, and complaint records
showed evidence of past flooding residential complaints in that same area,
it was assumed that the model was representative of real-world conditions.
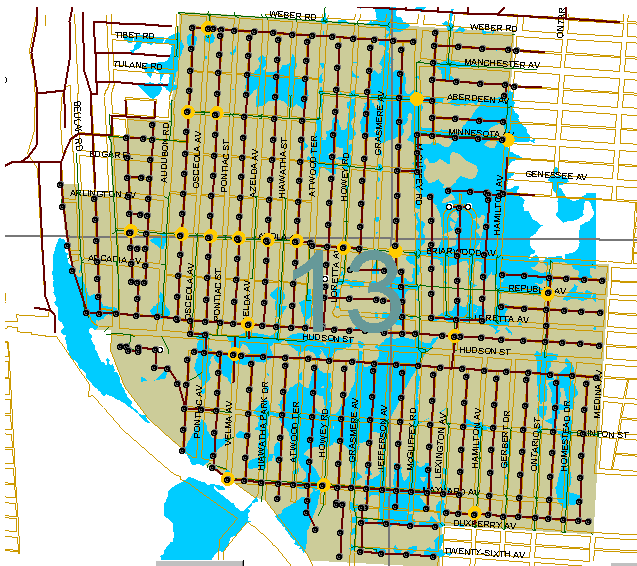
Figure 22: Stormwater Flooding Area Map
In this project, the GIS interface was used as a post-processing tool
to enhance the engineers' ability to visualize and understand the overall
performance of the sewer network and thus, develop more effective maintenance
and improvement strategies. One natural extension of the system would be
to use the GIS interface as a pre-processor to support the development
of SWMM models. Development of such models is a time-consuming process
that typically requires many cycles of modeling and analysis before accurate
and reliable models can be obtained. Using the GIS interface, the development
of SWMM models can be partially automated. This will substantially improve
and facilitate modeling large sewer networks and performing many cycles
of modeling and analysis in a relatively short time.
9. Additional GIS Supported SSES Functions
To compliment the SSES database information and the GIS interface, other data about the sewer system was collected and was incorporated into the database. A discussion of this information follows:
Service Requests - a service request represents a "complaint and work record" filed with and investigated by SMOC personnel. An individual service request evaluates the nature and possible origin of the problem based on the information conveyed by the resident. In compiling the City's maintenance service requests, the categorization of the "nature of the service request" is based primarily on the categorization provided on the individual "complaint and work record" forms completed by personnel at the SMOC. A total of 2900 relevant Service Request records dating back as early as 1985 were input into the database.
Questionnaires - resident questionnaires were another source of information about the study area. A total of 211 forms from a 1992 survey were added to 712 forms from a 1997 survey (out of 7550 mailed). DOSD SSES staff reviewed each form and catalogued the forms based on residential problem information. The survey solicited comments from the residents regarding the nature and extent of two types of problems: (1) Water-in-basement (WIB) occurrences, and; (2) stormwater flooding problems on or near their respective properties. Objective and open-ended questions sought to facilitate differentiation between sanitary and stormwater related WIB, the severity of the flooding event.
Land Use - land use data was employed principally in the
modeling efforts. For the sanitary model, land use was used to determine
dry weather flows. For the storm sewer model, impervious area factors based
on land use type was used to develop stormwater runoff rates.
10. Conclusions
The SSES GIS has proved to be a useful tool for integrating, retrieving, querying, and displaying SSES information. Presentation and visualization of SSES data using the GIS interface proved to be extremely effective in understanding the overall behavior of the sewer system and in communicating findings and recommendations among project team members.
The development of the GIS was targeted toward the goal of making more informed decisions by taking advantage of spatial query and analysis of the field collected data. The GIS also allows for a dynamic "paperless report" format. The key words are flexibility and power. Flexibility in storage and manipulation of data. Flexibility in query analysis because of the relational database. The power to witness the results of query analysis in spatial relationships. The power to make minor adjustments in output and develop new relationships in a matter of minutes.
Prior to GIS, manipulation of large amounts of varied but related data
this was a long and tedious task. The physical management of paper and
the chance of error were management concerns. Database software development
caused a dramatic improvement in the handling, accuracy, and analysis of
data. However, spatial output was still a manual operation, even if database
query results were displayed in a CAD format. The advent of GIS software
bridged this gap and is transforming how planners, engineers, scientists,
and administrators store and analyze data and problems. Questions and answers
that were tedious to develop can now be produced and graphically displayed
in a matter of seconds. In fact "what if?" analysis capabilities are nearly
limitless. Relationships that were never or were not cost-effective to
consider are now within grasp. Relational database software began the transition
toward enhanced data management. The major impact though was the reality
of the spatial link. The benefits are considerable savings in man-hours,
cost, and more informed decision-making capabilities.
Acknowledgment
This paper is based on the work performed for the City of Columbus,
Department of Public Utilities, Division of Sewerage and Drainage as part
of Engineering Agreement No. CT-16376 A Modification No. 1. The project
management team for the City of Columbus included Steve Salay, PE and Laurie
Chase, PE of DOSD, and Mike Foster of SMOC, the sewer maintenance and operation
group for the Department of Utilities. The authors wish to recognize the
technical contributions to the development of the database and GIS system
by the following EMH&T staff: Dr. Taymour El-Hosseiny, PE ; John Ortli,
PE ; Derek Mair; and, Steve Farst, PE. As lead consultant for the project
EMH&T recognizes the data collection contributions from Terran Corporation,
Beavercreek,OH (SSO flow monitoring); and, BBC&M, Columbus, OH (groundwater
wells). The views expressed herein are those of the authors and not necessarily
those of the City of Columbus.
Authors Information
Mahmoud Rashad Halfawy, Ph.D. - Research Associate, Center for Transportation Research and Education, Iowa State University (www.ctre.iastate.edu); Formerly, Software Engineer, Engineering Animation, Inc., Iowa; Engineering Scientist, EMH&T, Inc., Engineers and Surveyors, Ohio; Ph.D. Civil Engineering, The Ohio State University, 1998; Email: halfway@iastate.edu
David S. Pyzoha, PE - Associate, Evans, Mechwart, Hambleton & Tilton, Inc., Engineers and Surveyors; Chief Engineer/Office Manager of the Cincinnati Office; BCE in Civil Engineering, Cleveland State University (1972); Professional Engineer in Ohio and Kentucky. Published author of a book titled, Implementing a Stormwater Management Program, Lewis Publishers, 1994.
Mohamed Abdel-Latif, Ph.D., PE - CEO, Hamza Associates, Cairo, Egypt; formerly, project manager at EMH&T, Inc., Gahanna, Ohio; Ph.D. Civil Engineering, The Ohio State University, 1994; Professional Engineer in the State of Ohio.
Randall Young, M.A. - GIS Specialist, Evans, Mechwart, Hambleton & Tilton, Inc., Engineers and Surveyors; M.A. Geography, Georgia State University, 1996.
Robert Miller, BSCE - Vice-President and District
Manager, Pitometer-Specialty Sewer, Hazelwood, Missouri;
Former partner of Specialty Sewer Services, Inc.; BS in Environmental
Engineering, University of Central Florida (1979)
Lori Windham - System Programmer, Pitometer-Specialty Sewer, Hazelwood, Missouri; Responsible for internal database development and programming in Visual-Basic and Avenue programming languages.
Richard Wiegand - Mapping Specialist, Pitometer-Specialty
Sewer, Hazelwood, Missouri; Responsible for AutoCAD and ArcView map and
theme generation.
®MS-Access is a product of Microsoft Corporation.
®ArcView, ArcInfo are products of Environmental Systems Research
Institute, Inc.
®AutoCAD is a product of AutoDesk, Inc.
®Oracle is a product of Oracle Corporation.
® Hansen IMS is a product of Hansen Information Technologies.
Other product names are the trademark of their respective owners.