A BRUSH WITH ARCVIEW GIS
Lora Chapman
Submitted Abstract: In the world of municipal planning, one of the most important components of GIS is the Land Use Theme. "Parcel specific" land use, that can be updated annually, is a valuable tool in the analysis of transportation needs, population estimates, growth patterns, environmental studies, and many other planning issues. This paper gives Tallahassee-Leon County Florida's (population: 243,000) experience of using the County Property Appraiser's Tax Roll to create a twelve color scheme to describe a general land use for each of the 93,000 parcels.
A BRUSH WITH ARCVIEW GIS
In the spirit of the fine arts and taking cues and hues from Van Gogh, Gauguin, Klee, and Mondrian, I present to you: Existing Land Use In Vibrant Colors. That is, Existing Land Use In Vibrant Colors with the aid of ArcView, the local Property Appraiser’s data base, and a base map.
The example I will use is one with which I am intimately familiar, Tallahassee-Leon County, Florida. This combined area of 671 square miles has a population of 243,300 and 93,000 parcels of land.

Leon County & Florida Maps
The Leon County Property Appraiser’s file is parcel specific—one record for every recorded tax parcel. It is a dbf file that is indexed on a unique tax identification number.
Between 1990 and 1999, the City and County paid approximately $700,000 to create a parcel coverage. All 93,000 properties can be linked to the dbf file by the tax identification number, thereby giving us mapping accessibility to all public information carried by the Property Appraiser.

Click image for enlarged view
Digitized Cadastral Map
PROPERTY APPRAISER’S FILE
- TAX ID #
- NON-TAXABLE CODE
- NAME & ADDRESS OF OWNER
- LOCATION ADDRESS
- HOMESTEAD EXEMPTION CODE
- JURISDICTION
- ZIP CODE
- MARKET VALUE
- EXEMPTION AMOUNT
- BUILDING VALUE(S)
- LAND VALUE
- IMPROVEMENT CODE
- SQUARE FEET OF IMPROVEMENT(S)
- ACTUAL YEAR BUILT
- # OF TAXABLE STRUCTURES
- SALES INFORMATION
- CURRENT TAXES
For this exercise, the focus is on the IMPROVEMENT CODE, which equates to "Existing Land Use". However, this four digit improvement code offers hundreds of possibilities. To visually identify land use with colors, we found twelve to be a reasonable number to comprehend. As it turned out, the improvements could also logically be grouped into twelve categories. This color scheme more or less follows planning conventions established by the American Institute of Certified Planners (AICP)—who were probably influenced by Van Gogh, Matisse, etal.


Click image for enlarged view
Existing Land Use Map & Zoomed Out
EXISTING LAND USE FILE
- TAX ID #
- IMPROVEMENT CODE
- COLOR
- PATTERN
- EXCEPTION
- NUMBER OF DWELLINGS
- NUMBER OF TAXABLE STRUCTURES
| COLOR |
PATTERNS |
| yellow | single family detached, mobile home |
| brown | townhouse, condominium, dorm, duplex, triplex, quadraplex, group quarters, multi-family, mobile home park |
| pink | clinic, hospital, nursing home, hotel, motel |
| red | commercial, retail |
| orange | office |
| gray | warehouse, industrial |
| light blue | government operation, utilities |
| light green | school, college, university |
| green | green space, parks, historical |
| beige | religious, non-profit |
| bright blue | water |
| white | vacant |
PROBLEMS
It should be understood, however, that this application was not developed without problems—some solved, some residual.
First, the solved problems:
The number of dwelling units per parcel had not been consistently nor
systematically captured.
SOLUTION: For the multi-family records, three people spent about
2 months doing research to correctly attribute the number of units, using
utility files, building permits, and field work.
A single use on a large tract of land caused a distorted
representation of the intensity of development.
SOLUTION: Using our "Building Coverage", structures on
parcels greater than ten acres were selected and used to create a new
coverage. Using a heavy outline, we colored those structures to correspond
with their improvement code on the Property Appraiser’s file. The
original parcel was then re-coded as vacant land.


Click image for enlarged view
Distorted Land Use & Corrected Land Use
Property which was not taxable, frequently did not have improvement
codes or other structural information. This situation occurred most
frequently with government property.
SOLUTION: One person spent about one month verifying the uses on
non-taxed property through on-site inspections and other records.
Annual updating of the Existing Land Use file from the annual
"Certified Tax Roll" was not straight forward. ( Values on
the Appraiser’s file are for taxing purposes, not to reflect land use.)
SOLUTION: An asterisk (*) was placed in a designated field on
the Existing Land Use file to document differences between values for
taxing purposes and values for existing land use. (See Problem #3.)
Now the residual problems:
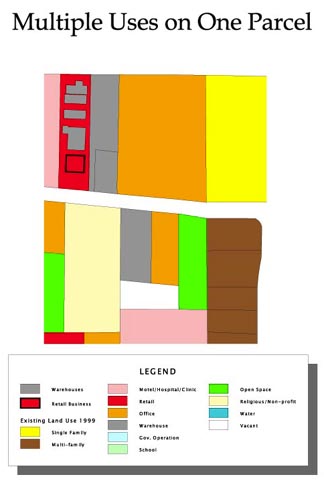
About 2.4% of the parcels have more than one existing land use. How
can this be best represented on the color coded map?
POTENTIAL SOLUTION: One potential solution involves the
"Building Coverage" in a similar way to that used in Problem #2
above, that is, linking use to structure, rather than parcel. The Property
Appraiser has a separate file for which there is a record for every
taxable structure. This file contains the following attributes:
- TAX ID #
- Improvement Code
- Square Feet of the Improvement
- Taxable Value
- Actual Year Built
The long range plan is to link the records in this file with the structures in the "Building Coverage", so that the existing land use for each structure can be accurately identified. In the meantime, the color of the most intensive use is displayed.
Click image for enlarged view
Multiple uses on one parcel
Mobile Homes appear on the Property Appraiser’s file when they are
claimed as real property. The 1990 Census reported 9,978 mobile homes used
as dwellings. Only 40% (3,956 ) of those appeared on the Leon County Tax
Roll that year. The problem is how to account for the missing mobile homes
in the Existing Land Use Coverage.
POTENTIAL SOLUTION: Using information from the Leon County Health
Department who monitor Mobile Home Parks, field work, and other surveys,
it has been determined that about 40% of the mobile homes in Leon County
are in Parks. We assume that since these units are renting space, they are
not on the tax roll. That leaves 20% for which there is no accounting. By
comparing Census information at the Tract or Block Group level with the
Property Appraiser’s data, deficits in mobile home counts occur most
often in the rural areas where the housing densities are very low, which
minimizes the significance of absent data
The only correction that might be possible in the future, would be to better track the addition and removal of mobile homes at a given location.
Our interim solution has been to identify the mobile home parks from the sources previously sited and treat them as multi-family arrangements with the number of units corresponding to the counts available. In some cases, aerial photography has been used in rural communities to identify mobile homes.

Click image
for enlarged view
Mobile homes in a park and on vacant land
*****
One very important recommendation to those maintaining an Existing Land Use coverage: Keep a copy of your local Property Appraiser’s certified tax roll for the year 2000. This file can be used when Census 2000 data is released to reconcile differences between the Census figures and the local tax roll in dwelling units.
*****
APPLICATIONS
Applications which use the Existing Land Use coverage and its associated dbf file are listed below. Some are used in conjunction with other coverages and ARCVIEW extensions.
A. Special Area Studies.
- Population (from number of dwelling units and Census factors: people per household and vacancy rate).
- Amount of commercial and/or office space.
- Ownership (guided by homestead exemption status).
- Age of housing stock.
B. Transportation Studies.
- Bus routing (number of people within one quarter mile of a potential corridor).
- Corridor studies (development impacts)
- Long Range Transportation Plans (identifying vacant, developable land).
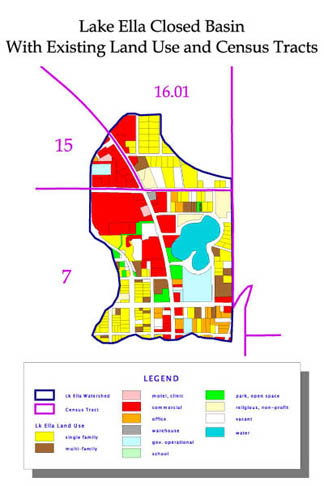
C. Environmental analysis.
- Development by drainage basin.
- Homes in flood plains, water ways, etc.
- Greenway corridor identification and links.
D. Facility location identification.
- Vacant land identification.
- Population by radii (within 1 mile radius, 2 mile radius, etc.).
Click image
for enlarged view
Watershed Analysis
COSTS
To assist managers in estimating the cost to create an Existing Land Use coverage, the table below gives the approximate figures incurred by Tallahassee-Leon County.
|
Required/Not |
Components |
Source |
Cost |
Time |
|
Required |
Tax File |
Property Appraiser |
0 |
0 |
|
Required |
Digitized Cadastral Maps* |
Consultant & In House |
$700,000 (or about $7.53 per parcel) |
7 years |
|
Required |
Existing Land Use file |
In House |
one person annual salary |
1person, 12months |
* The digitized cadastral maps included coverages for buildings, roads, and water bodies.
After the initial cost of creating the Existing Land Use coverage is absorbed, future maintenance is relatively inexpensive since the Property Appraiser’s Office and the building permitting staff become the primary sources of updated information.
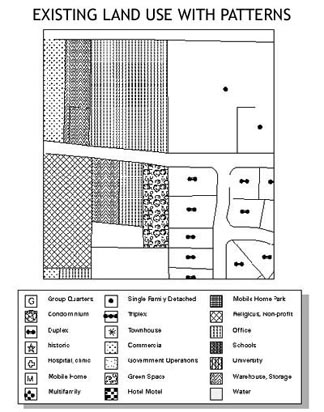
BLACK & WHITE
The future is less colorful. The cost of reproducing color for public distribution made it necessary to find a black and white alternative. (This also makes Existing Land Use maps accessible to colorblind individuals.) The twelve colors became twenty patterns for more specific representation of improvement codes.
Click image
for enlarged view
Existing Land Use in Patterns
CONCLUSION
An Existing Land Use coverage offers colorful possibilities for effective problem solving, combined with impressive public presentations. Its relatively inexpensive development and maintenance costs can be justified by the savings engendered through speedy access to comprehensive and practical information. It may have the added effect of starting a new movement in the Art World.
Acknowledgments:
I would like to thank Frank Dietrich, Mapping and Graphic Specialist, for his assistance in formatting the graphics files and text so that this paper could be attractively and properly submitted.
I would also like to thank the following people for proofreading and constructively criticizing this first venture in professional paper writing: Mrs. Pat Curtis, Director of Leon County Management Information Services, Bob Parmalee, GIS Coordinator for the Leon County Property Appraiser’s Office, and Rick Fausone, Research Supervisor for the Tallahassee-Leon County Planning Department.
Author Information:
Author: Lora Chapman
Title: Senior Planner
Organization: Tallahassee-Leon County Planning Department
Address: City Hall, #A-24, 300 S. Adams Street, Tallahassee, FL 32301
Telephone: (850) 891-8600
Fax: (850) 891-8734
Email address: ChapmanL@mail.ci.tlh.fl.us