Mapping out Crime:
Expanding the Boundaries
Springfield, IL -Gun Related Incidents
Abstract"Guns in Springfield" As a response to the Governor of Illinois stance on reducing gun safety and gang/drug related crime in the city of Springfield, Illinois, "Guns in Springfield" analyzes three years of gun related crime reports. Utilizing various techniques including spatial analysis, "hot spot," and trend analysis, a determination of when and where gun violence was occurring assisted in the formation of tactical patrol response strategies. The report was made possible because of a partnership between the Illinois State Police and the Springfield Police Department (SPD). This partnership was formed for the purpose of introducing and training SPD analysts in the use of ArcView and other statistical techniques for analyzing crime and forming strategic patrol and investigative plans
Workshop Format
Contact Information
Overview
Mapping Applications
Description of Data Used
Agencies Involved
Indicators of Effectiveness
Experience Level of the Intended Audience
Workshop Format
The Illinois State Police, Strategic Information and Analysis Group and Springfield Police Department Crime Analysis Unit, respectfully submits "Guns in Springfield" for NIJ's call for concept papers "Mapping Out Crime: Expanding the Boundaries".
Lex Bitner - Illinois State Police
Jennifer Gardner - Illinois State Police
Lieutenant Ralph Caldwell - Springfield PD
In early 1998, the Springfield Police Department (SPD) and the Illinois State Police (ISP) formed a partnership for the purpose of analyzing crime and forming strategic patrol and investigative plans. The first analytical initiative was to collect and analyze gun related incidents and gang related shootings within the city of Springfield, Illinois. Recent indictments of the top tier of gang leaders had resulted in a struggle for power as gang members sought control of positions and turf wars had erupted between rival gang members looking to take control.
As a result, the number of shootings and gun related activity had been escalating in the city. Analysts from SPD and ISP Crime Trends and Research Team worked together to formulate an analysis in order to more accurately define the problem. The ISP provided expertise in GIS analysis and statistical techniques, and SPD provided input into the history of tactical operations and street level enforcement. The resulting product was a comprehensive report of statistical and spatial analysis of gun related incidences in the city of Springfield. The report was disseminated to Department Administrative Staff and each Beat Lieutenant to provide to his/her patrol officers.
Two and one half years of gun related incident data was collected and entered into a database for analysis. Police reports gathered from the Springfield Police Department records room reflecting guns and/or gun related incidents, shootings, stolen and recovered weapons were used to build the database. Demographic data from US Census was used for years 1997 and 2002.
Mapping Applications
Analysts utilized several applications to produce the finished report including: ArcView 3.1 and ArcView Spatial Analyst for the maps and analysis, PageMaker 6.5 for the layout and Microsoft Powerpoint for the graphs. Part I of the report is a statistical overview of the data including yearly and monthly trends, percentages by reporting beat and thresholds for gun related incidences, gang-related gun incidences, confirmed shootings and stolen and recovered weapons. An analysis of the density maps are also included in part I.
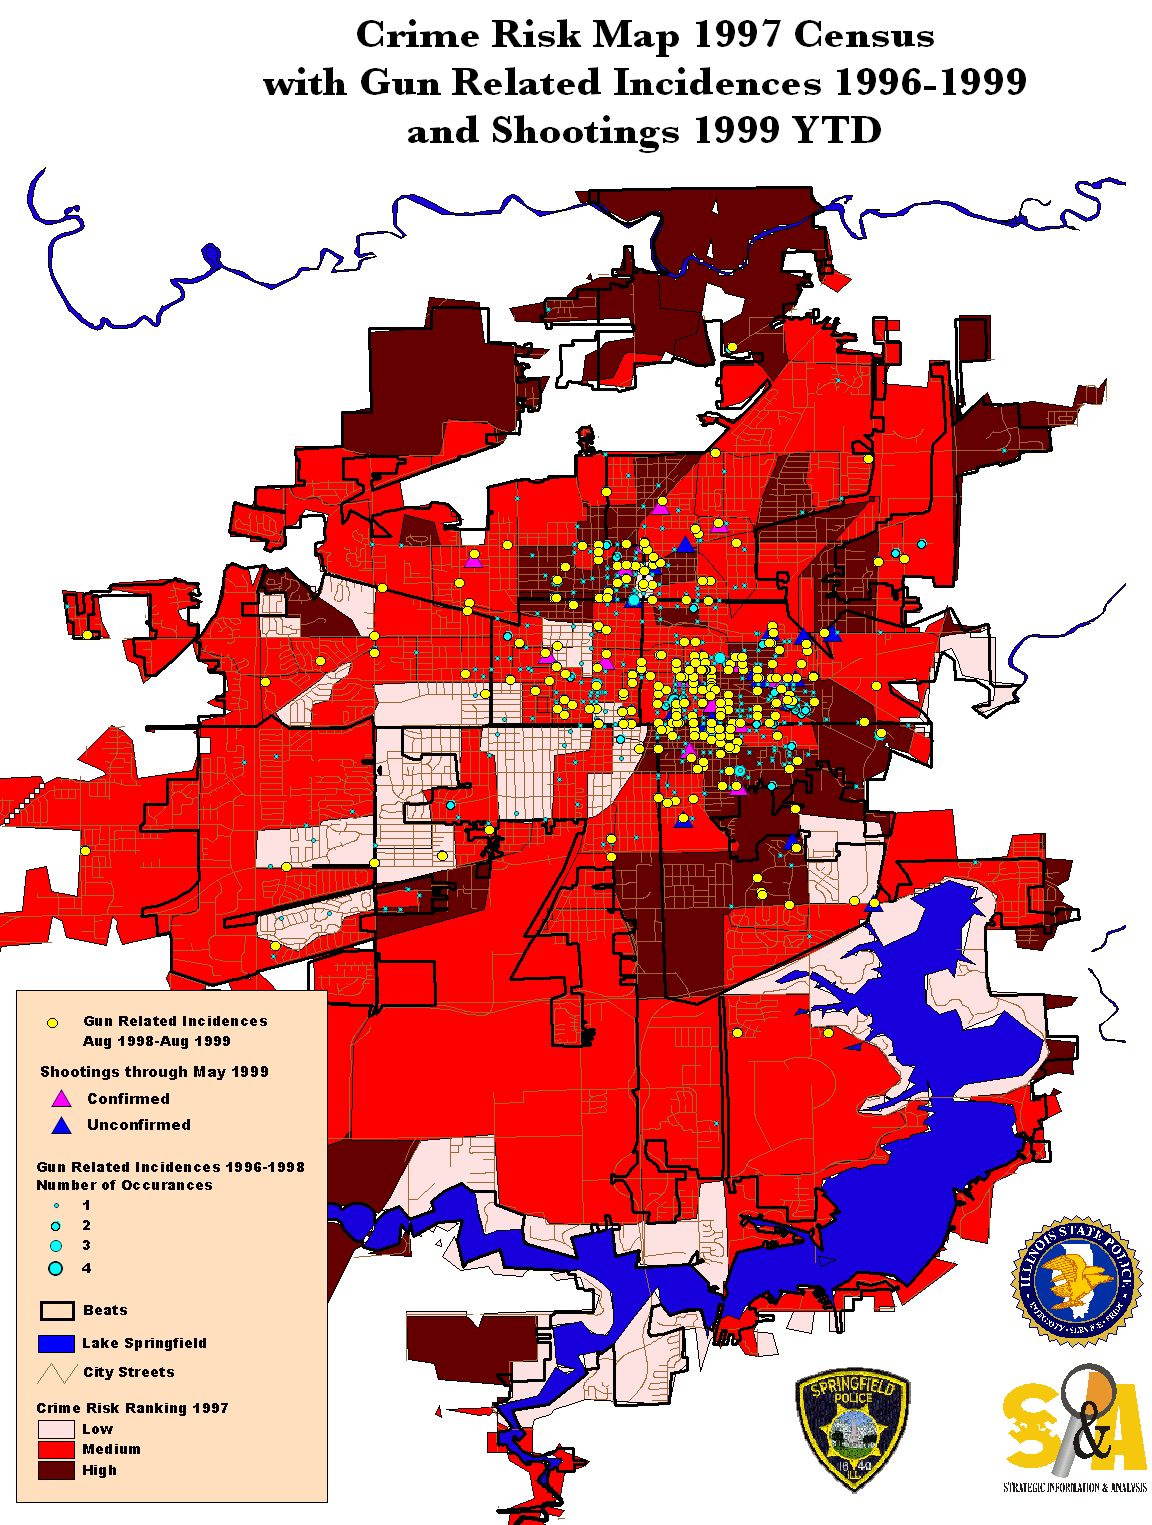
Part II of the report consists of a geographic analysis of the data utilizing ArcView 3.1 and ArcView Spatial Analyst. Incident addresses were geocoded producing three maps for the years 1996, 1997 and 1998 of the location of each particular type of incident. Density calculations were performed to determine "hot spot" areas for each year of activity. All three years of data were represented in the map layouts depicting a different type of gun incident, i.e., the first map shows "hot spot" areas for all three years of stolen weapons incidences, the next map layout illustrates recovered weapons, etc.
Yearly comparisons illustrate the movement of the center of activity and served as an aid in determining changes in density patterns of gun related incidences in the city. This format allows the reader to quickly scan the density movement of each type of gun related incident through time and ascertain patterns. Graduated symboling was chosen to indicate multiple incidents occurring at the same address. Also included is a city wide map combining the three years of all types of gun related incidents combined to provide a visual overview of the activity for the time period under study. Part III of the report utilizes the Spatial Analyst extension along with demographic information obtained from Claritas 1997 Real Estate Solution Series CD. Census Tracts in Springfield were identified and several grid layers were produced of demographic characteristics which crime trend research has recognized as having a high correlation to crime. The layers included:
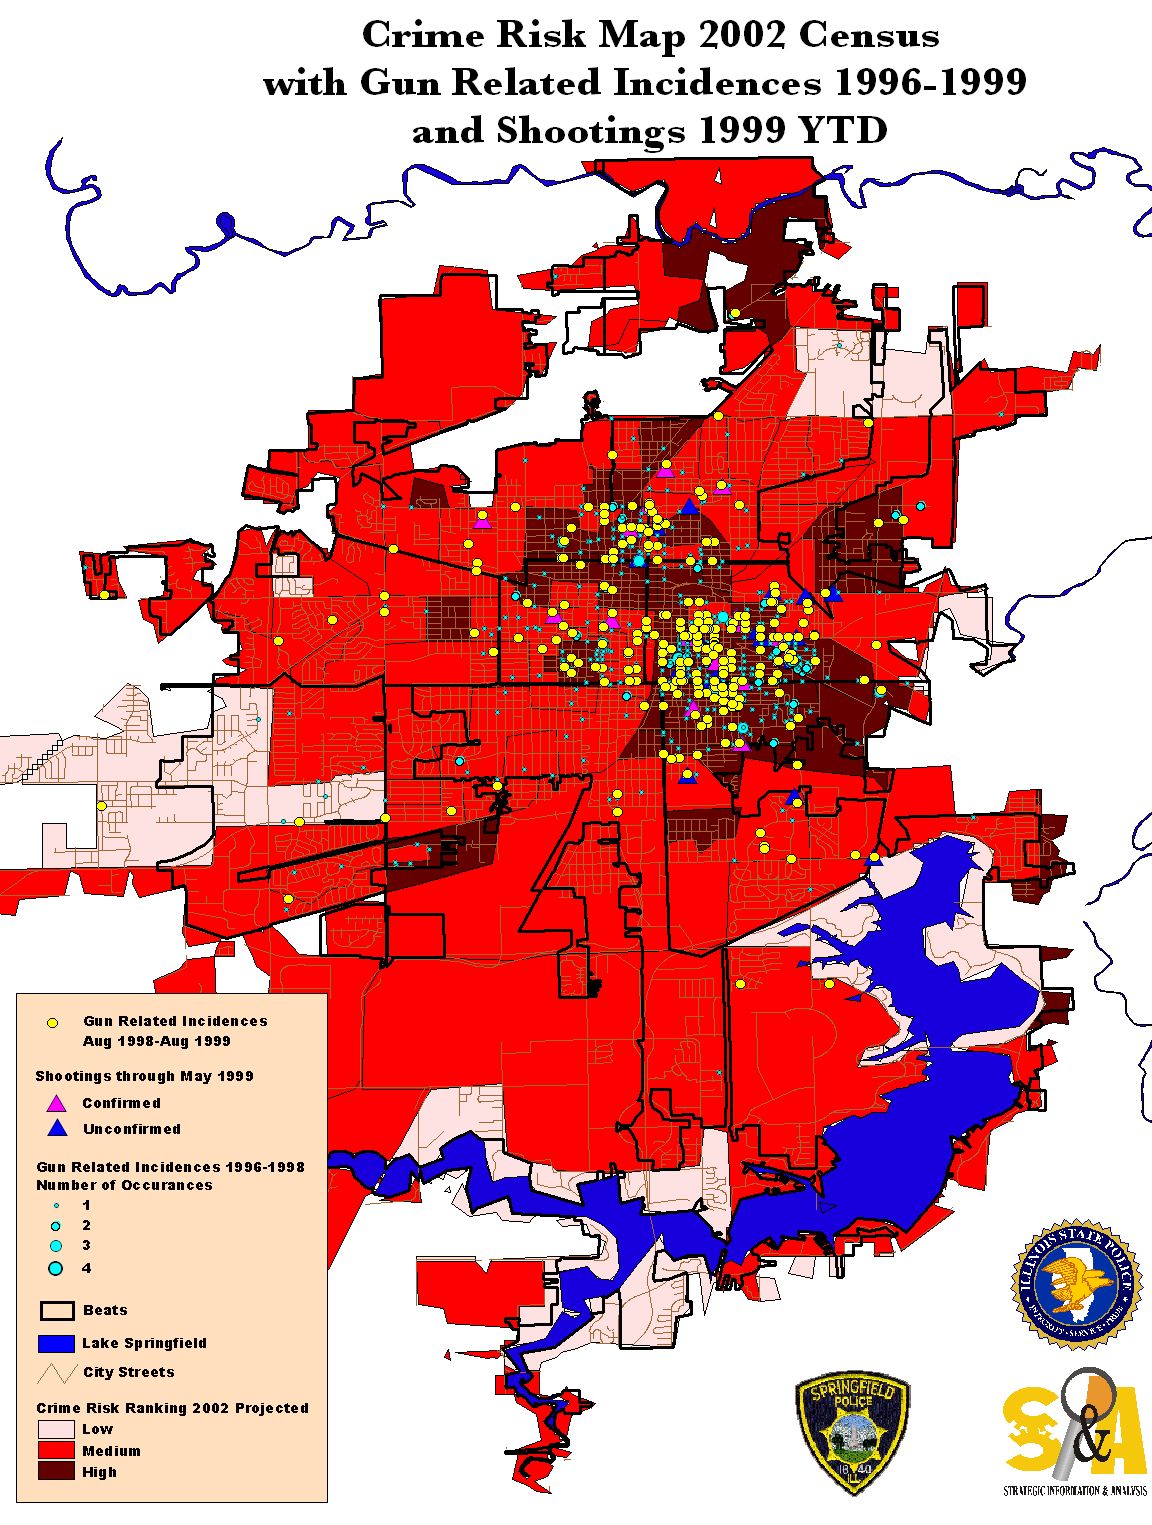
[ Click for full map view... ]
Combined with the crime risk layer are all gun related incidences 1996-1998 as well as shootings through May of 1999. Viewing the layers together substantiates the clustering of crime in and around the highest crime risk areas. The projected 2002 crime risk map indicates a different pattern distribution which more closely matches map locations of crime incident data. Based on the "broken window" theory, the map illustrations are useful in predicting future problem areas for strategic patrol and crime prevention efforts.
Description of Data Used
Police Reports gathered from the Springfield Police Department records room reflecting guns and/or gun related incidents were used to build the database.
Agencies Involved
The Springfield Police Department and the Illinois State Police partnered to share resources and expertise to combat gun related incidents in Springfield. The Illinois State Police provided expertise in mapping applications and statistical techniques, and Springfield PD provided the data needed and first hand experiences of street level enforcement.
Indicators of Effectiveness
When the crime risk maps were shown to one of ISP's gang tactical personnel, her was able to instantly identify a pocket of recent shooting locations as an area inhabited by a recently relocated gang from East St. Louis. He contends this gang faction moved into the area immediately following the SPD indictments of the top tier of gang drug lords. This information solidifies the validity of the crime risk maps as being accurate indicators of criminal activity in the city of Springfield
Springfield upper command was able to make informed decisions considering deployment of patrol and investigative personnel. These decisions were made as a direct result of the information provided by the Crime Analysis Section and the Illinois State Police.
Continuing with these analyses has allowed the Springfield PD the ability to anticipate the migration of these incidents, staying on the cutting edge of enforcement.
[ Click for full map view.... ]
Experience Level of the Intended Audience
Intermediate
Author Information
Jennifer Gardner - Illinois State Police
400 Iles Park Place, Ste 300
Springfield, Illinois 62718
(217)-557-2823
jgardner_isp@yahoo.com