Joseph F. Giacinto
William G. Cutler
Marc D. Hrovatic
Development, Implementation, and Maintenance of Geographical
Information Systems with Remote Query Capabilities
Abstract
Utilizing ArcView, MapObjects, and SQL Server 7.0 as base components in a Visual Basic development environment, customized geographic information systems were developed for Superfund and Brownfield sites. The application capabilities included the ability to remotely query a complex tabular analytical database data residing on a server computer through an Internet connection to a client computer. Query requests were processed on a server computer, converted to a DBF format, and sent back to the PC client computer. The client computer then converted the DBF file to a shape file for manipulation and display in the application. The development environment allowed various capabilities and third party software to be incorporated into the application for mapping and data analyses, and data visualization.
Introduction
This study documents how information related to environmentally-sensitive sites can be effectively managed by integrating GIS and Internet-based query applications. The Avtex Fibers Superfund Site (www.avtexfibers.com) and The Former Eastplant (www.eastplant.com) are former manufacturing facilities operated over a period of approximately 50 years. A substantial volume of data has been compiled and generated from investigation and cleanup activities. The types of data associated with project activities are diverse and voluminous. Key types of data include: site layout and physical features (e.g., buildings and structures, underground sewers, topography, vegetation, disposal areas and basins); chemical data from laboratory analysis of air, soil, surface water, ground water, waste and demolition debris samples; historic site maps and aerial photographs, and photographic documentation of site investigation and cleanup activities; data associated with borings and monitoring wells (e.g., sampling depths, boring logs, well construction details); hydraulic data (e.g., ground water elevations, aquifer testing results, vertical and lateral hydraulic gradients in ground water); and project documents such as maps, work plans, reports, and project progress reports.
Data management is a critical and substantial component of project activities. Until recently, the massive amount of paper and electronic data collected over several years was maintained by multiple parties at various locations. The data formats and locations made information management and dissemination difficult and costly. Prior to development of the remotely accessible information query system described below, significant effort was needed to locate, reproduce and distribute data to parties needing various types of information during the course of the project.
By gathering and formatting various data types into an ArcView format, utilizing MapObjects as the GIS engine, SQL as the database engine, and third party Active X components, an application was designed and implemented to map, display and manipulate spatial and tabular data. The application was developed to aid in feasibility studies and remedial activities planned for the next several years. Users are located in numerous offices throughout the United States. Due to the wide-spread geographical locations of the personnel working on the project, a GIS and remotely accessible tabular database query application was developed to allow each of the site managers, contractors, state and federal regulators access to a common centralized database through an Internet connection.
Application Objectives And Overview
The objective of the application was to permit site information, obtained from diverse sources over several years, to be uniformly distributed among various site personnel in a convenient, easy to use format. Using a Visual Basic code and MapObject components, the application was developed to provide easy access to an assembly of information including a comprehensive database of maps, analytical chemistry data, technical reports, and aerial photos. Spatial databases (maps) and tabular databases (e.g., analytical sampling, water level, and geotechnical databases) were maintained in a ArcView to allow maximum flexibility in performing customized analysis. To eliminate long download times for complex maps (e.g., aerial photographs) over an Internet modem connection, the application and spatial database was distributed to each project team member on a CD. The application was developed as a stand-alone product to eliminate the need for the end user to purchase GIS software. Also, creating an easy to use application saved the end users the cost and time associated with the training generally required to perform analyses using more sophisticated GIS software packages. Additional cost savings were realized by including maps and reports in the application eliminating the need to reproduce maps, documents, and other information that are commonly distributed to the numerous parties involved in the site clean up and remediation activities.
To ensure security, sensitive tabular (e.g., analytical) data was maintained on a centralized server computer accessible through the application, or an independent query interface with a password-protected Internet connection. Centralization of the tabular database allowed controlled maintenance in a consistent and uniform file format, unlimited user access, efficient sharing of all or part of the database, and avoided maintaining multiple copies of similar databases for the project duration. The location of the tabular data on the server computer allowed multiple remote users to query and access the database for customized analyses.
Database Development
Spatial Database
The design of the spatial database allowed access from the client computer hard disk or CD. All spatial data was developed and maintained in an ArcView format to ensure the long term value and scalability of the application. For more sophisticated analysis, end users could utilize ArcView directly to develop customized project files and perform analyses. Attributes including chemical usage, building date, and facility information were attached to relevant shape files. This allowed flexibility in searching and correlating chemical usage, for example, in building and tanks with the distribution of chemicals in soil and groundwater. Attributes were easily found and highlighted using a "Find" feature.
Where applicable, sample descriptions and geologic data were attached to shape files via the shape file attribute table. Information in these attribute tables included links to images and other digital file formats. Technical field notes and documents (e.g., boring, well construction, and geotechnical logs) were included as Adobe PDF format documents linked through the shape file attributes. These technical field documents were accessed by a point and click on the sample point of interest. Activating a "Map Tips" feature allowed the user to identify sampling point locations as well as any other point or shape file attributes on the fly.
Tabular Database and Site Reports
Tabular data was developed from paper copies and electronic file formats collected over decades of investigations. Before entering historical data into an electronic format, a database model was developed to incorporate and preserve aspects of the historical data records in the main application database. Additional fields were added to accommodate uniform naming conventions for identical sample points named differently by various consultants, uniform units for sample chemical measurements, a uniform coordinate system, and for the name of the laboratory performing the analyses. A "Source" field in the database ensured that the reference to the original source of the data was not lost in the merging of records in the main database. All database field definitions and abbreviations used in the database fields as well as data record sources were included in the application help file for reference.
Site reports were accessed through the application by browsing to the document text, figures, or plates location on the application installation CD or directory. Freely available document, CAD, and spreadsheet viewers were included with the application installation CD should the user lack the necessary software to view, print or manipulate the desired documents or CAD files.
Application Development
Development Tools
The application was developed using Microsoft Visual Basic Professional Edition, MapObjects 2, Microsoft SQL Server 7.0, Olectra Chart, and Objective Toolkit/X. Various calls were made to Excel for displaying, formatting, and exporting queried data. Additional Visual Basic computer code provided the option to create charts and customized reports within Excel. The application was packaged with Install Shield for installation management on the client PC. Operating systems supported on the client PC included Windows 95, 98, 2000 and NT.
Development Approach
Application components were developed as modules capable of operating interactively or independently. Modular development permitted independent and parallel development of the customized applications, while permitting incremental testing, enhancements, and implementation of the components. New modules were easily added to the application as needed by the end user group. In addition, development of task specific applications were easily developed from adaptation the main application modules. Modules incorporated in the applications permitted the viewing of site maps, historical features, historical aerial photos, site photos and panorama movies, boring logs, geologic cross sections and miscellaneous site reports and documents. Components within the tabular database query module were used to develop and generate tabular reports, time series graphs, distance versus concentration graphs, data posting and bubble plots.
User Interface and Organization
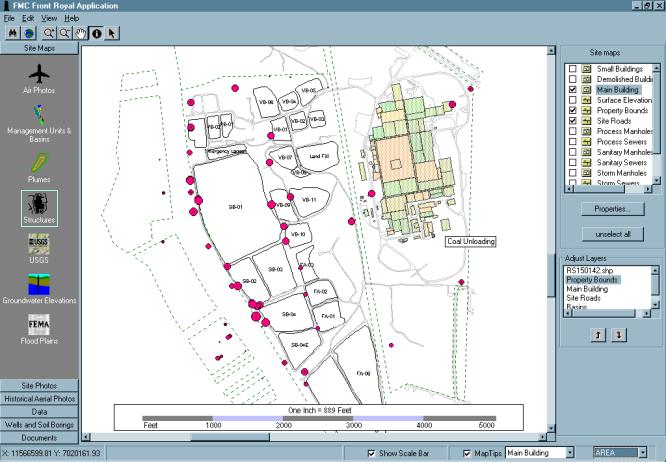
Utilizing a Visual Basic development environment and Active X components, a graphical user interface was developed. For ease of use, a simplified set of control commands (find, pan, zoom, and identify) were developed on the menu bar. The user interface consisted of display module categories, a map window, and corresponding themes (Figure 1), and a scale bar and "Map Tips" display option. The application consists of four general types of modules: a mapping module, a tabular database query module, a document display module, and a figure generator module. Categories of items in the user interface display modules were grouped according to properties (e.g., building, sewers, and roads corresponded to a "Site Structures" subcategory within the "Site Maps" category).
Figure 1. Components of User Interface
When a display module category is activated, the associated shape files are displayed by selecting the corresponding theme check boxes. A "Properties" button allowed modification of various shape file components (e.g., line color, thickness, or type; addition of text labels from attributes and editing label fonts). Shape files were easily moved to the foreground or background in the map display window by selecting the shape file and clicking on an "Adjust Layer" button. The application was developed to immediately recognize shape files upon addition to the application shape file directories. End users can simply add new shape files to the appropriate directory for overlay with the original set of application shape files. An initialization file allowed aliasing shape file names for user customization, and also preserved shape file appearances and formats set during a previous editing session.
To export, format, and print the contents of the map window display, a figure generator module was developed. For querying the tabular data, query interfaces were developed to operate as part of the GIS application by returning shape file from the tabular database query, or independently by returning these queries as and Excel format. The functionality and operation of the figure generator and tabular database query submodules are discussed below.
Figure Generation
For developing application output, the contents of the map window could be exported as an image to Power Point, developed in a "Figure Generator", or exported as a high, medium, or low resolution BMP format file. The figure generator was developed to export the map window contents to a standardized frame allowing the user to enter information for the legend and caption to print a report ready figure format. For figure generation users are given the choice of letter or tabloid paper size with a portrait or landscape orientation with print preview options.
Tabular Database and Query Modules
Data queries are created and sent to the server computer through query interfaces within the application via an Internet connection. For each and every query, the query string sent to the server computer is preceded by the user’s security string. Two query interface screens were developed: a map query submodule for querying analytical data to be overlain in the map window, and a tabular query submodule for developing complex queries related to multiple database fields.
Map Overlay Query Submodule
For queries returned as map window overlays, the data are returned from the server computer to the client computer as DBF files. The query is converted to a DBF file and compressed on the server application, and then decompressed and converted to a shape file on the client computer. The design of the map overlay query interface was developed to limit query times (i.e., returned DBF file sizes) to a maximum of approximately 15 seconds over a 56K modem connection. The queries were constrained by allowing selection of one group and one parameter at a time. Queries converted to shape files allow the user to take full advantage of the flexible plotting options available in MapObjects. Measurements returned as shape files can be represented as scaled symbols or colors based on the measurement value (Figure 2), and/or labeled according to any field (e.g., concentration, well ID, etc.) within the DBF file.
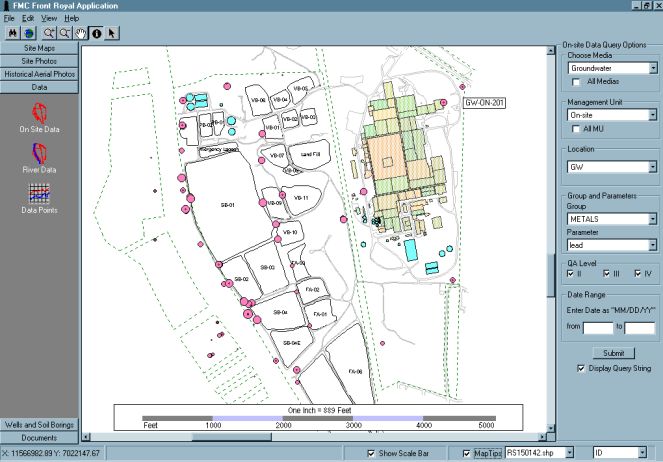
Figure 2. Map Overlay Query Submodule Interface.
In addition to the options available in MapObjects, third party charting software was integrated into the application to allow powerful charting control. Available functions include the ability to chart measured data by distance or time transects with display of sample point IDs, and/or sample measurements on the resulting graphic. Charts were created by a point and click on a series of sample points of interest in the map window. All components of the resulting chart could be edited and/or annotated for printing. The data points could also be sent to an on screen display (Figure 3) or an Excel table report form for inspection of the data points and sample characteristics.
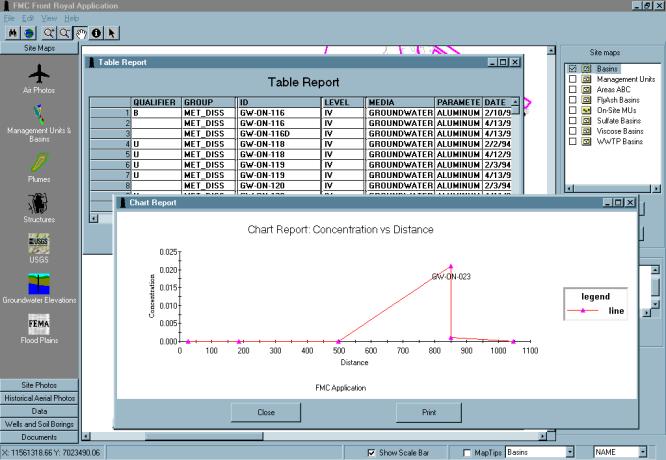
Figure 3. Map Query Table and Chart Reports.
Tabular Query Submodule
For more sophisticated data queries, a flexible and dynamic query interface was developed to query various components of the database including multiple groups or parameters, sample IDs, and sample types. Individual records, or all records could be selected to include in the query. In addition, tables of contaminant standards, detection limits, and or data qualifiers were included as query criteria options. The user was given the choice of database fields to include in the returned data tables (Figure 3). Data returned from the query was displayed as a report in Excel to allow the user the added flexibility of customized data analyses.
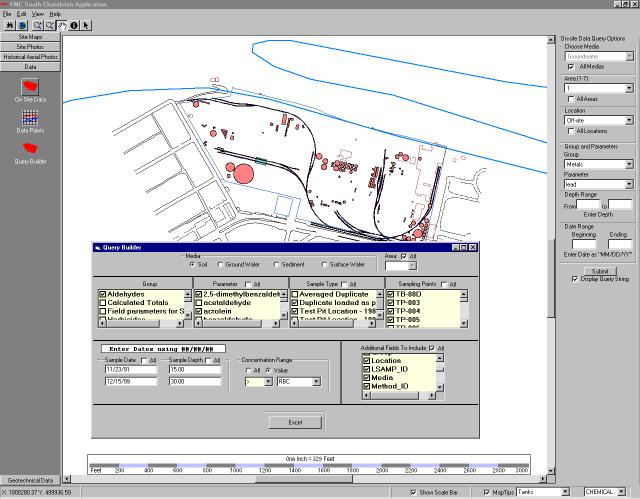
Figure 4. Tabular Query Submodule Interface.
This submodule was developed as an interface independent of the main application. For convenience, the user was permitted to activate the interface from within the main application, or independent of the main application from the "Taskbar & Start Menu". With minor modifications, a derivative of the tabular query submodule is being developed as a stand alone Active Server Page application. This will allow users direct access to the tabular database requiring only a Web browser on the PC client computer.
Distribution and Training
Developing an easy to use application accomplishes two primary goals: minimize training time and expense, and accommodate the wide range of end user computer expertise. Application training required only one four hour session. By covering all aspects of the application in one short training session, end users were able to avoid the inconvenience and cost of an overnight stay at the training site. Utilizing a fully PC networked and self contained Mobile Learning Unit (i.e., a customized 48 feet by 8.5 feet semi-trailer classroom pulled by a 1991 Freightliner diesel tractor) the training session was held on site. The Mobile Learning Unit (MLU) classroom (http://www.mtcofswva.org/mobileLearningUnitDetail.htm) contained thirteen Pentium computers on an NT network with an Internet connection to provide realistic end user conditions.
During the training session, interactive tutorials were used to step the users through the various features and components of the application. Help files were developed and included in the application. Each of the users attending the training session received a copy of the application and interactive tutorial installation CDs, and a user ID and password.
Maintenance
Spatial and Tabular Database
The centralized tabular database allow real time updates to be immediately available to all users on the application system. Electronic data deliverables (EDD) formats allow minimal data formatting to be performed before inserting the data into the main tabular database. To accommodate data uploads and downloads, and data warehousing, a secure Application Server Page (ASP) site was developed (Figure 5). Data and files stored on the ASP site include miscellaneous chemical sampling data, field notes and tests, site reports and documents, site photographs, and CAD files. The ASP site included a message forum for users to review comments and questions from users requiring assistance, or comments associated with the spatial and tabular database. Because the application recognized shape files when copied to the application directory, end users needed only to download revised or new map files to the appropriate application directory for immediate use in the application.
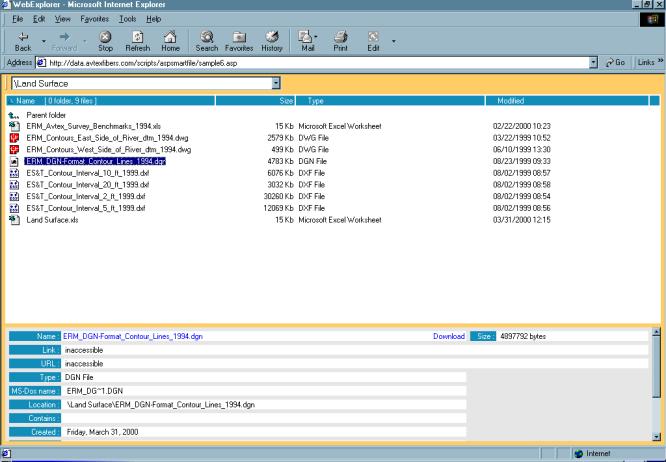
Figure 5. Application Server Page Data Warehouse.
Application
The modular nature of the application permitted new task specific applications to be easily spawned from the original application, and new modules to be added to the main application as the requirements arose. A specialized application was developed to allow demolition contractors to view interior room photographs and field notes for interior building features and hazards to develop more accurate bids for building demolition activities. As site demolition progressed, detailed maps of process sewer elevations and manhole infalls and outfalls were added for developing accurate excavation plans and cost estimates. Incremental application updates utilizing Install Shield were distributed via CD, or posted on the ASP sites for registered users.
Summary
Available information concerning operational history and clean up activities for major environmental remediation projects is typically disseminated among various consultants, contractors and regulatory agencies. Assembling these data into a centralized application and ASP data warehouse is relatively inexpensive compared to the overall project costs. Once the common centralized information system has been developed, ongoing costs savings are realized by eliminating the need for the involved parties to expend resources to develop and maintain local database systems.
In the case of these applications, the computer experience of the user group ranges from novice to expert. In order to accommodate the wide experience range of the users, the capability for GIS analysis in an easy to use format was a key design factor. In addition, the applications require no additional software to perform, manipulate, and analyze the various forms of site data accessed by the application. All of the necessary maps are included on the application installation CD. Therefore, no cost was incurred by the user to buy or learn software, or to research and purchase the necessary maps for overlay and analyses of the site data. In addition, interactive tutorials and extensive help files were included in the applications to assist and train users in the use of the GIS.
The application required only nominal client computer specifications: a Pentium 200 MHz with 64 MB of memory, Windows 95, 98, 2000 or NT operating system, and an Internet connection. The maps associated with the application could be loaded onto the client computer hard drive or accessed from the installation CD to conserve disk space on the client computer.
Future enhancements are anticipated to include porting the entire application to an Internet server computer to minimize the PC client computer requirements for processor speed and disk storage. The client PC would require only an Internet browser to interact with the application or tabular database query interfaces. Currently, the recently released ArcIMS is being reviewed as the GIS engine for the Internet Map Server application. SQL Server will remain the database engine for the application. The modular nature of the application will remain intact to accommodate incremental enhancements and improvements over the life of the project. The generalized nature of the application has permitted easy adaptability to other types of environmentally sensitive sites, or specialized task specific mapping, data query applications, and data contouring. Coupled with the scalable nature of MapObjects/ArcIMS and SQL Server components, the modular nature of the application ensures long term value.
An added benefit of the modular and Internet ready design was that a portion of the applications were converted to MapObject Internet Map Server applications available to the public on Web sites (www.avtexfibers.com and www.eastplant.com). The Web site are intended to keep community members and groups abreast of recent site activities, regulatory issues, and stakeholder meetings. Therefore, the application not only fulfills the requirements of the technical personnel involved in site cleanup and remediation activities, but also helps to fulfill a common mandate by encouraging public involvement at environmentally-sensitive sites.
Prior to development of the application, the spatial and tabular site data was contained in paper copies and various electronic formats scattered among several site contractors and state and federal regulators. The expense and time involved in distributing complex and large paper copy documents often leads to a limited distribution of these documents. Therefore, these documents are not easily shared among the various groups involved in Brownfield and Superfund site remediation and redevelopment. Uniformity and centralization of the site data, coupled with remote access, permitted complex concepts and ideas to be communicated to all those involved in the remediation and redevelopment activities at the sites. Individuals could independently analyze the site data to formulate questions and conclusions prior to group meetings and site remediation discussions, and independently correlate diverse information through simple overlays using data and maps that previously only existed in paper copy documents. In addition, state and federal site regulators are kept up to date on recent site developments and sampling events through instant access to newly collected data, site reports, documents, and background documents and data.
Author Information
Joseph F. Giacinto
ES&T, Inc.
2608 Sheffield Drive
Blacksburg, VA 24060
Phone: (540) 552-0685
Fax: (540) 951-5307
William G. Cutler
FMC Corporation
1735 Market Street
Philadelphia, PA 19103
Marc D. Hrovatic
Luna Innovations, Inc.
2851 Commerce St. SE
Blacksburg, VA 24060
Phone: (540) 552-5128
Fax: (540) 951-0760