Many communities want to place public utilities into their GIS, but fail to start the project due to the size, complexity, and cost associated with doing the work. Typically, city departments run on tight budgets that leave little room for paying outside consultants to gather the needed data and create GIS coverages. A number of communities might have a good, knowledgeable GIS staff in house, but do not get started due to the size and complexity of the task ahead. This paper will review the effort of a small community taking on the challenge of including public utilities into a newly created GIS at the local level, using in-house staffing and information sources. What if you do not have a quarter million dollars to begin the process of moving your water and wastewater facilities into a GIS environment, but would like to get started anyhow? This paper will give you some insight on how to get the process started working with limited staff and financial resources.
The City of West Chicago, Illinois is a suburban community located 30 miles west of downtown Chicago, with a population of 20,000. The city is growing rapidly since we are one of the few communities in the western suburbs of Chicago that has land available for development. The city started their GIS efforts in the fall of 1998 by hiring a full time GIS Coordinator and purchasing GIS software. The GIS effort was created within the city’s Engineering Division with good reason. The primary purpose of the GIS, as well as, the main selling point for City Council was the ability for the city to better manage its rapidly growing infrastructure (water and sewer lines). Therefore, from the outset, the idea that utilities would be placed within the GIS was a given and was seen as a major factor in having a GIS at the local level.
Since GIS was a ‘new shop’ for the city and a totally new concept to the vast majority of staff, I had to get the word out about GIS and how it could improve their day-to-day work effort. In addition we were starting from scratch by obtaining the software and hardware needed for GIS work. We also had to fight the idea that this project was easy. A number of staff members thought we could just generate a set of maps in the GIS, which shows our water and sewer lines, link it up the modeling software and begin doing some facility planning and detailed engineering work! As you can see, a lot of education had to occur with our engineers and other city staff before we could start the project.
By far, the most frightening aspect of this project was our own lack of knowledge on how to get started. We had never created a utility coverage in a GIS and, after looking into the matter, found that very few people in the entire county had done so. My only advice in this area is you’re a pioneer in moving your GIS into engineering applications and you have to spend the lead-time necessary to develop sound methods to create utility features into your GIS. It is our hope that this paper will help you along in that process.
Another big challenge was the major shift in how our GIS worked in terms of level of accuracy. For most planning and map making purposes before utilities, map accuracy of a few feet was fine. However, for engineering purposes the minimum standard was less than a foot and in many cases had to be up to survey quality. This magnitude of accuracy was a level greater than that which was required in the past, and would have a major impact on the overall GIS.
Finally, we found ourselves not looking too far ahead with this project in terms of the total amount of effort required to get this project up and running. It is a huge undertaking, requiring a long time frame and a huge amount of data. If you look at this type of project as a never-ending project that is in fact what this type of project represents. In many respects this project will never be done. It will always be a work in progress. We can always further increase the physical accuracy of a given manhole, or add yet another data attribute to a given section of sewer pipe. The work is endless and will never be “finished” in a technical sense. However, products can be added over time to dramatically increase your productivity in managing public facilities using GIS.
How to get started on a project so large is often very difficult. How do you know you are on the “right” path? How can you control all the unknown variables that will pop up during the project development? How can you manage such a large amount of data under development for long periods of time?
The first thing we did was what most people do: we looked around and found out how other people were doing this type of work. We quickly found that few people in the entire country had actually started placing utilities in their GIS and even fewer had "finished" the project. A quick survey around the entire Chicago region found less than 10 communities with work underway on placing utilities in their GIS. Upon review of these efforts, we found out early in the process that there was no single "way" to do this work. As you might expect, every method for doing this type of work was different in order to address a set of issues that present themselves to that local community or application.
That being said, we could now move on to further evaluation of alternatives since there was no “state of the art” or “right way” to do the work. We now knew there was no best way to do this project, and its conceptual design could be tailored closely to our needs and limitations. Among these limitations are what everyone is short of, time, money and staff to do the work. We also had the further burden of having a brand new GIS shop that was just getting started with demands being placed on the system from other departments interested in getting GIS to assist in their work.
Given these restrictions, one of the first things we explored was the possibility of sending the work out to a consultant to do the data capture in the field using GPS to find manholes, fire hydrants etc. We could also use a consultant to take the GPS data generated in the field and create GIS coverages. This would free up staff to do quality control of the consultant’s work and begin working on other GIS projects the city needed. There is no question that if you have the money this is the way to proceed That is a big "IF" since it is expensive. We found that the GPS fieldwork alone would cost more than $100,000. It was also conservatively estimated that it would take over 200 hours of processing by a consultant to convert the GPS field survey into a GIS cover per facility. This would result in a cost of over $60,000 to develop all three water and wastewater coverages. We simply could not justify this cost on top of the initial start up costs for our GIS, so using outside consultants was rejected.
Another option was to use existing digital files in AutoCAD format that the Engineering Division had created for our water and wastewater facilities. This could at least give us a good base upon which additional GIS work could occur. However, upon examination, this data was to be used for graphic purposes only. The location of features was oversized so it would be legible on an 800-scale citywide map. Therefore, the features extended beyond the right of way in many cases so that manholes and lines to storm water catch basins could be seen on the 800-scale map. Another problem with the file was the large number of dangle and overshoots that when placed into a GIS cover would take more time to clean up then starting from scratch. The final problem with this data set was that after discussions with staff it was found to include numerous errors and omissions.
Finally we looked around the office and found a large number of data sources that could be used to help create utility coverages in the GIS. Items such as sanitary TV tapes, as-built design plans, old WPA facility plans were available for use in this project. The problem with this data is amount and most of it non-digital formats that would be time consuming to utilize. However, this data took on a different light, when we stopped to think about how these records would be used if we got a working GIS file directly from a consultant. We would still have to use this information in order to see how well it worked with the new GIS coverages. In short, since all this material had to be reviewed and incorporated with the GIS utility coverages, why not use it as part of the data capture process.
One drawback in using our paper data sources was the fact that a large portion of the city’s utility system was not included in the materials. Not every water or sewer line was included in our in house data sources. How could we obtain all those areas not covered by in-house data, especially in the older sections of town with little documentation into the GIS coverages? That final piece of the puzzle was solved when we received delivery of the new orthophotographs from the County that had a high enough resolution that we could find manhole and hydrants through visual inspection.
With the project method decided on, we now had to come up with a conceptual design on how all the data sources would come together, be reviewed, edited, and distributed to city staff. Also considered, was how the utilities would be updated over time once distributed to city staff in the field. In addition, an important consideration was how the utility information in the GIS could be used with other computer modeling software for engineering design and studies. We were required under this project to create three separate GIS coverages of city utilities, 1) water system, 2) storm water and 3) sanitary sewer.
The first, and in many cases, most critical consideration is the level of accuracy required for the project. We spent considerable time deciding on just how accurate our information had to be to make this work both in the GIS and for engineering purposes. In that regard, the city was in great shape. The city had its control network established by a consultant who GPS all our section corners and in the developed areas of town created an even denser control network. The GPS survey created a first order horizontal and third order vertical control network. Finally, the entire control network was set with a HARN correction. (1) When our GIS coverages were projected from NAD27 to NAD83, we took into account the HARN shift found during the conversion. (2) Therefore our base control network and the converted GIS coverages had excellent control and accuracy set in NAD83 (1997) coordinates.
The next step was to evaluate the accuracy of the orthophotographs, which would be the base upon which many of our facility placements would take place. We obtained information from DuPage County that the photographs had a specified accuracy level of plus or minus 3 feet. We verified this accuracy by viewing our control network overlaid on the photographs. In many cases the control points were clearly visible and could even be found in heavy tree cover on the photograph since the city had painted location markings over the control points in the field prior to the flight. In nearly every case our control point varied less than 3 feet of actual placement of the GPS control point. In many cases, the shift was around 1 foot from the actual control point location. Since the vast majority of our feature points generated would be obtained from the orthophotographs, we now had a verified accuracy level of plus or minus 3 feet for the utility coverages created within the GIS.
The next most important consideration in the conceptual design of this project was how to track the creation of the facility points from many different data sources over a long period. This information is important on a number of levels. First, how a given facility point was determined has a different relative level of accuracy. Our GPS derived facility points had a very high level of accuracy of under a foot. We also had the previously discussed accuracy level of plus or minus 3 feet for orthophoto derived points. Other features many have accuracy levels of greater than plus or minus 20 feet for field observed manholes plotted on paper. This information is important for creating a level of confidence during its use. Second, the knowledge of how a facility was placed will be important when staff questions the information provided in the GIS. This information can answer questions such as why is this facility shown in the GIS and not in other data sources such as subdivision plans? We can then trace back and find the history of how that facility was determined and report that information to staff. Finally, as the utility coverages evolve in the GIS over time, we can track the changes made to the system to determine if the change to a particular facility location would result in greater accuracy levels. For instance, do we shift a GPS derived facility points based upon as-built drawings, or reject the change? In addition, we can further refine the overall accuracy of the utility coverage by systematically eliminating all the low-level accuracy facility points over time. For example, we could select all the field survey determined points (with the worse accuracy level of plus or minus 20 feet) and contract that information out for GPS field survey work. In that way the overall accuracy level of the utility coverages in the GIS can be tightened up over time resulting in greater overall accuracy of the utility network.
We then determined the overall level of data we would create during the initial development stage of the project. Since we were dealing with a huge amount of data, just what should we capture as we created the initial facility points is a big question. For example during our field survey, we could remove manhole covers and determine if the manhole with a manhole lid saying "Sanitary" was actually a sanitary manhole and make invert measurements and other observations. We could also stop and make detailed measurements of facilities found in the field, rather than eye balling it on a paper map.
It was decided that our most important mission at this time was to create a utility coverage that would have a relative accuracy of +/- 3 feet. Trying to capture additional data on facilities at this time was premature, since the utility network was not known. Staff determined that it was more important to get the water line placed on the right side of the street, rather than know it is a 12 inch line. Also capturing and maintaining this data was premature since many of the features captured such as type of material, or invert elevations would be stored in a related data table related to a given feature in the GIS. Creating these tables would complicate the matter immensely if we needed to maintain data links to external databases as we edited the utility network during the course of the project.
After the initial utility GIS coverages were created, how would changes occur in the existing data sets? How would observations in the field be included in the GIS coverages? Right now, we envision making corrections to the utility coverages as field crews either make system improvements, or find errors during routine maintenance. We did not want to send out work crews to field check the data shown in the GIS. For one thing we did not have the extra time available to remove the field crews from their daily work schedules, and the information in the GIS has not been reviewed sufficiently by staff to warrant detailed field review.
We felt that once the GIS coverages were "finalized" we could then take additional information from actual field observations. How this data will be collected and integrated into the GIS is still under development. It is likely that field crews will be issued palm computers to allow for GPS locations and real time utility maps available in the field. Changes would be made and would be downloaded to the GIS server using docking stations for the palm computers at the end of the day. This new information would then be overlaid on the existing GIS utility data and adjusted using ArcFM Water tools, or other semi-automated methods. In this fashion data from the field is quickly entered into the GIS and incorporated into the original GIS data.
The final consideration in the conceptual design of the utility coverages in the GIS was to look at the demand modeling software places on the system. This would also impact the data model, if certain feature attributes would be needed to make software models such as HEC3 to work properly. The engineers were also unsure of which modeling software they would use in the GIS, with the exception of CYBERNET for the water system.
Upon review of a number of engineering modeling software packages, it was determined that many of their system requirements were similar to the requirements of ARCINFO, namely that the utility system be continuous and have good topology. We then determined that all software modeling systems should work with our conceptual design for the utility coverages in the GIS due to the simple nature of our data capture and adopted data model discussed below. Further scrutiny will take place on specific requirements of individual modeling software prior to additional work in obtaining more data in feature attributes. At that time it is also more likely that the engineers will have a better handle on the modeling software they wish to use in the GIS and we can focus our data acquisition efforts towards specific software requirements.
After our conceptual design work was completed, we were now ready to determine our data model for the GIS. We decided on the outset to make the data model as simple as possible. We did not want to capture a lot of data at this time due to the large number of features that would be created and the need to provide some flexibility in implementing new GIS software being created by Esri. This software includes Arc8 and ArcFM Water and their related object databases called geodatabases. We wanted to make our topological design and the related feature attributes as simple as possible so that they could take into account the changes in data management created by both Arc8 and ArcFM Water software.
With this in mind, we created a simple configuration of the classic GIS features and a large number of related tables using a unique ID number. Only the data items seen as essential to our work in initially creating the GIS coverages would be included as data attributes. Once the “final” placement of each utility is determined, we will then move each utility coverage into a geodatabase structure in order to take advantage of the new functionality included in Arc8 and ArcFM Water. The most important added functionality is the rule based editing procedures. The ability to maintain topological relationships when moving features such as manholes so that attached water mains remain in place. This will become especially important when we create individual service connections for sanitary sewer and water system as discussed below under Phase 2 of our work program.
For each utility, we created the same number, type, and database formats associated with each type of coverage. We used a standardized coverage naming convention to insure that arcs (lines) and nodes (manholes, hydrants) would not be confused with other utility coverages. An example of this would be node ID codes SA_ND_NO for sanitary sewer and WA_ND_NO for water and ST_ND_NO for the storm system. Table 1 shows the feature attributes for our sanitary sewer lines:
| 13 | SA_ND_NO | 12 | 12 | C | (unique ID number for a feature) |
| 25 | SA_ND_TYPE | 4 | 4 | C | (type of facility for nodes manholes etc) |
| 29 | SA_ND_LEVEL | 2 | 4 | C | (how the node was determined, GPS etc) |
Arcs have the exact same data base structure as nodes with the exception of one additional data item called SA_LN_SHEET. This attribute captured the as-built sheet number information we obtained for any line that had as-built design information.
Item SA_ND_TYPE would contain information on what type of facility is shown. For example SAMH for sanitary manhole, LIFT for lift station etc. Item SA_ND_LEVEL will contain information regarding how the placement of that facility was determined in the GIS. It is a numeric representation of each kind of data source used to create the GIS coverage. Table 2 shows a listing of SA_ND_LEVEL codes we used for this data base item.
| SA_ND_LEVEL | TYPE OF DATA SOURCE USED | RELATIVE ACCURACY |
|---|---|---|
| 1 | GPS | centimeters |
| 2 | Total Station | verified .2 of a foot |
| 3 | Orthophotos | verified +/- 3 feet |
| 4 | As Built Plans/WPA drawings | varies verified |
| 5 | Field observation on maps | +/- 20 feet |
| 6 | Original CAD data | used only for type of facility* |
* We did not use CAD data to determine facility locations, due to distortions created in the files to enable the information to be shown on 800 scale citywide maps. However, some of this information was field surveyed by staff and was used to determine the type of facility shown under the SA_ND_TYPE data items such as catch basins and storm water inlets.
At this time we have not created a unique feature ID (SA_ND_NO) since final determination of the facilities in the GIS coverages have not been made. This unique ID number will be utilized to create a link to other related data tables for both nodes (manholes, hydrants etc) and arcs (sewer lines, and services). The final format of this number is yet to be determined. However, we wish to generate an ID number that is geographic in nature, i.e. it has a geographic coordinate information contained in its structure. It could be based upon UTM coordinates or some other geographic coordinate system. It is also likely that a temporal element would also be placed in this feature ID number so that we could track the date of when the feature was created or last edited. Table 3 shows some related tables already identified for use in the utility coverages in the GIS:
| Sanitary Sewer | Storm Sewer | Water System |
|---|---|---|
| TV Tapes/Maintenance | Maintenance | Maintenance |
| Characteristics | Characteristics | Characteristics |
| Flow: actual/modeled | Flow: actual/modeled | Flow: actual/modeled |
| Images of as built | Images of as built | Images of as built |
| Ownership/Address | Watershed data | Ownership/Address |
| Water Billing |
Some important structural (topological) issues present themselves in creating a utility coverage in a GIS. Some are design requirements that run throughout all the utility coverages and some are specific to a particular utility coverage and not a basic requirement overall in all three coverages.
1) lines must intersect at nodes only
2) lines must intersect directly into a manhole at the angle the line and bisect nodes without any additional angle deflection
3) lines at times overlap (run on top of each other or cross) without intersecting. Arcs are not split in these cases.
1) storm water system which requires that all ponds and surface water features be connected by lines running through the pond and connecting with inflow and outflow structures
2) feature nodes for the pond is created artificially near the middle of the pond to place attributes of the pond, such as mean water level and total flood capacity. These feature types are unique for the storm water coverage only.
In Phase 2 of this project, all sanitary and water services to buildings from the mains will be completed. These features will be placed in separate coverages and brought into the GIS for graphic or software modeling purposes. We have created automated tools in ARCINFO which will create intersect locations along a water main based upon a given dimension. From this created node, new arcs to existing buildings or to an adjacent lot line if no building exists will be produced. In this fashion all services can be created and we can be insured that they are connected to a main and linked to a building for a service connection or service stub out at a property line.
We also have automated tools to link and unlink the service coverages to the mains for the water and sewer utility coverages. This is important for modeling purposes since mains cannot have flows split by services along a given length of pipe. Service connections to mains can be established when needed to determine customers who will be affected when a main is being serviced. We can then generate a mail listing of effected property owners since all the buildings will have associated address and ownership records linked to these features. Figure 1 shows the automated Arcedit menu for creating and labeling service connections.
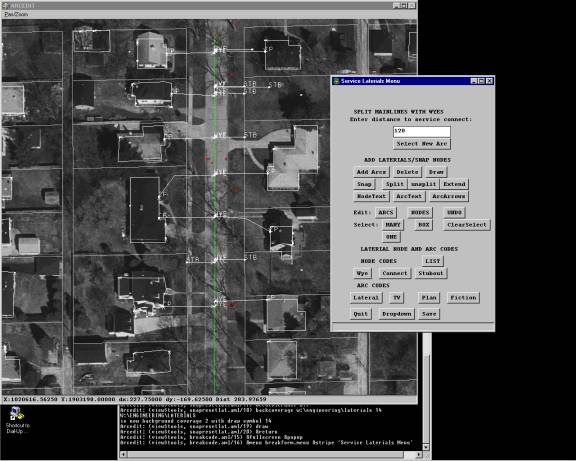
Service connections will be found using WPA maps, and sanitary TV logs which show lateral locations. Water service connections will use buffalo boxes found in the field and Water Department field books which show the locations of buffalo boxes and service connections in town. Any service connections not found in our records will be added to the service coverage and labeled as "estimated" in the GIS. In this fashion, staff in the field will know that the actual service connect points are not known in the GIS and proceed accordingly.
As with any GIS project the major expense and effort was in the data capture and editing phase of the project. We were as systematic as possible in our data capturing effort and the initial editing of the utility coverages was held to the minimum. We felt that each time we opened and edited a utility coverage, errors could be induced and additional documentation would be needed with each major editing effort.
We converted and placed into a GIS cover all data collected in the field from the total station and GPS surveys. We also placed digital point information obtained from engineers who were designing new subdivisions or large site plans for development within the community as required by city ordinance. (3) Point features loaded into the GIS point cover were then given standard item names to code type of facility and levels. All three existing data sources were placed in a label coverage call UTLPTS or utility point coverage and coded as label locations with level 1 (GPS) level 2 (total station and as built data from engineers).
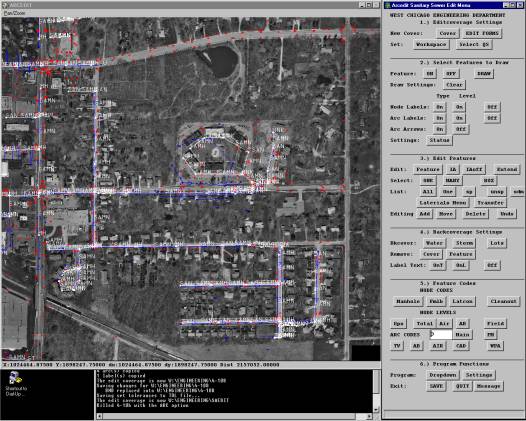
We then placed all our original TIF images in a catalog file for use in Arcedit. We used the original TIF file in a catalog since the compressed MrSid image file we utilize for most of our GIS work would not give us a high enough resolution of the image to work below 200 scale. We needed to work below 200 scale often in order to see enough contrast between pavement, grass areas, and existing manhole covers to determine point placement. A series of menus and amls were created for each utility coverage to help smooth the data capture effort and create a standard editing environment. This also aided in the reduction of errors created during a very active editing period. All features created using this method were labeled as level 3 points. The menus created are shown in Figure 2.
The entire city was observed using the air photographs and any utility locations found were given a new label point in the UTLPTS coverage. Hydrants were prominent due to shadows cast by the sun. Manholes and catch basins were also easy to find over pavement, with manholes located in grassy areas or covered by trees being the hardest to find. No attempt was made at this stage to code the labels, since we did not know if we had found actual utility locations. That would wait for direct field observations before coding the labels for type of feature.
We hired an intern last summer to go out in the field and label all points shown in the UTLPTS coverage. He did this work by creating a large number of 400 scale plots in Arcview which showed the label points in UTLPTS coverage and the city’s planimetric coverage which showed road pavements, driveways, sidewalks, buildings and other physical features. His first task was to identify the label shown in UTLPTS and indicate the type of facility shown. Manholes with water, sanitary to storm lids were used to label these points. Hydrants and other features (buffalo boxes, values etc) were also coded. His second task was to find any utility facilities that we may have missed and to indicate these facilities on the plot map. Once he returned to the office, he would use the air photo and the UTLPTS coverage to find these locations and place and include their type codes. If the facility could not be found on the air photo he was to place a new label point at the approximate location found in the field. The entire city was surveyed in this fashion and nearly 12,000 utility facilities were located and labeled in the UTLPTS coverage.
The next step was for me to "connect the dots" shown in the UTLPTS coverage by creating sewer or water lines to connect manholes labeled as sanitary or water manholes. This was done again using the same set of menus and amls which preset the edit environment to allow arcs to snap to underlying label locations shown as a background coverage as UTLPTS. This minimized errors due to standardized edit environments and tolerances and to snap to very good (GPS) or good (air photo) label points. These snapped locations became nodes along the sewer line network. A node table was created which allowed us to code the node locations for type and level.
The next few steps in the process was to begin to compare the new facilities created for both lines (arcs) and above ground facilities, manholes and hydrants (nodes) with the other data available for these features in the office. We first looked at the WPA maps created in the 1930’s for the older areas of the town. In general, we found the WPA maps to be very well done and highly accurate. The sanitary coverage was surveyed under this process and we moved a few manhole locations due to this data. Sanitary services were also surveyed in the WPA maps, and we are interested to see how accurate this work is when we get to Phase 2 of this project which will place all water and sewer services into the GIS.
The next group of data incorporated into the sanitary coverage was the sanitary TV tapes. All portions of the town had some TV data with some areas of town extensively covered. The TV equipment they used to find breaks in the line and service locations as part of their logs include distances between manholes. In talking with our engineers, it was determined that these measurements were in general good with some errors occurring in setting up the machine in the sewer and some tracking problems. The engineers determined that TV configuration would create errors of up to two feet in most cases. Therefore, when we reviewed all this data, if the manhole location varied by more than two feet from our existing sanitary coverage, we adjusted existing manhole locations. In general, the information shown in the sanitary coverage was very good and only a few manholes had to be adjusted to conform to TV manhole data. This made us feel good about our editing process up to this point and was further indication that we were on the right track.
The final in-house data included in the utility coverages was the as-built or design drawings found in our flat files in the engineering division. All of the plan sheets had been numbered and indexed. We reviewed all 3,000-plan sheets and incorporated any changes to the coverages. In addition, as part of this stage, any utility line shown in a plan sheet was coded into a data item called SA_LN_SHEET. This information could then be traced back to the original as-built as the reason for final determination of a given line. A utility line that did not change, but was confirmed by the as-built plans, was also coded into the utility coverages.
An added benefit of the sheet index number included in the coverage is the ability to link the as-built drawings with the GIS coverages. Since we already knew we would be scanning all our design sheets into a citywide document imaging system, we now have a link in place within our GIS utility coverages. This has already paid off in the initial use of the system with engineers questioning locations on the sanitary coverage, and being able to pull the plans to determine actual placement. We will start a pilot project this fall on scanning our design sheets into an imaging system and linking them to utility features included in the GIS.
Upon review of the information created, we found the sanitary coverages to be in very good shape. Very few lines were missing and in general, many of the lines and manholes shown in our sanitary coverage were back up by in-house data. We had succeeded in capturing all the paper records found in the city. The next step was to capture all the staff intelligence of the sanitary system. We are doing this through a series of staff reviews with our Street Department who maintain the sanitary system and our engineers, many of who oversaw the installation of the facilities.
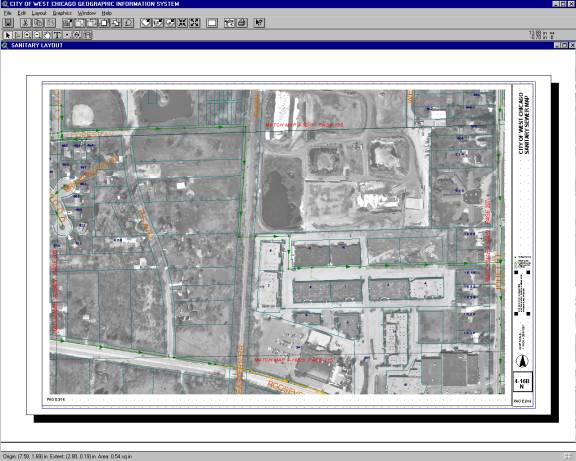
To start staff review we then created a sanitary atlas that showed our newly created sanitary GIS coverage on 1”= 200’ scale maps with air photographs and address information. Figure 3 shows an example of the sanitary atlas sheet. This was done for two reasons. First, we needed to show some product to the bosses after almost two years of effort. It would also allow staff to use a more accurate sanitary map than currently in use. (The before mentioned 800 scale city wide map) Second, the atlas was originally intended to be used by staff to submit their comments and edits to the information contained in the GIS. However, this idea was abandoned after we discovered a good method to create the sanitary atlas, which could also be used to edit the GIS coverages.
This new method was to create a series of templates in Arcview for each atlas sheet and then use ArcPress to create a postscript file of a given atlas sheet. This postscript file was then converted to PDF format using Adobe Distiller. Adobe Acrobat was then used to create a single document that contained all the atlas sheets and related materials. We then used a new HP 8500DN large format color laser jet printer to print an 11” x 17” atlas sheet that was at 200 scale. This atlas document was then submitted as a job during off-hours, such as over night, to allow the printer to be available during the day for other uses.
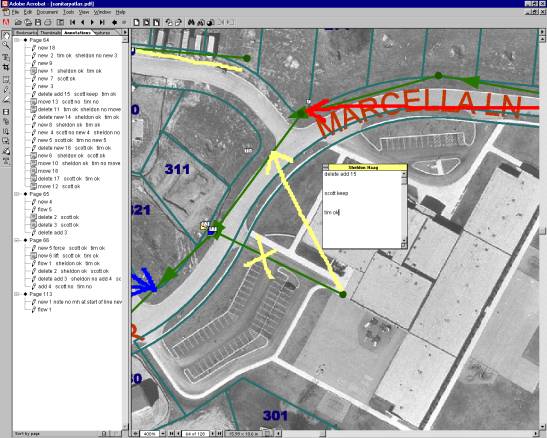
We then discovered that the editing tools contained in Acrobat could be utilized to edit the sanitary atlas. While Acrobat is intended to be used primarily as a text document-editing tool, many of the functions could be easily used for graphic edits. Acrobat would allow staff to markup the atlas on a per page basis. Furthermore, the atlas was contained in a single document and the edits saved as part of the document. Among the other tools Acrobat has which we found particularly useful in editing include the following:
1) Automatically tags edits by a person’s name and date and includes a pre-assigned color for the edits as shown on the atlas.
2) Allows additional comments to be placed on an edited feature by other staff reviewing the atlas.
3) Automatically assigns a number to each edit created per atlas sheet that can be used to reference edits created and to link edits together. An example of this would be calling for a sanitary line shown on the atlas to be deleted and then showing its new location either within the same edit number or at a different location distant to be shown as a single edit feature.
4) Allows staff to find edits on a given page quickly by selecting it from the annotated list of edits and having the edit appear in the atlas. You can also quickly look up what edits you have not signed off using this visual inspection, or by sorting the list by author, type of edit (arc or point), date, or listed by page number. Figure 4 shows an example of the sanitary atlas being edited using Adobe Acrobat.
Another big benefit in using Acrobat software is that it allowed multiple staff members the ability to submit edits and comment on other staff edits easily and allowed me to see the edits clearly on the computer. This should speed up placing the edits in ARCINFO since all edits will be on the screen in readable format.
Finally, on this part of the editing process, we created a manual that allowed staff to use this software and included a standard syntax for edits and signoffs. This was a simple notation system that would make all edits and signoffs submitted to the atlas by using a common format understandable by everyone. This accomplished two things first, it required very little typing on staff’s part to submit an edit and secondly it established a standardized notation method everyone used and could read. A portion of the staff editing manual is shown in Appendix I. When the edits are completed the edited atlas document will be archived for future references if changes called for at this stage are questioned.
The editing process by staff is very rigorous since this was the first time the entire sanitary sewer system of the city was under complete staff review. We wanted to make sure that everyone who had knowledge of the sanitary system would be allowed to get his or her comments into the process. Staff conflicts that call for two different solutions at a given location will have to be verified in the field. This can be easily done in Acrobat, since we can print the staff comments and markups and take these comments in the field for verification. Only those areas that have staff conflicts will be field checked under Phase 1.
Once staff edits are completed, we will incorporate the changes into the GIS. These changes will be “tagged” by staff members and dated so that any changes in positions will be based on the final action by staff review and can be called up if challenged. Once all the edits are completed, a new version of the atlas will be created which shows the changes generated during staff review. Since the atlas is printed and contained in three ring binders, we will send only those pages that include changes to be placed in the atlas. These pages will include revision dates in their title blocks to acknowledge the revision of the data. All field atlases will be placed in hard binders with the atlas sheets laminated to protect the map sheets from water damage and wear and tear by field crews. The coverage is now ready for conversion into a geo-database in Arc8 software since all in-house material has been reviewed by staff and documented.
The project was started during the fall of 1998. A complete listing of the major project benchmarks for the project is shown in Figure 6. All data points were created through air photography and from digital data dumps from outside sources that included total station survey, GPS survey and digital submittals from private firms designing new subdivisions in town. An intern spent the spring and summer of 1999 field verifying the data. This was done by generating a set of printouts of the created point file at 1:400’ scale maps and creating new points for facilities missed from our initial data sources.
These facilities were then labeled as to the type and level to be used in ARCINFO. The fall and winter of 1999 was spent heads up digitizing the utility coverages by connecting the dots or point locations shown. The winter of 1999 and spring of 2000 were spent comparing the created utility coverages with additional records and data sources found in the office. These included as-built drawings, sanitary TV tapes etc. End of spring 2000 was spent final checking the file for missing labels and a final determination of levels for each feature found in the utility coverage. In March of 2000, a sanitary atlas was created of the entire city at a 1:200 map scale.
In April of 2000, an integrated editing system was created using Adobe Acrobat software to allow staff to edit the sanitary atlas and review each other’s staff editing comments. Staff review of the sanitary atlas will be concluded by the fall of 2000. Staff edit conflicts will be identified and field verified and corrected in ARCINFO by the end of 2000. A revised sanitary atlas will be produced during the spring of 2001.
While staff is editing the sanitary sewer system, we will complete the initial draft of the storm water sewer network and publish an initial atlas for use by staff by the fall of 2000. This document will also be reviewed and edited by staff immediately after they complete the sanitary edits. While the storm water edits are under staff review, additional in-house data on the city’s water system will be undertaken using records and revised water system drawings done by the Water Department.
Upon completion of the storm water editing, a revised atlas will be published showing the finished storm water network by the spring of 2001. At that time, all effort will be placed upon finishing the water system with staff review and publishing of the atlas by the summer of 2002. The long time period for the creation of the water system is due to the complexity of the water system (since it does not use straight mains and additional data sources in the Water Departments field books). Table 4 shows the time lines for this project.
| Sanitary Sewer | Fa
98 |
Wi
98 |
Sp
99 |
Su
99 |
Fa
99 |
Wi
99 |
Sp
00 |
Su
00 |
Fa
00 |
Wi
00 |
Sp
01 |
Su
01 |
Fa
01 |
Wi
01 |
Sp
02 |
Su
02 |
Fa
02 |
Wi
02 |
Sp
03 |
Su
03 |
| Data Model | X | 0 | 0 | 0 | 0 | 0 | 0 | 0 | 0 | 0 | 0 | 0 | 0 | 0 | 0 | 0 | 0 | 0 | 0 | 0 |
| Air Photos | 0 | X | 0 | 0 | 0 | 0 | 0 | 0 | 0 | 0 | 0 | 0 | 0 | 0 | 0 | 0 | 0 | 0 | 0 | 0 |
| Field Survey | 0 | 0 | X | X | 0 | 0 | 0 | 0 | 0 | 0 | 0 | 0 | 0 | 0 | 0 | 0 | 0 | 0 | 0 | 0 |
| Data Survey | 0 | 0 | 0 | 0 | X | X | 0 | 0 | 0 | 0 | 0 | 0 | 0 | 0 | 0 | 0 | 0 | 0 | 0 | 0 |
| Draft Atlas | 0 | 0 | 0 | 0 | 0 | 0 | X | 0 | 0 | 0 | 0 | 0 | 0 | 0 | 0 | 0 | 0 | 0 | 0 | 0 |
| Staff Review | 0 | 0 | 0 | 0 | 0 | 0 | 0 | X | 0 | 0 | 0 | 0 | 0 | 0 | 0 | 0 | 0 | 0 | 0 | 0 |
| Staff Edits | 0 | 0 | 0 | 0 | 0 | 0 | 0 | 0 | X | 0 | 0 | 0 | 0 | 0 | 0 | 0 | 0 | 0 | 0 | 0 |
| Revised Atlas | 0 | 0 | 0 | 0 | 0 | 0 | 0 | 0 | 0 | X | 0 | 0 | 0 | 0 | 0 | 0 | 0 | 0 | 0 | 0 |
| Utility Models | 0 | 0 | 0 | 0 | 0 | 0 | 0 | 0 | 0 | 0 | X | X | 0 | 0 | 0 | 0 | 0 | 0 | 0 | 0 |
| Phase 2 Services | 0 | 0 | 0 | 0 | 0 | 0 | 0 | 0 | 0 | 0 | X | X | X | X | 0 | 0 | 0 | 0 | 0 | 0 |
| Revised Atlas | 0 | 0 | 0 | 0 | 0 | 0 | 0 | 0 | 0 | 0 | 0 | 0 | 0 | 0 | X | 0 | 0 | 0 | 0 | 0 |
| Storm Sewer | Fa
98 |
Wi
98 |
Sp
99 |
Su
99 |
Fa
99 |
Wi
99 |
Sp
00 |
Su
00 |
Fa
00 |
Wi
00 |
Sp
01 |
Su
01 |
Fa
01 |
Wi
01 |
Sp
02 |
Su
02 |
Fa
02 |
Wi
02 |
Sp
03 |
Su
03 |
| Data Model | X | 0 | 0 | 0 | 0 | 0 | 0 | 0 | 0 | 0 | 0 | 0 | 0 | 0 | 0 | 0 | 0 | 0 | 0 | 0 |
| Air Photos | 0 | X | 0 | 0 | 0 | 0 | 0 | 0 | 0 | 0 | 0 | 0 | 0 | 0 | 0 | 0 | 0 | 0 | 0 | 0 |
| Field Survey | 0 | 0 | X | X | 0 | 0 | 0 | 0 | 0 | 0 | 0 | 0 | 0 | 0 | 0 | 0 | 0 | 0 | 0 | 0 |
| Data Survey | 0 | 0 | 0 | 0 | X | X | 0 | 0 | 0 | 0 | 0 | 0 | 0 | 0 | 0 | 0 | 0 | 0 | 0 | 0 |
| Connencitivity | 0 | 0 | 0 | 0 | 0 | 0 | X | X | 0 | 0 | 0 | 0 | 0 | 0 | 0 | 0 | 0 | 0 | 0 | 0 |
| Draft Atlas | 0 | 0 | 0 | 0 | 0 | 0 | 0 | 0 | X | 0 | 0 | 0 | 0 | 0 | 0 | 0 | 0 | 0 | 0 | 0 |
| Staff Review | 0 | 0 | 0 | 0 | 0 | 0 | 0 | 0 | 0 | X | 0 | 0 | 0 | 0 | 0 | 0 | 0 | 0 | 0 | 0 |
| Staff Edits | 0 | 0 | 0 | 0 | 0 | 0 | 0 | 0 | 0 | 0 | X | 0 | 0 | 0 | 0 | 0 | 0 | 0 | 0 | 0 |
| Revised Atlas | 0 | 0 | 0 | 0 | 0 | 0 | 0 | 0 | 0 | 0 | 0 | X | 0 | 0 | 0 | 0 | 0 | 0 | 0 | 0 |
| Utility Modles | 0 | 0 | 0 | 0 | 0 | 0 | 0 | 0 | 0 | 0 | 0 | 0 | X | X | 0 | 0 | 0 | 0 | 0 | 0 |
| Water System | Fa
98 |
Wi
98 |
Sp
99 |
Su
99 |
Fa
99 |
Wi
99 |
Sp
00 |
Su
00 |
Fa
00 |
Wi
00 |
Sp
01 |
Su
01 |
Fa
01 |
Wi
01 |
Sp
02 |
Su
02 |
Fa
02 |
Wi
02 |
Sp
03 |
Sp
03 |
| Data Model | X | 0 | 0 | 0 | 0 | 0 | 0 | 0 | 0 | 0 | 0 | 0 | 0 | 0 | 0 | 0 | 0 | 0 | 0 | 0 |
| Air Photo | 0 | X | 0 | 0 | 0 | 0 | 0 | 0 | 0 | 0 | 0 | 0 | 0 | 0 | 0 | 0 | 0 | 0 | 0 | 0 |
| Field Survey | 0 | 0 | X | X | 0 | 0 | 0 | 0 | 0 | 0 | 0 | 0 | 0 | 0 | 0 | 0 | 0 | 0 | 0 | 0 |
| Data Survey | 0 | 0 | 0 | 0 | X | X | 0 | 0 | 0 | 0 | 0 | 0 | 0 | 0 | 0 | 0 | 0 | 0 | 0 | 0 |
| Water Records | 0 | 0 | 0 | 0 | 0 | 0 | 0 | X | X | X | 0 | 0 | 0 | 0 | 0 | 0 | 0 | 0 | 0 | 0 |
| Draft Atlas | 0 | 0 | 0 | 0 | 0 | 0 | 0 | 0 | 0 | 0 | X | 0 | 0 | 0 | 0 | 0 | 0 | 0 | 0 | 0 |
| Staff Review | 0 | 0 | 0 | 0 | 0 | 0 | 0 | 0 | 0 | 0 | 0 | X | X | 0 | 0 | 0 | 0 | 0 | 0 | 0 |
| Staff Edits | 0 | 0 | 0 | 0 | 0 | 0 | 0 | 0 | 0 | 0 | 0 | 0 | 0 | X | 0 | 0 | 0 | 0 | 0 | 0 |
| Revised Atlas | 0 | 0 | 0 | 0 | 0 | 0 | 0 | 0 | 0 | 0 | 0 | 0 | 0 | 0 | X | 0 | 0 | 0 | 0 | 0 |
| Utility Models | 0 | 0 | 0 | 0 | 0 | 0 | 0 | 0 | 0 | 0 | 0 | 0 | 0 | 0 | 0 | X | X | 0 | 0 | 0 |
| Phase 2 Services | 0 | 0 | 0 | 0 | 0 | 0 | 0 | 0 | 0 | 0 | 0 | 0 | 0 | 0 | 0 | X | X | X | X | 0 |
| Revised Atlas | 0 | 0 | 0 | 0 | 0 | 0 | 0 | 0 | 0 | 0 | 0 | 0 | 0 | 0 | 0 | 0 | 0 | 0 | 0 | X |
Having hard copy atlases is obviously just a temporary measure to allow us to distribute the created utility coverages quickly to staff in the field doing work on the system. However, it is an important one, since it accomplishes two things. First, it produces the information in paper format which staff currently uses and is comfortable working with in the field. Second, once the information is in their hands it becomes valuable to them directly and they will start to rely on the information contained in the atlas during system maintenance and expansion. The atlases will quickly become “their” atlas and they will assume ownership of the information and will want to keep it as current and accurate as possible.
Clearly, the overhead in producing and updating a paper atlas will become problematic over the long haul. For this reason, we will begin to place computers in the field to allow the atlas to be viewed directly from the GIS data available at that time. We originally thought we would place laptop computers in the work trucks but this restricts their usefulness and a number of fronts, especially locating existing facilities in the field or adding new location information for new facilities.
Due to the rapid improvements in wireless technology we may move directly into placing the utility maps on the Internet and remotely access the information on palm computers. This will also give us the flexibility to include GPS receivers on their palm computers and obtain good GPS placement of new or updated facilities in the field. Testing would have to occur on the accuracy obtained by small handheld GPS receivers vs. large survey grade GPS receivers in the field. For most uses in the city, such as police and building inspection, hand held GPS receivers will give accuracy of a couple of feet which should be sufficient for the GIS. However, for large pubic facilities such as a new water line, more accurate survey grade GPS may be required for horizontal and vertical accuracy needed for the placement of these facilities.
To use the GIS on palm computers, we may use Esri’s new ArcPad, ArcExplorer, or other very lightweight GIS viewer software that could run a GIS browser created in Java. A Java GIS browser is already envisioned for our viewer of choice for most desktop office applications using the GIS. In this fashion, a single piece of software could be used for all purposes, which would reduce training time and maintenance of the system over time. We will also attach digital cameras, bar scanners and voice activated software on the palm computers to allow photographs to be taken of new or existing facilities as needed and linked to the GIS. The bar scanners could be used for inventory and maintenance purposes with required data included in the bar to be scanned and loaded to the palm computer. In this fashion data related to that facility can be gained directly in the field and would not require extensive downloading of data from the city’s data servers over the Internet. Voice activation will allow data input into the databases without the heavy reliance on stylists or small keyboards making the palm computers easier to use in the field.
Finally, we are exploring ways to allow each division within the Public Works Department to do their own maintenance of the utility coverages. This is essential for the responsive editing to occur over time since it does not have to travel to the GIS staff and then back to the Water Department for review and additional editing. Also each division’s personnel will have first-hand knowledge of the system and maintenance of the GIS utilities over the long haul will be better than by doing the edits with GIS staff. The use of palm computers will enable data updates to the system to be downloaded to the city’s GIS server for quick incorporation into its respective utility coverage. This can be done by either transmission over the wireless network or more likely docking the palm computers into downloading/recharging stations directly into the GIS server.
The City of West Chicago is a beta site for ArcFM Water in order to determine if this software could provide the needed tools to allow staff to easily maintain the utility coverages in the GIS. ArcFM Water could assist this effort by applying a rigorous rule based editing environment that goes completely through the entire GIS data set to improve data maintenance by novice GIS users. It would be very time consuming to replicate this effort on our part through additional programming in ARCINFO and could be well worth the costs associated with purchasing ArcFM Water. There is also the potential added benefit of having the most widely used utility data model throughout the world for data sharing purposes provided ArcFM Water data model becomes the de facto standard with the GIS user community. This would make our data easier to share with other public and private interests who want to use our utility data outside of the City of West Chicago’s GIS applications.
1.) While the challenge to place utilities in the GIS using only in-house resources is indeed formable, it can be done. Our experience in West Chicago proves that point. There are more elegant methods that can be used to complete the project but they are in general expensive. A lot of value can be added to your GIS by including utility information that should allow the city to improve overall utility service and reduce costs.
2.) Many of the steps used to incorporate your in-house data would have to occur with or without a consultant’s involvement. You will still need to integrate your in-house data sources into your GIS, so you might as well start now. Even if you decide to use consultant's for data acquisition with GPS surveys much of the information regarding our utilities are locked away in these records.
3.) You need to provide a series of products over time to show progress in your effort and create momentum for the project. This project is long term to the extreme, but some useful information can be provided at different stages of product development to create excitement and show the potential of moving utilities into the GIS.
4.) The data model needs to incorporate long-range management tools to assist you in keeping the data current, and providing levels of confidence in that data. The need to know how a given manhole and line location was determined is critical in the overall usefulness of the product. Tracking changes to the system over time will save you time and money later by tracing the development of the system when questions arise from engineers and maintenance staff. It also places accountability in the review of the product, so that question can be directed to the right staff person who made the final determination of a facility.
In conclusion, placing utility information into your GIS with your own efforts is possible. There are still costs involved in doing this type of work in house, but the project is likely to incorporate many or all of your existing data sets and you will be further ahead in the long run. Placing utilities in your GIS will extend your technology in ways you can only imagine today. The value of having readily available accurate utility data for maintenance crews and engineering staff for engineering studies will pay for the cost of incorporating utilities in a short period of time.
Steve Capps, GIS Intern, City of West Chicago, Illinois for work on the utility coverages and assistance in creating this paper.
Frank Baxter, Esri Minneapolis; for assistance on the utility data model and the long-range plans of Esri in the utility field.
Carmi Niger, Esri Chicago; for assistance in becoming an ArcFM beta site and other technical assistance in the development of placing utilities in the GIS.
We will use Adobe Acrobat software to make our edits. The software will be loaded on your PC and you will be trained to use this software to make edits. You can also use the notes contained in this manual to help you make edits. This software should help us track edits made to the atlas, and make the editing process as smooth as possible. The sanitary atlas will be located on the city’s network and accessed using Acrobat.
All edits made to the atlas will use a standard syntax, so that edits can be easily made with limited typing, and be understandable to all staff reviewing the atlas. This syntax will also make it easy to find out if you have signed off on a proposed edit, and link proposed changes called for in your signoff. In this fashion at the end of the editing processes I can identify conflicts and make prints to be used in field verification, or make the appropriate change in the GIS.
Line or point symbol will appear before each edit created by the software Any edits placed by a staff member will have a unique color, his name, and the date the change was made.
( ) = Required function in edits or signoffs(action) {action} {feature} (anno #)
LINESAllowed words for {action} are the same as the required (action) edits: new, delete, flow and are used if a new location is shown.
Allowed word for {feature} for line edits: force (to be used for force main location)
(anno #) use the annotation number assigned by Acrobat for the change requested. The number will appear when you add a line or note to the atlas.
Examples of correct line primary edit syntax:
(new) (3)
(flow) (9)
(delete) {new} 12
(delete) {force} (14)
Allowed words for (action) for point edits: new, delete, move (anno #) use the annotation number assigned by Acrobat for the change requested. Allowed word for {feature} for point edits: lift (to be used to show lift station location with lift sta. number)
Examples of correct point edit syntax:
(new) (3)
(move) (9)
(delete) (14)
(new) {lift #3a} (24)
All edits called for by staff must be reviewed and either approved or challenged by each remaining staff member in the review process. This signoff syntax will make your comments known to others and link your challenges to a proposed change in the atlas. The signoffs of each edit will appear under each primary edit requested within the note assigned to that edit.
Click on the change shown on the atlas to open the note box for that edit request.
Hit return twice to give some space between your comments and the original edit or other staff member signoff:
(person) (review) { (action) (anno #) }
Allowed for names for (person): Tim, Sheldon, and ScottOk; agree to change
Keep; do not delete
No; do not agree with new location shown
Dk; don’t know, or have no information or idea where this feature is located.
{ (action) (anno #) } is used only when a staff member says no on his signoff. If he disagrees to the proposed change he lists his action and the annotation number assigned to location of proposed his change.
Allowed for { (action) }: new, delete(action) (review) { (action) (anno #) }
Examples of correct signoff syntax:
(Tim) (ok)
(Scott) (dk)
(Sheldon) (no) { (new) (15) }
Example of an correct edit syntax for a single edit:
PRIMARY SYNTAX EDIT: new 5
SIGNOFF SYNTAX: Sheldon ok
SIGNOFF SYNTAX: Scott no new 17
Under this syntax, Tim (who automatically has his name assigned on the note) called for a new sewer line annotation number 5. Sheldon okayed the change with Scott saying that the change is wrong and the new location is shown in annotation number 17.
(1) GPS Control in West Chicago; POB magazine, August 1999.
(2) Arc/Info PROJECT command using the XSHIFT and YSHIFT. Since the State of Illinois had not published the HARN shift for its control points we could not use the standard HPGN shift method included by Esri in the PROJECT command. Instead, we used the XSHIFT of 0.02 and a YSHIFT of 1.09 as determined by our HARN analysis of our control network. See POB article listed above.
(3) West Chicago City Code 4-9: Plus engineering fees in an amount equal to 2 ˝ percent of the cost of public improvements in connection with the subdivision. In the event that subdivision and/or as-built plans are not submitted in a CAD format compatible with the city’s mapping system, an additional fee in the amount of ˝ percent of the cost of such public improvements shall be charged.