Applications of GIS technology in business typically involve the concurrent or near-concurrent use of many different software applications, integrating data in many different formats that may reside in many different places in the enterprise. This is a radical departure from the traditional workstation GIS approach, in which the GIS software is the only application running, and the data is stored more or less within it. Business use of GIS also represents "GIS on the fast track", as business answers are typically demanded very quickly.
In this presentation, we will examine - and demonstrate - the use of GIS in combination with business productivity applications and tools to address and solve a business problem. The tools include:
Data sources to be integrated into the GIS include:
The specific application demonstrated is site selection for a regional U.S. retail bank specializing in consumer lending, and wishing to expand its reach nationally by adding physical presence. In the course of selecting the site, we will zoom in from a national level of geography, all the way down to the actual businesses lining both sides of the street adjoining the prospective site.
The key work product produced is an initial site recommendation, with supporting material in the form of a bivariate map accompanied by a series of reports in one layout, that can be printed in tabloid (11" by 17") form or viewed as an electronic presentation.
Operating Environment
While the computer system used to create this work would be considered at least mid-scale for general purpose business applications (K6-2 450 processor, 128 MB of SDRAM, 8MB 2xAGP, 7200 RPM HDD, high resolution trackball, 19" .26 mm monitor, 48X CD-ROM, Windows 95 SR2), it is less than optimum for our application. One of the key findings is that it takes quite a bit of computer resources to handle this work, particularly when ArcView is open, and/or when working with images that contain a lot of point data that are embedded into documents and presentations.
Identifying Prospective Sites
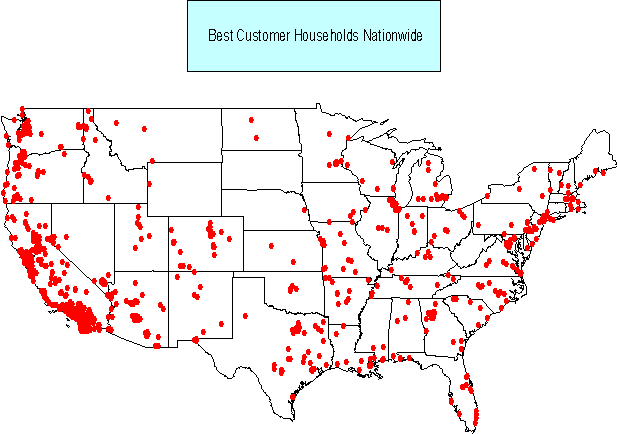
Defining Presence: Plotting Top 20% Profitability Customers On The Map
The first step is to identify the bank's best customers, and plot them on a map. The bank's MCIF system was used to create a query isolating the bank's top 20% profitability households. The result was exported to a table, and that table accessed from within the ArcView Business Analyst using the Additional Data option from the Business menu, within a study area defined as national.
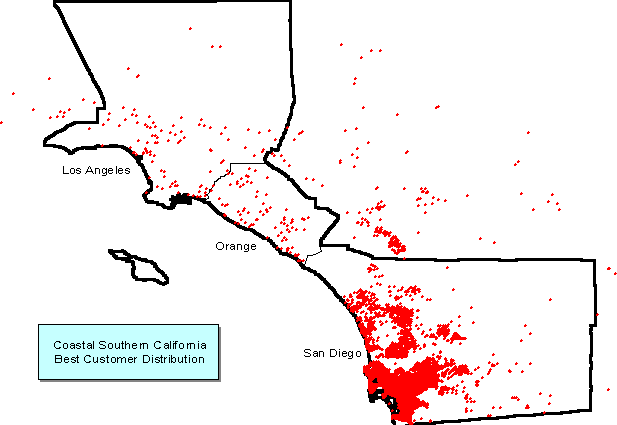
When the customer locations are plotted, the result is that the vast majority of high contribution households are identified as being in the state of California, particularly in Southern California. Based on this, we determined that at least one new site will be in the Southern California area, created a new study area based on Southern California, and imported the customer locations via Business-Customer Setup.
Developing A Profile & Identifying Target Geography
The Customer Profiling capability of Business Analyst was used next to create a demographic profile, based on the block group demographics from CACI that are contained in the Business Analyst (hopefully the Net Worth variables will appear in the AGS dataset as well in a future release). A very select group of only 6 variables driving financial services usage comprised the profiling items:
Once the profile was created, we set floor limits for each variable and populated a search profile, and had the Business Analyst define block groups for us that best matched it. The Business Analyst then added these profile-matching block groups as a theme to the project view.
The block groups targeted by the profile matching are in the following San Diego County communities:
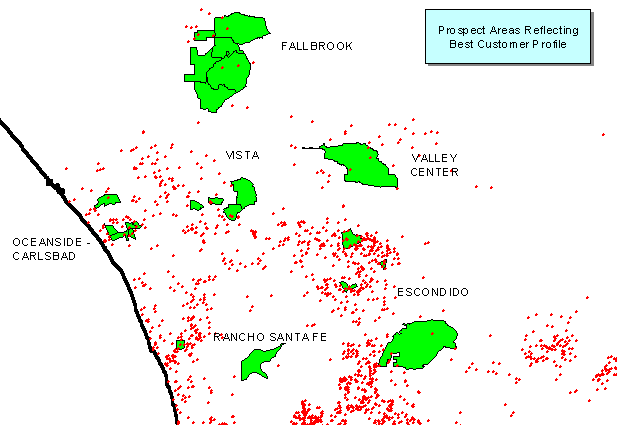
With the exception of exclusive Rancho Santa Fe, none of these areas would be an intuitive choice were one to simply guess at where the best prospect areas are. Then again, since the bank's best customers tend to be "average middle class Americans", one might expect to find them in those types of areas.
Adding In Market Potential Data
With this measure of potential in hand, based largely on projecting internally available data to the geography of interest, we next added a specific measure of financial services potential based purely on external data. Our measure of potential is RPM's MarketBank
Ô, which estimates consumer usage of basic financial services. In this case, the MarketBankÔ overlay of consumer loan balances revealed that the best targets defined by the Business Analyst are indeed in areas of good potential - reflecting the legacy business of the provider, consumer lending.In our retail network management paradigm, areas where both presence and potential are high are considered Dominate areas. Those where potential is high but presence low are Target areas; while areas of low potential but high presence are Maintain areas, and those where both penetration and potential are weak are Avoid areas. This classification can be represented in quadrants, as depicted in the chart.
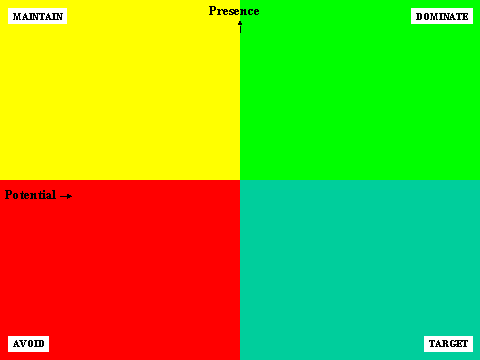
Based on presence and potential measures, the Escondido area emerges as a possible Dominate market, were the bank to have a significant presence there. We used the Business Analyst to conduct two last steps. We created a Comprehensive Trend report for Escondido using the Business Analyst Report Wizard, based on the CACI demographics, for supporting documentation (not for the tabloid layout); and created a new San Diego County study area, for which we extracted the GDT Dynamap streetfile for San Diego County. We then drew a bounding rectangle around the Escondido area on the streets theme, and converted them to shapefile for later mapping use.
Moving To The Atlas GIS 4.0 Environment
At this point, we moved to the Atlas GIS 4.0 environment to do some additional processing, and ranged symbol and bivariate mapping, for which Atlas is better-suited - particularly when a quick answer is demanded.
Adding In Branch & Competitor Data
The shapefiles created with the Business Analyst were opened in Atlas GIS 4.0, and saved in the native Atlas format. This is accomplished by noting the locations of each file in ArcView using Theme-Properties, and then navigating to these locations within the File-Open dialog in Atlas.
The next step is to add in current proprietary branch locations, as well as competitive location and trend data. The proprietary database resides and is accessed from the Facilities & Administration department server - however, no current offices are in the Escondido area. BranchInfo
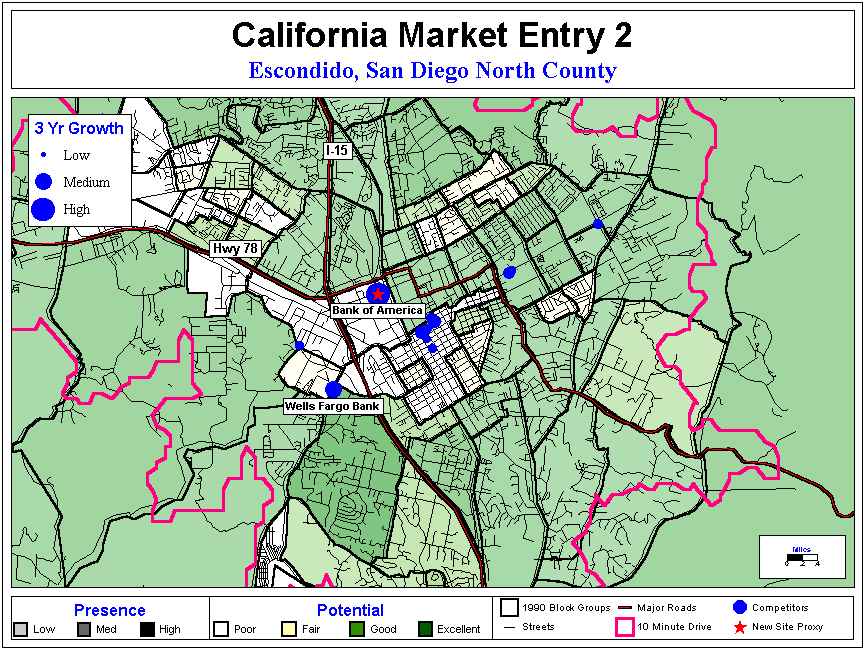
Ô from Ryan Willer Associates is used as the competitive database because it contains 5 years of growth and merger/acquisition history as well as location data.The competitive locations were mapped by proportional symbol in such a way as to highlight the past 3 year growth trend of competitors, with both low and high sizes set for the symbols in order to ensure adequate visual differentiation of branch growth.
Aggregating Customer Data To Block Groups
To facilitate spatial comparisons of presence and potential and enable bivariate mapping on like geo-types, we next aggregated the point-based customer data to block group regions using the Table-Aggregate Data function in Atlas GIS 4.0. Special care must be taken in this step to ensure that the structure of the customer database reflects field sizes that are large enough to accommodate the aggregated data, which in the case of bank balances grows very large very quickly when aggregated from points to regions.
Assigning Data By Location
Next, we used the Table - Assign Data By Location feature in Atlas to append key pieces of our "Presence" data - the table of customers aggregated to block groups - to the "Potential" table containing the MarketBank
Ô data. First, we used Table-Define Columns to add fields for the number of customers and their total balances to the MarketBankÔ table. Then, we assigned the data by location by "mapping" the corresponding fields.Creating The Bivariate Map
Since marketing (e.g. age-by-income) and general business (e.g. presence-potential) planning often concerns just two primary variables, being able to map the two driving variables together is very important - yet Atlas GIS is the only product capable of allowing an end-user to do this out-of-the-box. We selected the total balance fields for both current customers and MarketBankÔ potential, and allowed potential to be the controlling variable so that an area would have to contain positive potential to receive thematic emphasis on the map.
Also overlaid on the map are the competitive locations, themed by proportional symbol on 3 year deposit growth; and the streets and major roads in the area. Once created, the map is copied to the clipboard using the Edit-Copy Visible Page command in Atlas. It is then "pasted special" into Powerpoint, which is the "layout" environment we are using to create the final work product, as a scalable metafile image and globally re-sized -- avoid "dragging a handle" to resize, as this will alter the map scale.
Most critically, we were able to choose a prospective site area from the map. The Bank of America site on West Mission Ave was chosen as an initial proxy pending primary evaluation because of its high growth (though a very small, recently established office), proximity to the I-15 and Hwy 78 interchange, and positioning near both the downtown area and emerging northern suburbs. We used the File-Save As feature in Atlas to save this office as the proxy in its own layer. Then, we appended distance from the proxy to other branches by creating a Distance field on the branch layer, and populating it using Atlas' Assign Data By Location feature.
We then reviewed compatibility of nearby businesses by plugging the actual prospective site address into the InfoUSA Powerfinder, which allowed us to export listings of nearby businesses in DBF format. These nearby businesses represent a mix of traffic generators (mass merchandise, major supermarket, major drugstore) and quick visit-high throughput uses that should prove synergistic with a consumer loan office. We also created a 10 minute drive time polygon for the site using Freeway 2.1 from Applied Geographic Solutions, which produces such polygons faster than does the Business Analyst, and allows for more customization.
Creating Reports For The Tabloid Layout
Since the work product desired is in tabloid format containing a map and report data on one page, we chose to use Excel to develop quick reports that could then be cut and "pasted special" into Powerpoint as scalable pictures with the map. This is accomplished using the Edit-Copy Rows and Edit-Copy Statistics Window commands in Atlas and pasting into Excel, creating reports and graphs depicting market potential, competitors and surrounding businesses before these in turn were "pasted special" into Powerpoint.
Conclusions
The adoption of these practices has absolutely revolutionized the process of decision making on site selection in the client institution. More data from more sources is integrated more quickly, and mapped and presented more powerfully and quickly, than ever before. We were able to drill down from a national level of geography, all the way down to the actual businesses lining the street of a prospective site area 3,000 miles away from where analysis is taking place, within a matter of hours.
However, we also demonstrated that - as Duane Marble is fond of saying - mastery of software commands is a poor substitute for expertise. While the Business Analyst is a tremendous productivity tool for site selection, it does not yield one finite answer, and the results of its "wizards" are open to further calibration and analysis - and all analysis is pending primary evaluation.
Steve Lackow
Partner, Retail Profit Management
17130 Devonshire St, Ste 205
Northridge, CA 91325
Phone 818-831-7607
Fax 818-831-9078
E-Mail
Website
Powerpoint Layout