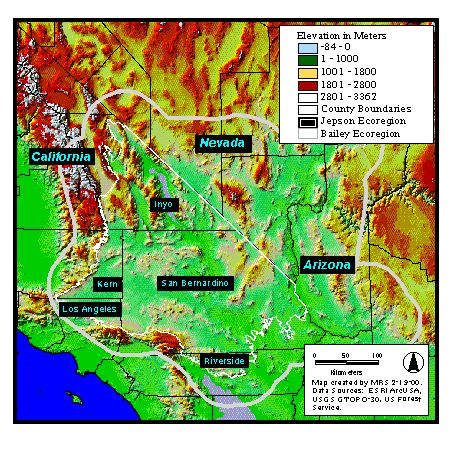
Figure 1. The Mojave Desert and the surrounding region.
Matthew R. Stevenson, Richard E. Toth, Thomas C. Edwards Jr., Lori Hunter, Robert J. Lilieholm, Kimberly S. Karish, James DeNormandie, Manuel Gonzalez, and Mary Cablk
Utah State University is modeling a range of alternative futures for the California portion of the Mojave Desert. This effort is part of a larger investigation hosted by the Desert Research Institute and sponsored by the Department of Defense Strategic Environmental Research and Development Program. We are using GIS to create several area-wide future scenarios based on a model showing regional development "trends" that integrate population projections. These alternative futures will depict total "build-out" of existing land use plans and policies as well as a scenario that will maximize conservation of biological diversity.
This paper details the methods we are using to model the future and may be useful to cities, counties, government agencies, councils of government, and others interested in the regional effects of development on human and natural systems.
The Alternative Futures Project at Utah State University is a component of a much larger effort, "Analysis and Assessment of Military and Non-Military Impacts on Biodiversity," which is being conducted by the Department of Defense Strategic Environmental Research and Development Program (SERDP), and includes collaborators from the Desert Research Institute, Oregon State University, and Harvard University. The study is focused on the California Mojave Desert, which is home to four large military installations: the Marine Corps Air Ground Combat Center (MCAGCC) at Twenty-nine Palms, the Army National Training Center at Fort Irwin, China Lake Naval Weapons Testing Center, and Edwards Air Force Base. The project is intended to address the relationships and interactions between the military installations, the surrounding cities and towns, and the biological diversity of the region. More specifically, the military is acutely aware of the possibility that increasing urbanization in nearby cities may drive species onto their installations as bases are surrounded by development. As federal entities, the military bases must adhere to all Federal regulations, including the Endangered Species Act. As urbanization continues to expand throughout the Mojave, the military is faced with the possibility that their bases may become islands of habitat within a sea of development, which could severely hamper their ability to carry out their mission.
The Alternative Futures team was charged primarily with creating a user-friendly process for generating alternative futures as a method for examining the consequences of various land use planning and land use management decisions. Although the process is the primary product, the team created several future scenarios to illustrate the types of output that can be generated. The process and the scenarios are discussed at length below.
The Mojave desert is located in the southwestern United States, covering more than 20 million hectares spread across four states: California, Nevada, Arizona, and Utah. Our study area is focused on the California portion of the Mojave desert, which encompasses parts of five counties: Inyo, Kern, San Bernardino, Los Angeles, and Riverside. It is home to 30 cities and towns, including Twentynine Palms, Lancaster, Barstow, and Victorville. Over three quarters of the Mojave is owned by the federal government, with the Bureau of Land Management and the National Park Service being the largest land holders (Table 1).
Figure 1. The Mojave Desert and the surrounding region.
Table 1.Land ownership in the Mojave Desert
| Owner | Hectares | Percent Total |
|---|---|---|
| National Monument/Seashore | 206 | <0.01% |
| USFWS | 1,379 | 0.02% |
| Native American | 1,584 | 0.02% |
| County/City/Regional | 2,637 | 0.04% |
| Forest Service | 18,917 | 0.26% |
| State Land | 165,890 | 2.24% |
| Wilderness | 742,617 | 10.04% |
| Military | 1,066,317 | 14.42% |
| Private | 1,542,337 | 20.86% |
| BLM | 1,804,198 | 24.40% |
| National Park | 2,047,635 | 27.69% |
| Total | 7,393,717 | 100.00% |
| Percentage in Federal Ownership | 76.84% |

Figure 2. Land Ownership in the California Mojave Desert.
The Mojave Desert is one of three hot deserts in North America and its boundaries are roughly coincident with the distribution of the Joshua Tree (Yucca brevifolia), the largest of the yuccas. (MacMahon and Wagner, 1985). The region is characterized by basin and range topography, with numerous compact mountain ranges scattered on an otherwise flat plain. There is tremendous vertical relief in the Mojave: the lowest elevation in the United States is located at Badwater in Death Valley National Park, and the summit of the Panamint mountains reaches well over 11,000 feet. The Mojave is home to 266 terrestrial vertebrate species, 4 of which are federally threatened, endangered, or protected, and 9 of which are state threatened, endangered, or protected. The desert is also home to over 2,600 vascular plant species, and approximately 32 endemic terrestrial vertebrate species which are found nowhere else.
The process of modeling alternative futures in the Mojave is centered around what we have identified as the three primary drivers of landscape change in the Mojave Desert: socio-demographic, economic, and biophysical (Figure 3). Each driver uses a different model or models, a unique set of data, and a set of assumptions specific to that driver. The drivers are combined with one another to generate scenarios; generally, the process begins with the socio-demographic driver, which feeds into the economic urban growth model, which then interfaces with the biophysical model to generate impact assessments. The futures are being created with a geographic information system using Esri's ArcInfo, GRID, and ArcView programs in a UNIX computing environment with grid-based data. All grids have a one hectare (100 m by 100 m) resolution, and we used the UTM Zone 11 projection with the GRS 1980 spheroid and the NAD83 datum.

Figure 3. Project Methodology for the Mojave Desert Alternative Futures Project.
The population projections for the California Mojave are based upon county population projections generated by the California State Department of Finance. The State population projections use "a baseline cohort-component method to project population by gender, race/ethnicity and age. . .A baseline projection assumes people have the right to migrate where they choose and no major natural catastrophes or war will befall the state or the nation" (Heim, 1998).
The primary difficulty in using county-based population projections is that political boundaries and ecological boundaries rarely coincide. Our study area contains portions of five counties; consequently, county-based population projections are inappropriate. In order to disaggregate the county totals to the sub-areas within the Mojave, we summed the population for all the cities and towns in the Mojave portion of Los Angeles, Kern, and San Bernardino counties for 1970, 1980, and 1990. This figure was then used to determine the share of total county population found within the Mojave for each county for each of the three years, and the trend of the change in the relationship was projected into the future, providing a population projection specific to the Mojave. The Mojave is projected to undergo tremendous population growth over the next 20 years, with a concomitant expansion in urbanization (Table 2).
Table 2. Population Projections for the Three Developed Mojave Desert Counties.*
| 1970 | 1980 | 1990 | 2020 | |
|---|---|---|---|---|
| Los Angeles County | 19,178 | 72,820 | 190,262 | 564,847 |
| Kern County | 26,122 | 36,128 | 55,656 | 147,093 |
| San Bernardino County | 71,655 | 101,945 | 223,779 | 634,742 |
| Total | 116,955 | 210,893 | 469,697 | 1,346,682 |
*Population projections were not generated for Riverside and Inyo counties due to the low population levels within the Mojave portion of those counties
The economic driver centers around the factors that influence the location of urban growth. This driver operates on the premise that the best indicator of where urban growth will occur in the future is where it has occurred in the past. Towards that end, we adapted the California Urban and Biodiversity Analysis model (CURBA) to the Mojave (Landis et al., 1998). There are four main elements to projecting urban growth with CURBA: first, determine where urban growth has happened in the past; second, identify other explanatory variables; third, use the explanatory variables in a logit model to create a probability surface that ranks the likelihood of development on a scale from 0 to 1; and finally, to "populate" the probability surface using the Mojave population projections.
The extent of urbanization for 1970 and 1990 was derived from North American Landscape Characterization Data (NALC). Urban and suburban areas were interpreted from the NALC data by displaying band combinations that accentuated anthropogenic features from the natural brightness or darkness of the surrounding unaltered desert environment. Similarly, the distinctive patterns of human settlement in the Mojave were also used to delineate urban areas. Development was digitized on screen and the vectors were converted to raster. The completed images were converted into GRIDS using the imagegrid command in ARC/INFO. The grid for the extent of development in 1970 was subtracted from the grid for the extent of development in 1990 to yield the location of new development between 1970 and 1990, where 1 represents development and 0 represents no development. This grid served as the dependent variable in our logit model.
We identified six variables that are primarily responsible for the location of urban development in the Mojave Desert. These are distance to existing development, percentage of surrounding development, distance to primary roads, distance to secondary roads, presence within an incorporated city, and percent slope. The distance variables were generated using the eucdistance command in GRID, which generates the true Euclidean (as opposed to cell) distance from the source grids to every other cell. The percentage of surrounding development variable was generated using focalmean in GRID with a 20 by 20 moving analysis window. Existence within an incorporated city was expressed as a categorical variable where presence within a city was assigned a 2 and everything else was assigned 1. The percent slope variable was generated using the SLOPE command in GRID. All grids were derived from data sets originally compiled by the Mojave Desert Ecosystem Program (MDEP, 1998).
To run the logit model, we used the sample command in GRID to create an ASCII text file listing the category of new development (0 or 1) for every cell of private land and the corresponding values for each of the six independent variables. The generalized form of this model is as follows:
Pi = 1 / 1 + e -(Bo + BnXi)
Where:
Pi = the probability of an event occuring
e = the base of the natural logarithm
Bo, Bn = coefficients
Xi = independent variables
Parameter estimates (Table 3) were developed for each of the independent variables using SAS. Our best model is 87.1% concordant and has a max-rescaled R-square value of 32.06% (Table 4).
Table 3. Analysis of Maximum Likelihood Estimates.
| Parameter | Standard | Wald | Standardized | Odds | ||
|---|---|---|---|---|---|---|
| Estimate | Error | Chi-Square | Pr > ChiSq | Estimate | Ratio | |
| Intercept | -2.2083 | 0.0141 | 24473.7125 | <.0001 | ||
| Perecent Surrounding Development | 5.4369 | 0.0481 | 12790.844 | <.0001 | 0.1376 | 229.727 |
| Percent Slope | -0.0485 | 0.00186 | 681.7802 | <.0001 | -0.1137 | 0.953 |
| Distance to Development | -0.00003 | 4.317e-07 | 5608.7175 | <.0001 | -0.6954 | 1.000 |
| City Category | 0.9288 | 0.0088 | 11133.9864 | <.0001 | 0.1584 | 2.532 |
| Distance to Secondary Roads | -0.00382 | 0.000031 | 15098.404 | <.0001 | -2.1083 | 0.996 |
| Distance to Primary Roads | -0.00013 | 1.136e-06 | 12587.8025 | <.0001 | -0.5351 | 1.000 |
Table 4. Association of Predicted Probabilities and Observed Responses.
| Percent Concordant | 87.1 |
|---|---|
| Percent Discordant | 12.5 |
| Percent Tied | 0.4 |
| Somers' D | 0.746 |
| Gamma | 0.749 |
| Tau-a | 0.085 |
| c | 0.873 |
| Max-rescaled R-Square | 32.06% |
The parameter estimates generated in SAS were then used in GRID to generate a probability surface that ranks the likelihood of development for all private land. Hence, the final product of the economic driver is a floating point grid with values ranging from 0 to 1, with 0 representing no probability of development and 1 representing almost certain development. The specific command used to generate the probability surface follows:
probability = 1 div (1 + (exp(-((-2.2083) + (5.4369 * pctdev) + (-0.0485 * slope) + (-0.00003 * devdist) + (0.9288 * citycat) + (-0.00382 * seconddist) + (-0.00013 * maindist)))))
Given the vast extent of the Mojave Desert and the need to assess several aspects of biodiversity, the futures team adopted a hierarchical approach to biophysical relationships. The approach illustrates the biological complexity of the region through inclusion of vertebrates in multi-species, focal species, and single species segments. The multi-species level considers all terrestrial vertebrate species present within the study area. The focal species level considers selected species in more depth. The single species level considers field-based research of a small number of reptiles existing within the study region, including the Desert Tortoise (Gopherus agassizii).
The multi-species portion of the futures team has refined the species distribution models for all terrestrial vertebrates predicted to occur in the Mojave Desert ecoregion. Distribution models were obtained from the California Department of Fish and Game's (CDFG) California Wildlife Habitat Relationships (CWHR) program. These distribution maps served as the starting point for the multi-species modeling. The distribution maps reflect the general expanse of land and range of elevations where each species is predicted to occur and are developed from the relationship of each species to particular habitat types. Predicted distribution of a species is a combination of known and hypothetical factors such as historic and point data, habitat types, location of resources, species' natural history, and physiological limitations. We further refined the CWHR species models by eliminating areas of distribution from the coverages based on the landform, elevation, and hydrology natural history information for each species, gathered from the CDFG California's Wildlife handbooks (Zeiner et al., 1999). The species distributions used in the multi-species level of analysis represent models that integrate all possible information gathered from the handbooks. The result of this effort is a series of range maps for many of the species with significantly reduced, more accurate potential distribution areas.
The refinement process was completed for all terrestrial vertebrates in the Mojave Desert. The following three images depict the refinement process for one reptile species, the Lyre snake (Trimorphodon biscutatus). The original map (Figure 4) is taken directly from the CDFG predicted habitat distributions. The second map (Figure 5) illustrates the first step of the refinement process; it uses elevation cutoff information to further delineate habitat distribution. The third map (Figure 6) restricts the species further to suitable landforms. An additional step, which is not illustrated here, is a hydrological restriction that refines the distribution of species affiliated with water sources. If the species is determined to be dependent on water for its survival, the refinement restricts its potential distribution in the areas where water is predicted to be present, to a buffer zone around water sources equal to the species' home range.

Figure 4. The initial distribution for the lyre snake (Trimorphodon biscutatus) as received from the California Fish and Game Wildlife Habitat Relationships Program.

Figure 5. The first refinement of the original distribution, restricting the distribution to the species' known elevation range.

Figure 6. The second refinement, which eliminates landforms where the species is not found from the first refinement map.
A biodiversity index is a type of measurement, or assessment, of the biological wealth of an area based on a specific calculation. Species richness is the simplest of the indices to calculate. The species richness value for a location is the sum of all species present at that location. For our analyses, the Mojave Desert was divided into 100 square meter grid cells. The species richness value of a cell was calculated by summing the number of all species with a predicted refined distribution encompassing that cell. This index was calculated for the entire desert, for each taxon and all taxa combined. Species richness was also calculated only for Federal or State endangered, threatened, and protected species. By pulling out protected species from the entire list, the maps depict potential areas of concern for species that have laws protecting them from disturbance.
A rarity map was created to depict the areas within the desert that contained the highest concentrations of rare species. Species are given rarity rankings for their status globally and statewide by the California Natural Diversity Data Base (CNDDB), a program of the Natural Heritage Network. We used the statewide rank in all of our calculations due to the boundary of our study area. Ranks range from 1, extremely endangered, to 5, demonstrably secure. Only those species the CNDDB is interested in tracking are given rankings; however, all protected species are ranked except for protected birds that do not nest in California. The rarity map depicts the average rarity ranking of each cell that contains one or more rare species. The cells with the lowest values contain species that are more rare.
An endemic species is an organism that exists only within a defined area. In our study, the defined area is the Jepson boundary of the Mojave Desert ecoregion. To the south of the Mojave Desert is the Sonoran Desert. The boundary of the two ecotones does not have a distinct line which animals endemic to the deserts can discern. Animals were given a ranking of one if they were considered endemic to the Mojave based on range maps and natural history information. A richness map was then created to identify those areas of the desert which have the highest numbers of endemic species.
The Alternative Futures team produced seven scenarios that model the effects of various assumptions about future land use policies and land management decisions. With the exception of the Plans Build-out scenario, each of the scenarios contains four permutations, making a total of 25 scenarios (Table 5). The permutations are described in detail below.
Table 5: Scenario names and descriptions
| Scenario Name | Description |
|---|---|
| Trend | Model the likely pattern of urban development on private land based upon past trends of development in the region. |
| Plans Buildout | Combine all land use plans from local governments in the studyarea and build out or "populate" all currently developable landuse classes. |
| New Roads | Illustrate potential changes in the pattern of development that might occur with the construction of several new primary roads. |
| Exchange 1 | Swap private land with low development probability and high biodiversity value for public land with high development probabilty and low biodiversity value. |
| Exchange 2 | Establish a three mile buffer around all military installations and trade a comparable amount of public land to private land ownership. |
| Exchange 3 | Swap all inholdings of private land within Status 1 land with public lands having a high probability of development. |
| Exchange 4 | Establish a 10 mile buffer around flight paths within the R-2508 Complex and exchange public lands falling within the buffer for a comparable amount of public land outside the buffers. |
The Trend scenario depicts what the Mojave might look like if present development trends continue. We assumed that all private land was open to development regardless of its planned use because land use plans are regularly revised and updated to accommodate new growth. The population forecast produced by the socio-demographic driver was used in conjunction with the probability surface created by the economic driver to populate the 2020 landscape. In order to determine the density at which the landscape should be populated, we divided the 1990 Mojave population by the number of urbanized hectares for 1990 and arrived at a population density of 3.76 people per hectare. For the trend scenario, we chose to hold this figure constant.
To actually populate the probability surface, we multiplied the probability surface by 10,000 and converted it from floating point to integer. This grid was added to ArcView, the feature table was opened, and the value field was sorted in descending order. Cells were selected interactively from the feature table starting with the highest probability cells and adding increasingly lower probability cells until the desired number of one hectare cells had been reached (this was verified by using the Statistics command on the Count field). After the probability had been determined, all cells that were greater than or equal to this value were selected out from the probability surface in GRID and reclassed as 1. In the case of Trend, this meant placing a projected increase in population of 876,985 people on the landscape at a density of 3.76 people per hectare, which equates to 233,241 new cells to be developed. However, due to the nature of the probability surface, as the probabilities decrease, the number of cells with the same value increase. Consequently, it is virtually impossible to get precisely the right amount of cells (Table 6).
The first permutation of the Trend scenario is to increase future settlement density. If local governments were to pursue an aggressive suite of land use policies designed to increase the overall development density in the Mojave, far less land would be developed. We chose to increase the density of the Trend scenario to 20 people per hectare, which equates to the populating of 43,849 cells.
The second and third permutations of Trend were created by assuming that the population projection is too low, and an additional increase equal to fifty percent of the original projection will occur by 2020. This increase was applied to the landscape at both the 3.76 and 20 people per hectare population densities.
Table 6: Ideal and Actual Number of Populated Cells for the Trend Scenario
| Permutation Name | Projected Increase | Ideal Number of populated cells |
|---|---|---|
| Trend (3.76 people/ha) | 876,985 | 233,241 |
| Trend 3.76 + 50% | 1,315,478 | 349,861 |
| Trend (20 people/ha) | 876,985 | 43,849 |
| Trend 20 + 50% | 1,315,478 | 65,774 |
| Permutation Name | %Prob. >= to pop. | Actual Number of populated cells | % Difference |
|---|---|---|---|
| Trend (3.76 people/ha) | 10.43 | 233,223 | 0.008% |
| Trend 3.76 + 50% | 8.12 | 349,723 | 0.039% |
| Trend (20 people/ha) | 23.60 | 43,842 | 0.016% |
| Trend 20 + 50% | 18.32 | 65,793 | 0.029% |

Figure 7. Trend at a Population Density of 3.76 People Per Hectare

Figure 8. Trend at a Population Density of 20 People Per Hectare

Figure 9. Trend at a Population Density of 3.76 People Per Hectare Plus a Fifty Percent Increase in the Population Projection
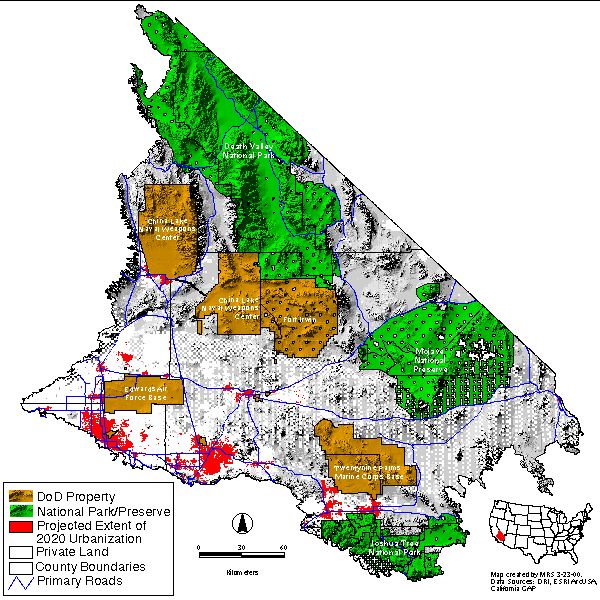
Figure 10. Trend at a Population Density of 20 People Per Hectare Plus a Fifty Percent Increase in the Population Projection
The Plans Buildout scenario depicts the effects of completely building out all of the existing local land use plans. We constructed this scenario by acquiring, purchasing, or digitizing the land use plans for all of the local governments in Los Angeles, San Bernardino, and Kern counties. The land use categories in each of the six plans were cross-walked to one of nine different categories: open space, rural, suburban, industrial, special plan, urban, commercial, public facilities, and not categorized (Table 7). For the purposes of the scenario, we assumed that open space would not be developed. All other categories of planned land use were recoded to 1 to represent development.
Table 7: Planned Land Uses by Area
| Land Use Class | Hectares | % Total |
|---|---|---|
| Open Space | 827,578 | 55.61% |
| Rural | 419,020 | 28.15% |
| Suburban | 91,164 | 6.13% |
| Industrial | 48,522 | 3.26% |
| Special Plan | 48,414 | 3.25% |
| Urban | 18,396 | 1.24% |
| Commercial | 16,730 | 1.12% |
| Public Facilities | 13,784 | 0.93% |
| Not Categorized | 4,657 | 0.31% |
| Total | 1,488,265 | 100.00% |

Figure 11. Plans Buildout
The new roads scenario shows the effect that newly constructed primary roads might have upon the future pattern of development. This scenario was constructed by digitizing new primary roads into the original primary roads coverage, recalculating the Euclidean distance, and generating a new probability surface with the original parameter estimates. With the exception of the primary roads grid, none of the other independent variables were modified for the creation of this scenario.

Figure 12. Infrastructure Upgrades: New Roads
The pattern of land ownership in the Mojave Desert is complex. As described above, the federal government is the primary land holder in the study area, and although just over 20 percent of the land is privately owned, much of this land is interspersed with Federal land in a "checkerboard" pattern. The checkerboard is a relic of nineteenth century federal land grants such as the Railroad Act of 1864 that gave land to railroads as an incentive to complete the first transcontinental railways. The legacy of these programs is a pattern of ownership that can make management of federal land and development of private land exceptionally difficult. The following four scenarios were constructed under the assumption that the federal government and the owners of private inholdings might be able to exchange some of their land as a way of consolidating their otherwise fragmented properties.
The initial purpose of Exchange 1 was to swap private land with low development probability and high biodiversity value for public land with high development probability and low biodiversity value. For this scenario, "high biodiversity" was determined using a composite biological index created from three separate grids representing species richness, rarity, and endemism in the Mojave as described above. Unfortunately, much of the land that is privately owned and high in biodiversity is also high in development probability. Similarly, some public lands that are high in development probability are also high in biodiversity. Consequently, we decided not to develop any areas that were high in biodiversity on either public or private land.
This scenario was created in two steps. First, we needed to generate a probability surface for public lands near existing development. We converted the extent of 1990 urbanization grid into a polygon coverage, generalized the coverage, and created a 24,140 meter (~15 mile) buffer. The buffers were clipped to the extent of our study area and converted into a grid. The grid was set as a mask, and the independent variables for the growth model were restricted to the extent of the mask using the selectmask command. Then we applied the parameter estimates listed in Table 3 to the independent variables to create a probability surface. We selected all cells with a probability greater than or equal to five percent and recoded them to 1. Five percent was selected as the threshold for consideration in the exchange because the Trend at 3.76 plus fifty percent population scenario frequently populates cells down to a probability value of six percent or less.
In the second step we selected all values greater than or equal to 45 (on a scale of 1 to 100) from the biological diversity value grid and recoded them to 1. This value was arbitrarily selected as an apparently appropriate balance between conserving nothing or conserving everything. To remove areas of conflict from undeveloped private and undeveloped public land, we added the two grids together to create a "conflict" grid. Cells with a value of two represented a conflict between high biodiversity and high probability of development. All values of two were set to nodata using the setnull command, and the conflict grid was set as a mask. Areas of conflict were removed from the high probability of development on public land grid, and the result was converted to a polygon coverage.
Next, the high probability of development on public land coverage was unioned with the original ownership coverage. Public land falling within the areas of high development probability was recoded as private land in ArcView. Similarly, the high biodiversity on private land grid was converted to a coverage, unioned with the modified ownership coverage, and all areas of high biodiversity on private land were recoded to public. We chose to recode from private to BLM because the BLM has been the most active Federal land owner in the Mojave with regard to land exchanges. The resulting coverage was converted to a grid, private land was selected from this grid, the probability of development grid was masked to the new configuration of private land, and the probability surface was populated in the same fashion as the Trend scenario.

Figure 13. Land Exchange 1: Biodiversity Swap
This scenario depicts the effects of one potential solution to the problem of "urban encroachment" on military installations. We established a three section (three mile) buffer of publicly owned land around all five major military installations and exchanged the private land falling within this buffer for a comparable amount of publicly owned land close to existing urbanization.
This exchange was also created in two steps. The first was to buffer all military properties in the Mojave by a distance of 4,828 meters (~3 miles). The resulting coverage was edited in ArcEdit to remove buffers around the smaller, mostly urban installations. The buffers were clipped to the studyarea boundary and unioned with the original ownership coverage. All private land falling within the three mile buffer was recoded to public in ArcView.
In the second step, the extent of urbanization in 1990 was buffered to a distance of 8,047 meters (~5 miles). The resulting coverage was clipped to the study area boundary and erased by the buffered military property coverage, then unioned with the ownership coverage. All BLM land falling within the urbanization buffer was recoded to private in ArcView. The new ownership coverage was converted to a grid, the private land was selected from this grid, the probability of development grid generated for Exchange 1 was masked to the new configuration of private land, and the probability surface was populated in the same fashion as the Trend scenario.

Figure 14. Land Exchange 2: Urban Encroachment Buffer
"Status 1" is a classification of land management that was created by the National Gap Analysis Program (Scott et al., 1993) to denote lands that are managed primarily for the conservation of biodiversity. Due to the fragmented nature of land ownership in the Mojave, many of the Status 1 lands (e.g., wilderness areas and national parks) that were designated in the twentieth century contain numerous inholdings of private land. Exchange 3 was designed to consolidate all of these inholdings and transfer them to public ownership and exchange them for approximately half as much public land with high probability of development. We established the 1:2 ratio for this exchange due to the relative isolation of the inholdings and the correspondingly low property values.
All of the inholdings within Status 1 lands were selected interactively in ArcView and recoded to the ownership category of the larger parcel within which they were located. For the purposes of this scenario, a parcel of private land was considered to be an inholding if the majority of its property lines were surrounded by Status 1 land. Public lands with high development probability were selected interactively by simultaneously displaying the extent of 1990 urbanization, the probability of development on public land, and public land boundaries. Public lands with high development probability were selected until the total land area of the selected parcels equaled approximately half of the area of Status 1 inholdings. This land was recoded to private, the new ownership coverage was converted to a grid, the private land was selected from this grid, the probability of development grid generated for Exchange 1 was masked to the new configuration of private land, and the probability surface was populated in the same fashion as the Trend scenario.

Figure 15. Land Exchange 3: Consolidation of Status 1 Inholdings
Three of the military installations in the Mojave (Edwards AFB, China Lake NAWTC, and Ft. Irwin NTC) are included in the R-2508 Complex, a jointly managed military training and testing facility. There are 10 low level flight paths that operate within the Complex, and the military receives regular noise complaints from the communities under and adjacent to these flight paths. The Trend scenario projects that a substantial amount of new development will occur under and adjacent to these flight paths. At best, this additional development will result in a higher volume of noise complaints, and at worst could necessitate the abandonment of one or more of the flight paths. This scenario was designed to model the effect of placing public land buffers around the flight paths in order to prevent new development from occurring nearby.
In the first step of creating Exchange 4, each of the flight paths was buffered to a distance of 8,047 meters (~5 miles on either side, or ten miles total width). The 10 individual buffer coverages were unioned together, dissolved, and clipped to the study area boundary. The resulting coverage was unioned with the original ownership coverage, and all private land falling within the buffers was recoded to public in ArcView.
The second step entailed buffering the main roads coverage to a distance of 8,047 meters (~5 miles), clipping the buffer coverage to the study area boundary, and erasing the coverage with the buffered flight path coverage produced in the first step. Meanwhile, the buffered 1990s urbanization coverage that was created for Exchange 2 was also erased by the buffered flight path coverage and unioned with the buffered roads coverage. This combination of the buffered roads and buffered 1990s urbanization coverages was unioned with the ownership coverage. All BLM land falling within these buffers was recoded to private, the new ownership coverage was converted to a grid, the private land was selected from this grid, the probability of development grid generated for Exchange 1 was masked to the new configuration of private land, and the probability surface was populated in the same fashion as the Trend scenario.

Figure 16. Land Exchange 4: Buffer Low-Level Flight Paths
We summarized habitat loss in several ways. We determined the percentage of habitat that was lost Mojave wide for each species, as shown in Figure 17. While this is a useful statistic, it does not provide information as to the amount of habitat that was lost within the region directly adjacent to the growth. For this reason we also calculated the percentage of habitat that was lost relative to the extent of habitat distribution within all private lands, shown in Figure 18. This statistic provides a much better indicator of the status of a species in the part of the Mojave that is undergoing human population growth.
In addition to the scenarios, we modeled the impact that the last thirty years of growth has had on each species. We measured the impact of urban growth up until 1970, the impact of growth between 1970 and 1980, and the impact of growth between 1980 and 1990. All of the scenarios were then measured against 1990. In other words, the impacts of the scenarios were measured by calculating the difference in the amount of habitat present at the end of the scenario and the habitat present in 1990. We determined the amount of habitat loss by subtracting those areas with new development from the habitat of urban-intolerant species. We then calculated the percent of the Mojave-wide distribution that was urbanized, as well as the percent of habitat developed within only private lands. This provides two different perspectives on the impacts that habitat loss will have on species, one regional and the other local.
Figure 17 shows the percentage of habitat lost for all vertebrate species as a whole. This groups together all amphibians, mammals, reptiles, and birds. There are several patterns that are important. Build-out has by far the largest impact on all of the species within the region, where the average percentage of habitat loss is just under ten percent. Please note the small amount of habitat lost due to development since 1970. The most obvious pattern in the table is the difference between the high density scenarios (20 people per hectare) and the low density scenarios (3.76 people per hectare). Clearly, a population density of 3.76 people per hectare has a much greater impact on the landscape than a population density of 20 people per hectare. The second important pattern to note is that a fifty percent increase in the projected population increase does not drastically increase habitat loss relative to the standard population projection.
Figure 18 shows the percentage of habitat lost for all vertebrate species relative to the amount of habitat located on private lands. Habitat loss within only the private lands was considered to show how development impacted species in the southwestern portion of the Mojave. The worst-case scenario, Buildout, would eliminate an average of 30% of the habitat of all species. Amphibians are not affected as much as the other species, losing only 15% of their habitat on private lands. Mammals would lose roughly 28% under Build-out. Reptiles and birds would lose 32% and 35% respectively. Although more than half of the habitat will remain within private land even under the Build-out scenario, the connectivity of the remaining habitat will be severely affected due to the loss of the 30% of habitat.

Figure 17. Percent Habitat Loss Mojave-wide for All Species by Scenario

Figure 18. Percent Habitat Loss on Private Land for All Species by Scenario
Identification of species pushed onto the bases by development was a three step process. First, we identified species with large amounts of habitat on private land. Of these species, we identified those that lose a large amount of habitat under the Trend scenario. Finally, of the remaining species, we determined which species had significant amounts of habitat located on the bases themselves. This process determines species that will have nowhere to go but the bases. This analysis does not take into account connectivity or the actual location of the habitat. It is likely that taking local factors into consideration would increase the number of species that may be driven onto the military installations.
Overall, a small number of species satisfy the criteria (Table 8). However, the criteria are not fixed and we altered the values to explore the sensitivity of the species to habitat loss within private lands. No species have more than 50 percent of their habitat on private land, lose 50 percent of this private land habitat, and cover 50 percent or more of the total area of the military installations with their remaining habitat (50-50-50). At the 50-50-25 level, 2 bird species were identified. These two species will lose more than 50 percent of their habitat within private lands. At least 25 percent of the area of the military installations contain habitat for these two birds as well. The balance of the table indicates that the number of bird species increases as the criteria are relaxed. At the 30-25-25 level, seven bird species and two mammal species satisfy the criteria. Finally, there is a large jump in the number of species at the 20-25-15 level. There are 20 birds, 13 mammals, and 25 reptiles that have close to 20 percent of their habitat on private land, will lose 25 percent of this private land habitat, and have 25 percent of the area of the bases covered with their habitat.
Table 8: Number of species by taxon that may be driven onto military installations
| Percent of Mojave-wide habitat on private land | Percent of private land habitat developed | Percent of military installation land occupied by habitat of the species | Number of species that meet these criteria | Birds | Mammals | Reptiles | Amphibians |
|---|---|---|---|---|---|---|---|
| 50 | 50 | 50 | 0 | 0 | 0 | 0 | 0 |
| 50 | 50 | 25 | 2 | 2 | 0 | 0 | 0 |
| 50 | 25 | 25 | 2 | 2 | 0 | 0 | 0 |
| 40 | 50 | 50 | 0 | 0 | 0 | 0 | 0 |
| 40 | 50 | 25 | 4 | 4 | 0 | 0 | 0 |
| 40 | 25 | 25 | 5 | 5 | 0 | 0 | 0 |
| 30 | 50 | 50 | 0 | 0 | 0 | 0 | 0 |
| 30 | 50 | 25 | 5 | 5 | 0 | 0 | 0 |
| 30 | 25 | 25 | 9 | 7 | 2 | 0 | 0 |
| 20 | 50 | 50 | 0 | 0 | 0 | 0 | 0 |
| 20 | 50 | 25 | 5 | 5 | 0 | 0 | 0 |
| 20 | 25 | 25 | 58 | 20 | 13 | 25 | 0 |
The techniques developed by the Mojave Desert Alternative Futures Project provide a process for modeling a range of future possibilities in the Mojave Desert. The process is directed by the interaction of socio-demographic, economic, and biophysical drivers. We used the process to project future population increases, model future patterns of urban growth, and refine the predicted distributions for all of the terrestrial vertebrates predicted to occur in the Mojave. We created 25 different future scenarios that use the population projections in conjunction with the urban growth models to develop a variety of potential landscapes. We determined the effects of the various scenarios by assessing their impact upon the distribution of terrestrial vertebrates. Additionally, we examined the possibility of species being forced onto military installations if the most likely future pattern of development comes to pass.
However, our scenarios serve primarily to illustrate how the process works. By substituting or adding new data layers to this process, the framework can be adapted by land managers and policy makers to simulate the potential impacts of decisions before the decisions are made. With the growing availability and increasing sophistication of computers, we believe the GIS techniques described in this paper can be used effectively over large areas by planners, municipalities, military installations, and other federal land management agencies.
Heim, Mary. 1998. County population projections with race/ethnic detail estimated July 1, 1990-1996 and projections for 1997 through 2040. California State Department of Finance, Demographic Research Unit.
Landis, J.D., J.P. Monzon, M. Reilly, and C. Cogan. 1998. Development and pilot application of the California urban and biodiversity analysis (CURBA) model. Institute of Urban and Regional Development, University of California at Berkeley.
MacMahon, James A., and Frederic H. Wagner. 1985. The Mojave, Sonoran and Chihuahuan deserts of North America. Hot deserts and arid shrublands, M. Evenari et al. eds.
Mojave Desert Ecosystem Program. 1998. Department of Defense, Barstow California. http://www.mojavedata.gov/mdep/
Scott, J. M., F. Davis, B. Csuti, R. Noss, B. Butterfield, S. Caicco, C. Groves, T. C. Edwards, Jr., J. Ulliman, H. Anderson, F. D'Erchia, and R. G. Wright. 1993. Gap analysis: a geographic approach to protection of biological diversity. Wildlife Monographs No. 123.
Zeiner, David C., et al., Eds. 1999. Amphibians and reptiles, Vol. I. Birds, Vol. II. Mammals, Vol III. California's wildlife. State of California Department of Fish and Game, Sacramento.
Matthew R. Stevenson is the GIS Specialist for the Mojave Desert Alternative Futures Project at Utah State University. Richard E. Toth is a Professor in the Department of Landscape Architecture and Environmental Planning at USU. Thomas C. Edwards, Jr. is a Research Ecologist with the USGS Biological Resources Division. Lori Hunter is an Assistant Professor in the Department of Sociology, Social Work and Anthropology at USU. Robert Lilieholm is an Associate Professor in the Department of Forest Resources at USU. Kimberly Karish and Manuel Gonzalez are graduate students at USU. James DeNormandie is a GIS Specialist at Olson and Olson Planning and Design in Calgary, Alberta, Canada. Mary Cablk is an assistant research professor at the Desert Research Institute in Reno, Nevada.