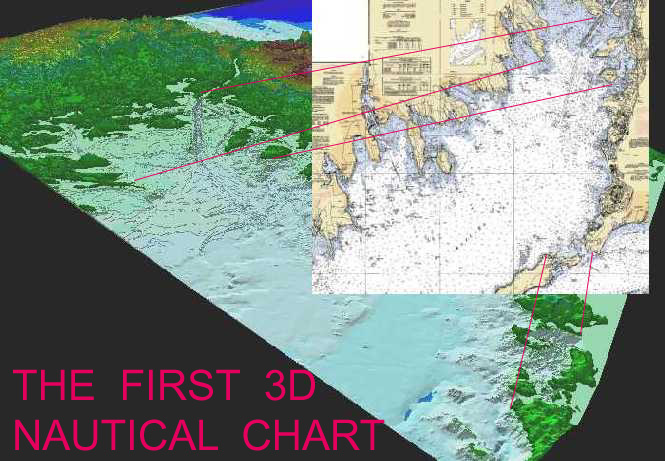
THE FIRST THREE-DIMENSIONAL NAUTICAL CHART
BY Captain S. F. Ford
ABSTRACT:
During the 1976 -1999 period, nautical paper charts evolved into digital, electronic formats and expanded beyond their traditional nautical domain into the realm of Geographic Information Systems. The history is captured from the perspective of one of the creators of the first "electronic chart." The evolutionary vs. revolutionary {9} development of Electronic Chart Display and Information Systems (ECDIS) is identified.
Relevant enabling technologies such as Physical Oceanographic Real-Time Systems (P.O.R.T.S.) are discussed. The construction of the first 3D Nautical charts from digitized data and federal data is explained and documented. Relevance and importance of the 3DCHART©to mariners and Coastal Zone Managers is illustrated. The need for federal focus on 3D data is justified. Federal Agency issues and areas for improvement are identified. Application of ARC/INFO and IDRISI Geographical Information Systems (GIS) to the 3D chart project are illustrated. A 3DSMARTCHART©for real-time applications is explained.
The movement of cartography from the portrayal of a scaled, "perceived" or
subjective world under the Generalization Principle towards an almost 1:1 electronic
depiction of an object-oriented, "duplicate electronic world" is underscored.
The need for a single, integrated horizontal and vertical datum is stressed as being
critical to three-dimensional and four-dimensional cartography in the 21st
Century
OBJECTIVE:
In recognition of the potential benefits inherent in the portrayal of navigational charts in 3D, the author undertook a research effort to fulfill his vision of Cubit Theory and develop the first 3D Chart as part of his Master’s Program at Clark University, Worcester, MA. The objective of the project was a comparative construction of a 3D Nautical Chart from a digitized nautical paper chart and from available federal, GIS (Geographic Information Systems) data sets.
HISTORICAL PERSPECTIVE
Geographic Information Systems (GIS) have been traditionally utilized in mapping and modeling of two dimensional, shore-side data for a homogenous user-group that focused on applications relevant to land features. The closest that the "land-side" GIS applications have approached the water has been in the Coastal Zone Management (CZM) arena. Balanced use of ocean resources with environmentally sensitive co-habitation of business, biology, and ecology and populace is a "green" concept that requires the integration of bathymetric and topographic data with the appropriate thematic data for successful management of the coastal zone environs. GIS is a tool for Coastal Zone and Marine Sanctuary Management. To the stewards of the coastal zone and Sanctuary habitats, GIS offers a management tool for maintenance of the health of their coastal and marine sanctuary responsibilities. In a similar vein, GIS also offers a tool to the Captain of a vessel for management of maneuvering/navigational scenarios or the unfortunate, maritime incident. For Federal regulatory and policy officials, GIS is an important decision-support tool. At the present time, besides local geography, the common link of the CZM/Sanctuary Manager, the vessel Master, and other Regulatory Officials is the nautical paper chart.
Since the 1976 experience in construction of the first electronic nautical chart (NAVSHOALS), the author has maintained that the navigation of ocean vessels on three dimensional, real-time nautical charts would further enhance the safety and efficiency of marine transportation. The author also maintains that the 3D Nautical Chart would also enhance the effectiveness and efficiency of Coastal Zone/Marine Sanctuary Managers in their dealings with policy issues and such incidents as oil spill response and coastal erosion. Federal officials would benefit from the decision-support, modelling, communication and cognition inherent in a 3D Nautical Chart. A 3-D chart provide a visual management information system (MIS) for ship masters, Coastal Zone/Marine Sanctuary Managers, and others which enables visualization (geo-spatial orientation) of their situational parameters. Hence, decision-makers can expend their energies in making timely, effective decisions rather than collecting/analyzing information with which to make decisions. It is the belief of this author that the development of recent enabling technologies have brought the 3-D Nautical Chart concept to the edge of technical feasibility at the cost-effective level of desktop computers. These enabling technologies and advancements include, but are not limited to:
The world’s oceans cover 74% of the globe and involve a multi-disciplinary group of local, national and international users of operator, researcher, and administrator disciplines. These "players" of the oceanographic communities interact at the legal, the operational, and the policy levels, of society, science, and transportation. Unfortunately, these activities and interactions are rarely based upon a common, compatible database and are frequently founded upon sketchy 20th Century scientific information. Historically, the decision-support, geo-spatial information of these players is displayed upon two-dimensional maps of limited accuracy and resolution and with no modelling ability. The "water column" is three-dimensional. In order to efficiently and effectively fulfill their individual and collective "water-oriented" stewardships in the 21st Century, this "oceanographic" community requires high-resolution, three-dimensional information displayed in visual format. The proposed format is a 3D Nautical Chart, which permits modelling over time and is suitable for GIS analysis. To date, a 3D Nautical Chart of (x, y, z) proportions has not been available. With the addition of GIS modelling tools, the three-dimensional nautical chart can expand to a four-dimensional stewardship tool of (x, y, z, and t) proportions that are suitable for the needs of the 21st Century.
DGPS now permits centimeter-level accuracy {26} data positioning in the horizontal and vertical. Shallow water multi-beam sonar now permits acquisition of dense, near-shore and harbor bathymetry data. Satellite systems permit near real-time data transfers. Modern software permits the combination of raster and vector data. PC Hardware is approaching the capability to handle large "oceanographic" data sets. Hence, the 3D Nautical Chart is feasible and a proof-of-concept is offered in this publication.
Geography is global. There is no physical barrier between the land and sea. Nor does a barrier exist at the air-sea interface. Land-sea and air-sea are just benchmarks in the horizontal and vertical continuums of nature between the depths of the Philippine Trench and the heights of Mount Everest. The world of two-dimensional charting must grow to incorporate these global realities of three and four dimensions. A modern marine GIS with a core 3-D Nautical Chart could become the first step to accomplish a true managerial tool that can protect and preserve our precious coastal environs.
Nearly half of the world’s population lives within 50 miles of a coastline. This population density has created a strong marine transportation business of nearly 80,000 commercial vessels to meet the consumption needs of the populace. With the globalization of world trade, waterborne transportation of goods is increasing with an associate increase in the coastal zone ecological exposure to maritime incidents. Population pressure on the Coastal Zone is rising exponentially. Digital bathymetry integrated with NOAA raster charts, USGS Digital Elevation Models, Digital Orthographic photos and environmental thematic data appear ready to be combined to generate a three dimensional nautical chart display for Mariners, CZM/Sanctuary stewards and Federal officials. Such an advancement of GIS could enhance navigational and coastal operations by reducing environmental risks and by reducing the potential for vessel grounding. It also improves baseline environmental and geophysical data, which improves incident planning and response. In the event of an incident, a properly attributed 3D chart can enable Mariners to initiate immediate local management of the incident with appropriate concerns for the attributes of the surrounding environmental sensitivity. This author provides a proof-of-concept 3D Nautical Chart that was created by the application of ARC/INFO and Arcview software to the digital data of nautical bathymetry and shore topography for the study area of the approaches to the Cape Cod Canal locale.
The Cape Cod Canal study site was chosen for its prominence as a principal East Coast water transportation corridor, wide bathymetric–topographic range and its availability to Clark University.
The Cape Cod Canal is a deep-draft sea-level waterway connecting Buzzards Bay and Cape Cod Bay. The Waterway is fifteen miles long from Cleveland East Ledge Light to Cape Cod Bay with significantly varying bathymetry and topography. The canal shortens the distance between points north and south of Cape Cod by 50 to 150 miles and provides an inside passage to avoid Nantucket Shoals. In the vicinity of the Canal’s northern entrance, vessel traffic routes transit a Northern Right Whale critical habitat. The Federal project depth provides for a channel of 32 feet depth and approximately 400 feet width. It is routinely used by large vessels of 500 to 650 feet length. Three bridges with a vertical clearance of 135 feet cross the canal. The mean tidal range is 3.5 feet and the canal has very significant tidal currents of 4.0 to 4.5 knots. The locale regularly experiences fog and ice flows. In summary, the canal is an area for prudent navigation that qualifies it as a site suitable to testing the development of a three-dimensional chart.
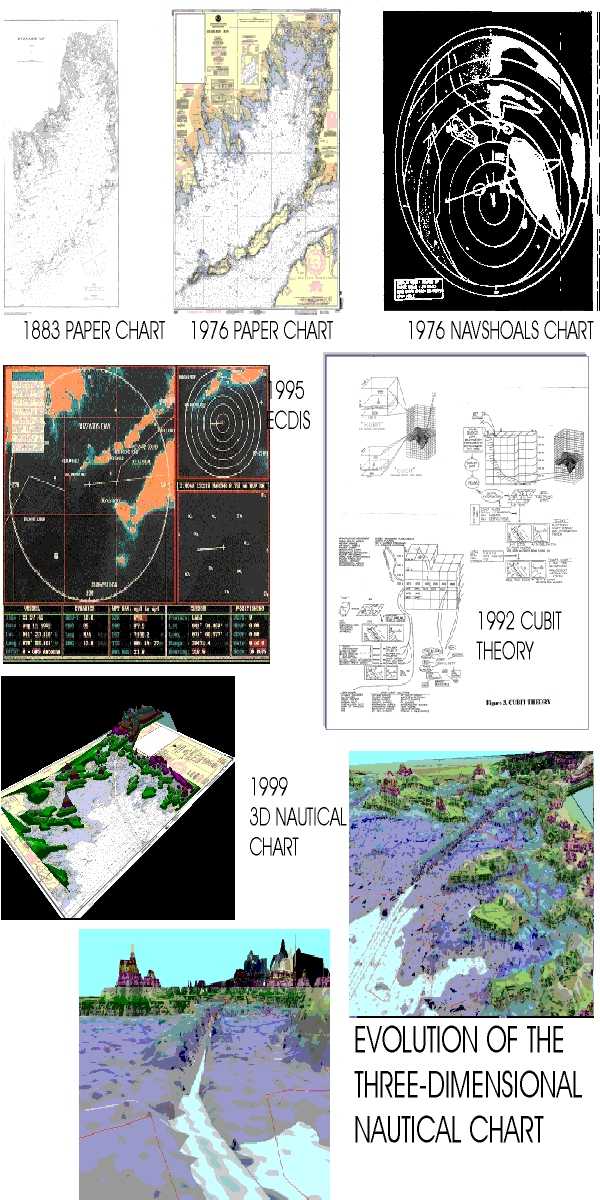
In 1976, the author conceived and led the development team for NAVSHOALS, the Exxon/Sperry Marine navigation aid module for the Sperry Collision Avoidance System (CAS). With NAVSHOALS, the CAS screen was provided a geographic overlay on the radar data displayed upon the vessel’s CAS screen. In augmentation of the CAS, NAVSHOALS gave mariners visual, graphic information regarding coastlines, hazards, shoals, traffic lanes, and aids to navigation. Thus, NAVSHOALS reduced grounding risks and freed up the mariners to focus on the collision hazards of their maneuvering situation by reduction of the time and cognition required assessing radar target threats.
As illustrated above, other enabling technologies evolved or advanced. Such that, by 1988, the NAVSHOAL graphic overlay concept had evolved to Electronic Chart Display and Information Systems (ECDIS). This was the mariner’s management information system (MIS) of the period. ECDIS was based upon vector electronic charts equivalent in detail to nautical paper charts. ECDIS integrated all of the vessel’s navigation sensors into one system. Similar to NAVSHOALS, the ECDIS enabled the mariner to spend even more time making maneuvering decisions instead of gathering information with which to make the maneuvering decision.
In 1992, as a member of the NOAA Strategic Plan Advisory Committee {7}, the author published his CUBIT Theory regarding three-dimensional nautical data collection, processing, and application for multi-disciplinary users. CUBIT Theory incorporated bathymetric, topographic, environmental and nautical data as an integrated 3D visual system for mariners, coastal zone managers, environmentalists, administrators, and the like.
By 1995, sub-meter accuracy electronic docking charts had been developed as an aid to navigation for in- port, reduced visibility operations. Also, ECDIS had evolved to high accuracy, but slowly produced, vector charts. The slow vector chart production stimulated a need for raster nautical chart (RNC) and the Electronic Chart System (ECS) was born as an interim nautical charting technology of a faster production rate.
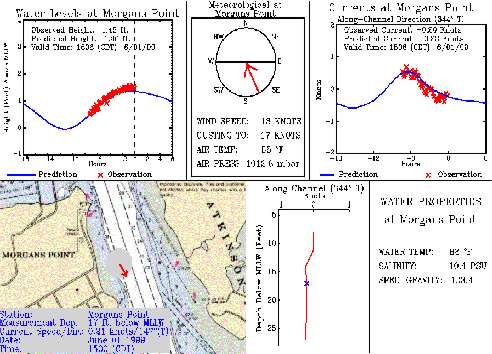
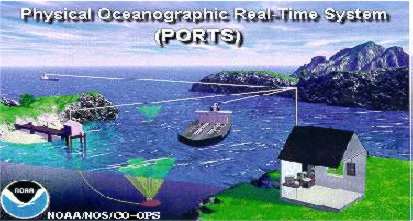
In 1996, the author received a NOAA grant to install, start-up, and operate the first
system of PORTS (Physical Oceanographic Real Time System) in Galveston Bay {11}. The PORTS
system of five water level gauges, three current meters, and meteorological stations
provided real-time tide and current data corroborated with meteorological data every six
minutes for the 50-mile long estuary. PORTS offers the opportunity to input and alter
real-time water level displays in onboard, real-time 3D chart display units. Because tidal
levels and currents are strongly influenced by local conditions, the advantage of such
real-time data to mariners, fishermen, coastal zone managers, and hazardous response teams
is immeasurable for efficient and effective prevention, control, and containment of
maritime and meteorological incidents. The safety of life, property, and natural habitats,
both "on the water" and "on the shore" benefits from a PORTS
installation. Other, smaller PORTS systems {2} are installed in New York and San
Francisco. Additional PORTS installations are under consideration by Port Authorities
across the country. PORTS is an application of the author’s CUBIT Theory for 3D
marine data collection and dissemination as proposed in 1992.
3D CHART PROJECT OVERVIEW
The following illustrations provide a simplistic, conceptual overview of the benefits for the mariner that are derived from "peeling back" the water layer which obstructs the view of the underwater bathymetry. Rather than dealing with the 2D nautical charts and mentally constructing a 3D visual model, the mariner can now "see" the underwater hazards and obstructions and, thus, maneuver the vessel in a fashion similar to the operation of an automobile.
BUZZARD'S BAY TOPOGRAPHY AND WATER:
BUZZARD'S BAY TOPOGRAPHY AND BATHYMETRY:
IF YOU CAN SEE UNDERWATER HAZARDS, YOU CAN DRIVE A SHIP SIMILAR TO HOW YOU DRIVE AN AUTOMOBILE !
A brief summary overview of the three-step process for the 3D Chart project follows. Source data is illustrated on the left of the overview and the output products are located to the right side. Following the overview, some detailed views of the insets are provided to convey an appreciation for the geographic complexity of the project and the locale.
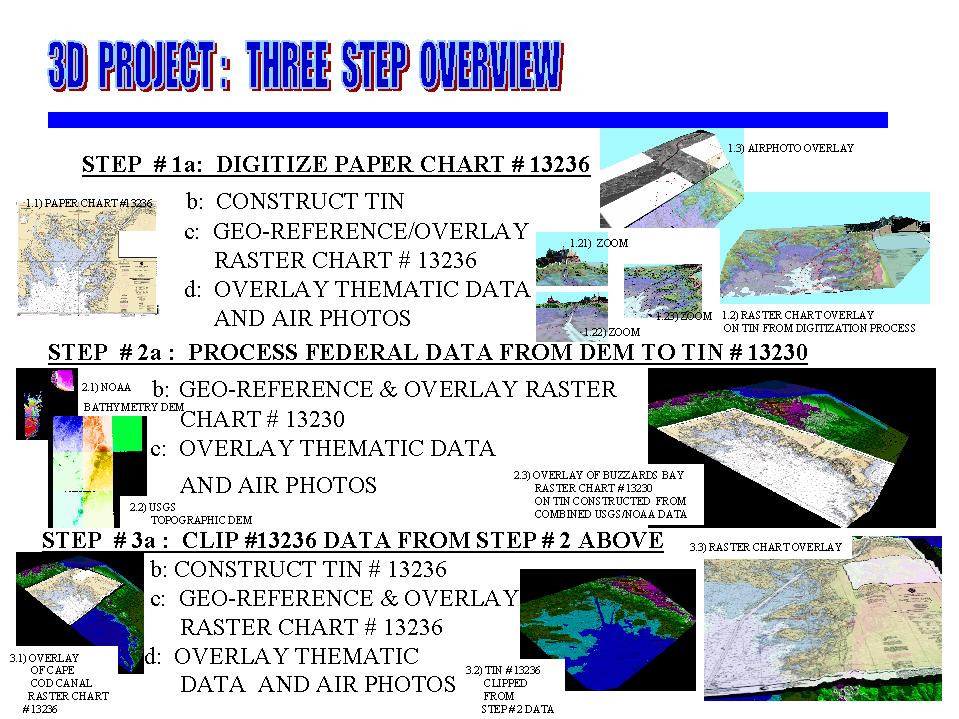
DETAILED VIEWS FROM THE ABOVE OVERVIEW:
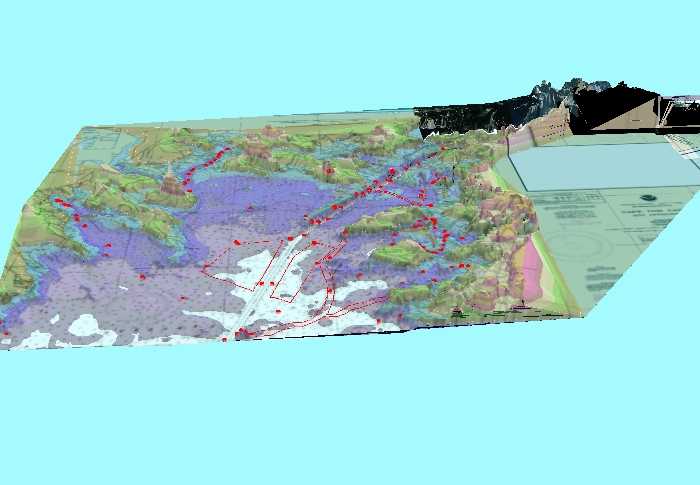
FIG 1.2 (Above): SEMI-TRANSPARENT ELECTRONIC RASTER CHART #13236 OVERLAY (WITH NAVAID THEME) ON TIN FROM DIGITIZATION PROCESS ON PAPER CHART. (Vertical Exxageration for Emphasis)
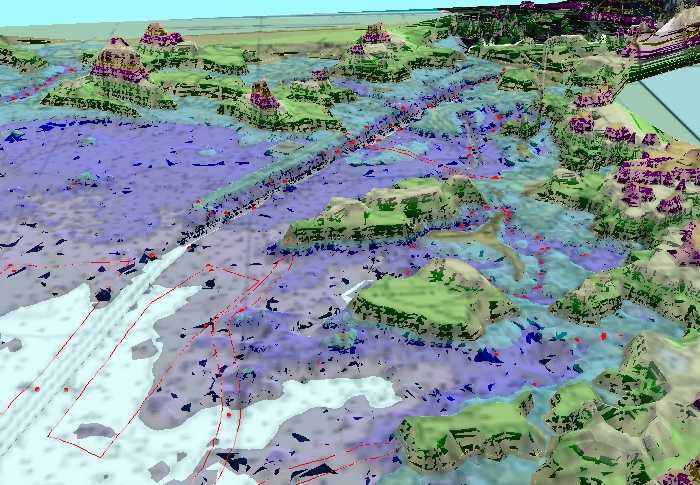
FIG 1.23 (Above): OVERHEAD ZOOM INTO FIG. 1.2, ILLUSTRATING ISLANDS, CHANNELS, NAVAIDS, TOPOGRAPHY, AND BATHYMETRY (Vertical Exxageration for Emphasis)
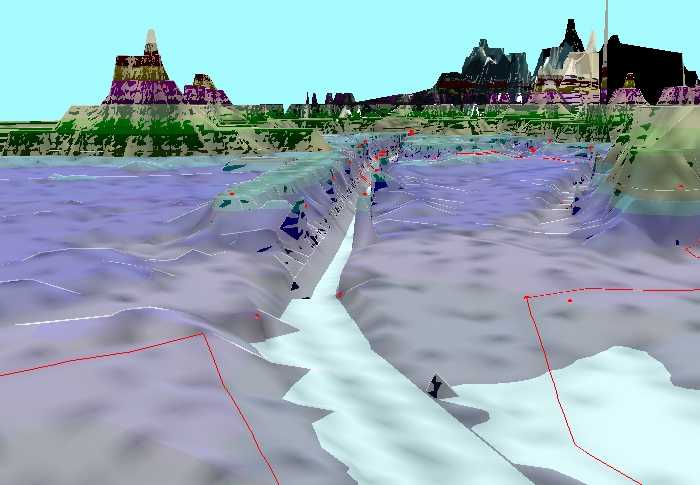
FIG 1.22 (Above): ZOOM INTO FIG 1.2 AT THE TURN IN THE INBOUND CHANNEL JUST BELOW THE SOUTHERN END OF THE DIKE. (Vertical Exxageration for Emphasis.)
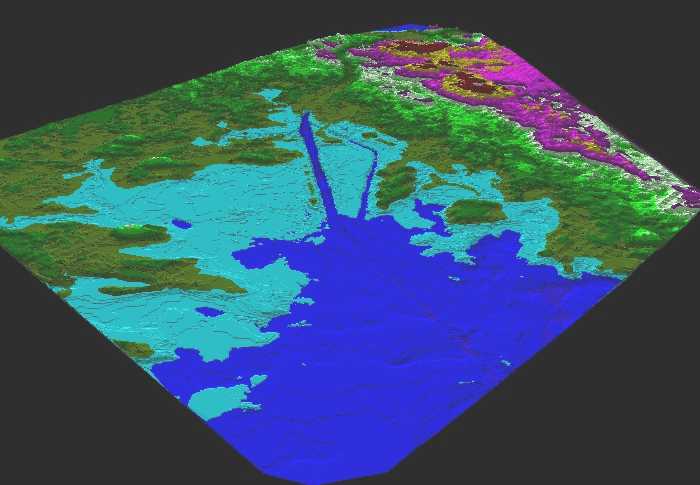
FIG 2.3 (Below): OVERLAY OF BUZZARD'S BAY RASTER CHART #13230 UPON TIN CONSTRUCTED FROM COMBINED USGS/NOAA DATA.
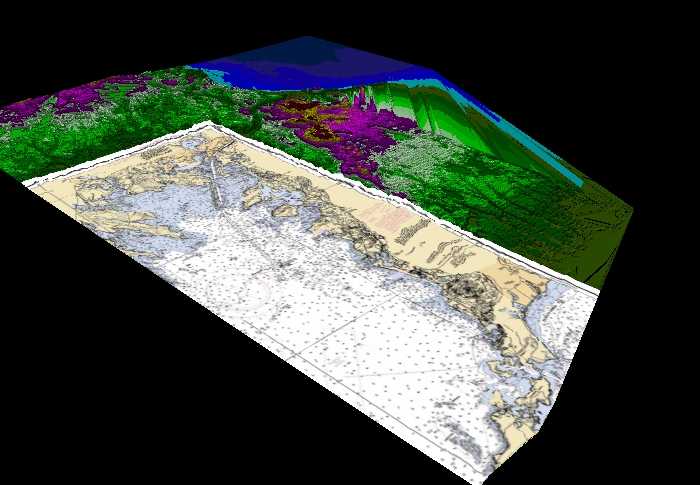
FIG 3.1 (Below): OVERLAY OF CAPE COD CANAL RASTER CHART #13236 UPON BUZZARD'S BAY TIN CONSTRUCTED FROM STEP # 2.
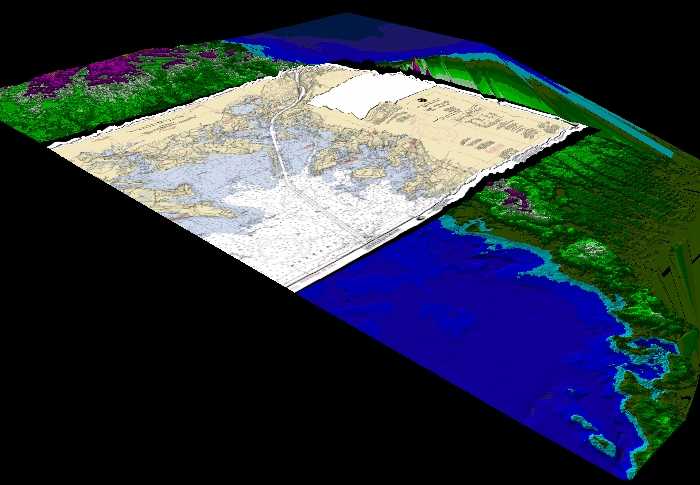
FIG 3.2 (Below): TIN FOR CHART #13236 CLIPPED FROM BUZZARD'S BAY TIN DERIVED IN STEP # 2.
BENEFACTORS / USERS OF 3D NAUTICAL CHARTS:
PROFESSIONAL MARINERS
RELEVANT COASTAL ZONE APPLICATIONS:
Application of the 3D chart technology to Coastal Zone Management (CZM) and Marine Sanctuary issues offers the benefit of visualizing the following concerns within the context of their three-dimensional environment:
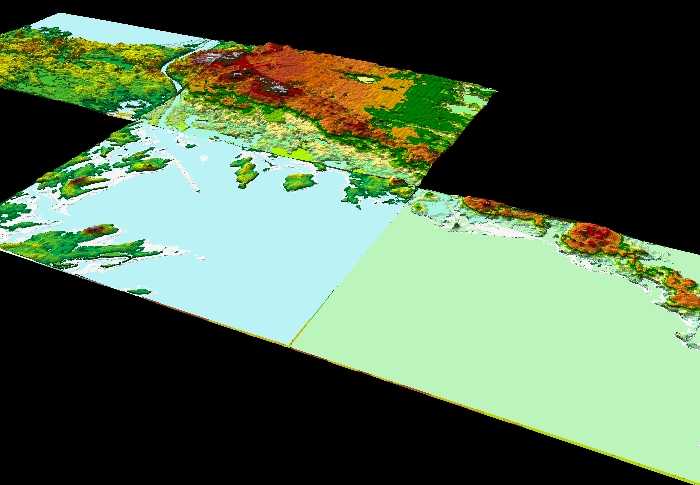
Three-Dimensional charting is not limited to nautical charting. The tools can be applied to generate 3D topographic map overlays and airphoto overlays.The following three images illustrate 3D topographic technology applied to the Scraggy Neck locale of Buzzards Bay. The first image contains a USGS orthoquad map and two coastal zone themes overlaid on the 3D topographical data. The pinkish polygons identify ecologically sensitive areas. The yellowish polygons identify barrier beach areas. In Massachusetts, the coastal zone extends from the three-mile limit of the state territorial sea to one hundred feet beyond the first major land transportation route encountered (i.e. road, rail).
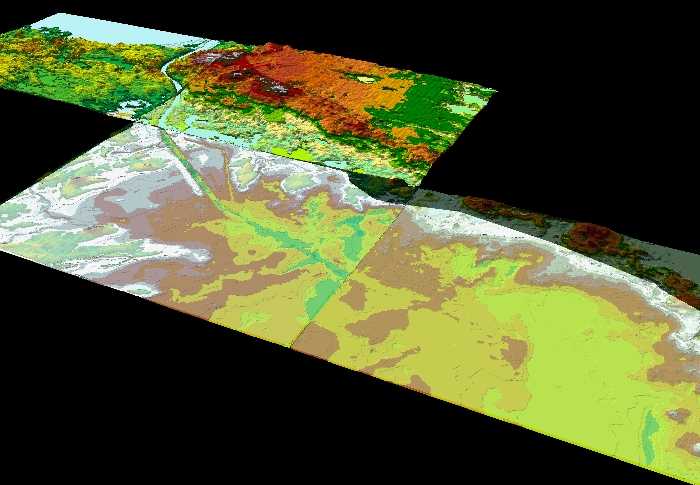
The second image is identical to the first with the exception that a layer of MASSGIS ½-meter black and white (BW) orthophotos has replaced the USGS orthoquad map. Together, the first two images provide a visual wealth of mapping and geo-spatial information regarding coastal dynamics and population pressures. The third image zooms into the BW layer and illustrates the richness and detail of the dynamic information found in the 3D portrayal of spatial data and themes.
CZM themes of erosion/accretion, habitat locales, non-point pollution, marshland, biologic distributions, etc. and their respective inter-relationships can be illustrated by data themes for variables above and below the water’s surface.
FIG 4.1 (Below): TOPOGRAPHIC OVERLAY FOR SCRAGGY NECK ON TIN FROM STEP #2A, FEDERAL DATA.
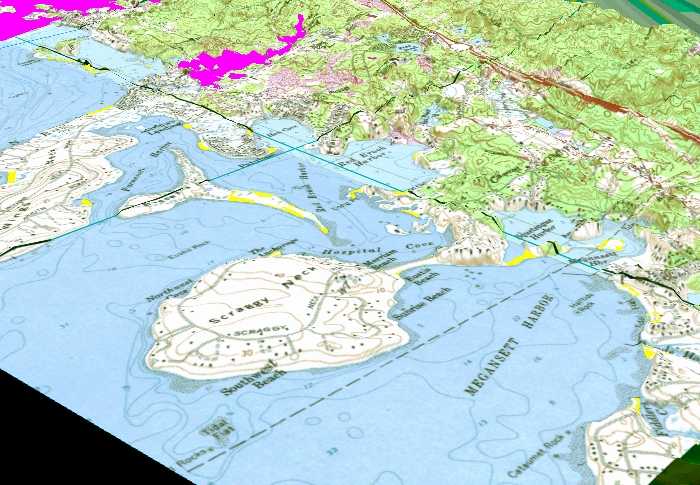
FIG 4.2 (Below): AIRPHOTO OVERLAY FOR SCRAGGY NECK ON TIN FROM STEP #2A, FEDERAL DATA.
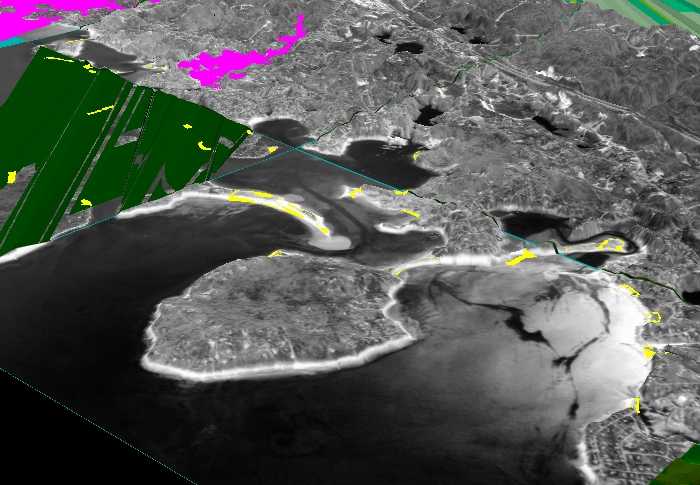
FIG 4.3 (Below): ZOOM INTO 3D AIRPHOTO OVERLAY (ON SCRAGGY NECK) OF FIG. #4.2 FOR EROSION AND TIDAL CURRENT EVALUATION.
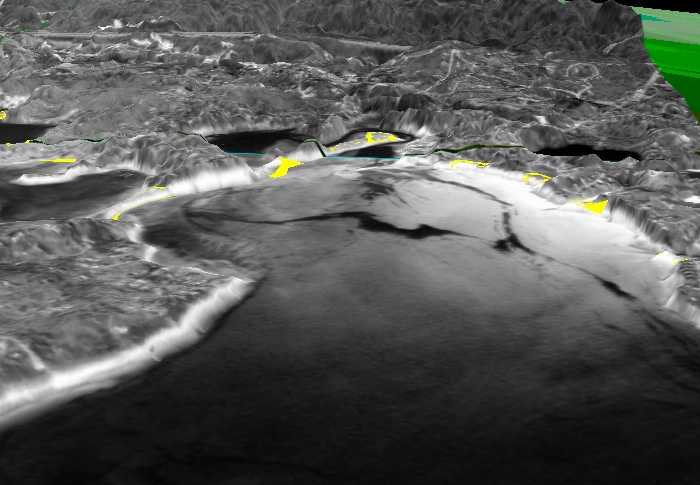
FIG 4.4 (Below): ZOOM INTO 3D AIRPHOTO (1/2 METER MASSGIS) OVERLAY (ON NORTHERN CANAL, MASS BAY ENTRANCE) OF FEDERAL DATA TIN FOR THE ILLUSTRATION OF SOURCE DATA FROM NOAA, USGS, AND ACOE.
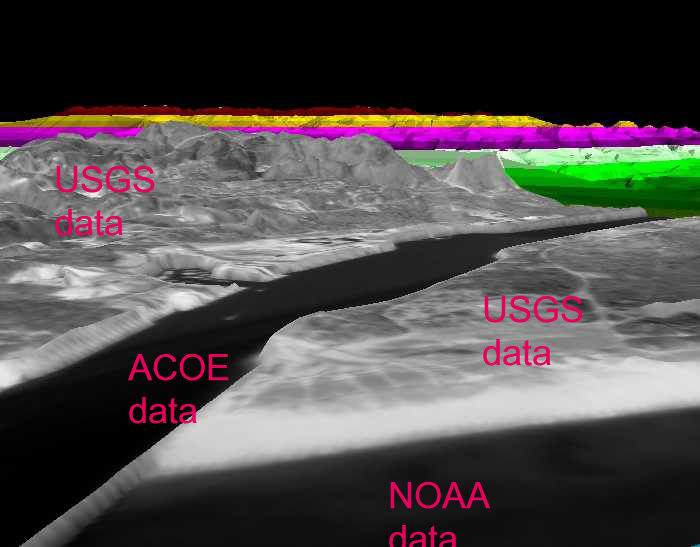
At both the southwest and northeast entrances (Buzzards Bay and Massachusetts Bay, respectively) to the Cape Cod Canal, the federal data sets of the USGS, NOAA and the U.S. Army Corps of Engineers (ACOE) converge in a geographic interface. The above image at the northeast canal entrance (looking southwest) illustrates the interfacing responsibilities of the federal agencies involved in bathymetric and topographic data collection and dissemination. Prior to releasing elevation and depth data to the public domain, the federal agencies submit the field data to extensive processing and quality control checks. In this process, the typical bathymetry survey of 2 – 5 million soundings will be dramatically thinned and "QC-ed" to a 1+ million point file. However, NOAA’s depth data is converted to contours prior to release to the public. This process smoothes the actual data and inserts the equivalent of an "artifact" into real world data since the real world is not comprised of "plateaus". Ergo, because of its point value preservation, it is opined that the digitized 3D Nautical Chart, constructed from paper chart points, may be more representative of reality than the "contoured" federal data set.
As the need for 3D data increases, the need for greater resolution than 30 meters will occur. It is opined that, all too soon, bathymetric ten, five, and one-meter resolution grids will be in demand. Similarly, the need for greater resolution topographic data will follow. The ability of the hardware and software to handle such large data sets will be the determinate factor of the demand for the data.
The federal data sets for the Buzzards Bay area were available in the public domain. In the course of the project, they were found to be the most challenging to the hardware, software, and the author due to their size and complexity. In toto, for essentially the same output, the federal data set phase required two and a half times the amount of production time as required by the digitizing phase.
The bathymetry data was obtained from the National Ocean Service (NOS) office of NOAA (National Oceanic and Atmospheric Administration). The topographic data sets were obtained from the USGS (U.S. Geological Survey). Air photos were obtained from MASSGIS. Manipulation of the federal data in the GIS environment was significant. Each data set was in a different original format and required different initialization procedures in order to input them to the Arcview process. USGS data had to be untarred and passed through a Spatial Data Transfer Standard (STDS) filter prior to importing to Arcview. NOAA data was directly imported to Arcview as digital elevation model (DEM) data.
Coverage areas of the data sets overlapped. Both data sets had the same horizontal datum (19NAD27) with the NOAA data on the Clarke 1866 spheroid. Both data sets had different coastline references and vertical datum references that had to be reconciled and standardized prior to combining the data sets. The NOAA data had greater vertical resolution and accuracy than the USGS data. However, the NOAA data contained elevations greater than zero and these points had to be removed to delineate the national shoreline and the nautical chart datum reference line of mean lower low water (MLLW). The 1:70,000 scale of the NOAA medium-resolution digital vector shoreline was not deemed to be of an acceptable detail level for this project due to the 1:40,000 scale of the source raster chart overlay. Bathymetric depths on a nautical chart are referenced to the local tidal datum, which is typically MLLW averaged over the nineteen-year tidal epoch. Depths below the datum are negative and elevations above are positive. The vertical datum for the depths was NGVD29. The NOAA metadata cites a locational accuracy for the soundings of 0.0015 m at the source "Smooth Sheet" level. The vertical accuracy of the paper chart data is cited as 2% of depth or 0.2 meters for depths shallower than 20 meters and within 1 meter for depths greater than 20 meters. Both data sets were accompanied by metadata (data about data) to facilitate the uploading of the respective data sets. However, the NOAA metadata was the most straightforward and user-friendly.
The NOAA data was available in both a UTM, single 30m grid for the entire Buzzards Bay estuary and in individual, randomly dispersed data sets for portions of the estuary. Because of its size, the hardware/software was not able to handle the single, large grid for Buzzards Bay plus the additional project overlay themes. The UTM grids do not align with the typical geographic parallels and meridians which define the extent of the USGS 7.5 minute DEMs. Hence, edge matching with other 3DCHARTS® could be a future issue. The NOAA data sets were derived from the surveys used to compile the bathymetry for chart # 12320 and 12326. However, the accuracy of a DEM from the federal data is a function of: {5}
Horizontal accuracy of the NOAA data was 0.0015 meter at source "smooth sheet" scale and 3 meters at the paper chart, user level.
A vertical RMSE (Root Mean Square Estimate) statistic that includes both random and systematic errors is used to describe vertical accuracy of a DEM. The vertical accuracy of the constructed NOAA bathymetric DEMs is estimated to be 2% of depth, i.e., 1 meter for depths greater than 20 meters and 0.2 meter for depths less than 20 meters. Because of three types of DEM vertical errors (Blunder, Systematic, and Random), the NOAA metadata carries a warning that the data "SHOULD NOT BE USED FOR NAVIGATION PURPOSES" {5}. This caveat automatically renders the digitized model as the output that fulfills the project’s objectives. However, most NOS source surveys are certified to one foot or better. Hence, the navigational warning appears more "legal" than factual in nature.And, the NOAA bathymetric data exceeds National Mapping Standards by a factor of three which is significantly more accurate than the USGS data which only meets the national mapping standards. After consideration of the "warning", the author’s analysis of the data indicated it to be of a quality suitable for the purpose of developing this 3D chart project. In addition to its greater data accuracy, this NOAA warning is another reason why the digitized 3DCHART® is considered to be superior to the federal data set product since it directly incorporates the accuracy of NOAA’s nautical paper chart.
Blunder errors are errors of major proportion and are easily identified and removed during data editing. Systematic errors are "fixed-pattern" in nature and are introduced by data collection procedures and systems; i.e., un-sampled elevation shifts, relative spacing of the source soundings, surface mis-interpretation due to "soft" reflectivity and fractional sounding resolution. {5} Random errors result from unknown or accidental causes. Hence, all of the DEM "error" reasons for the "Do Not Use For Navigation" warning can be eliminated by good quality control processes in a manner similar to the 2D paper chart and electronic chart "QC" processes.
The USGS elevation data is in 7.5 minute DEMs on a 30-meter resolution, UTM 19 grid with a NAD27 horizontal datum and a NGVD29 vertical datum. The national mapping standard of 7-meter root mean square error (RMSE) or a RMSE less than ½ the contour interval is what the USGS uses as the standard for their elevation DEMs. The reference USGS shoreline is Mean Sea Level (MSL) and it causes a discontinuity of about ½ of the tidal range {24} with respect to the MLLW datum of NOAA.
The final products of the 3D nautical chart project utilized MLLW as the tidal datum on a Mercator projection and a WGS1980 (NAD83) spheroid with a vertical NGVD29 datum. The digitized version of Chart #13236 was executed to these parameters. The federal data sets had to be projected to these new parameters from their original UTM format
REAL-WORLD OBJECT INSERTION INTO 3D NAUTICAL CHART:
The use of real-world 3D objects to symbolized lighthouses, bridges and similar navigation subjects was an unattained goal of this project. Due to the limitations of the selected software, only 2D views of the constructed 3D objects were exportable to the 3DCHART©. The above images convey the concept with two-dimensional objects for the southwest and northeast entrances to the Cape Cod Canal. It is anticipated that the next generation 3DCHART© and 3DSMARTCHART© will include three-dimensional representations of these navigational reference points.
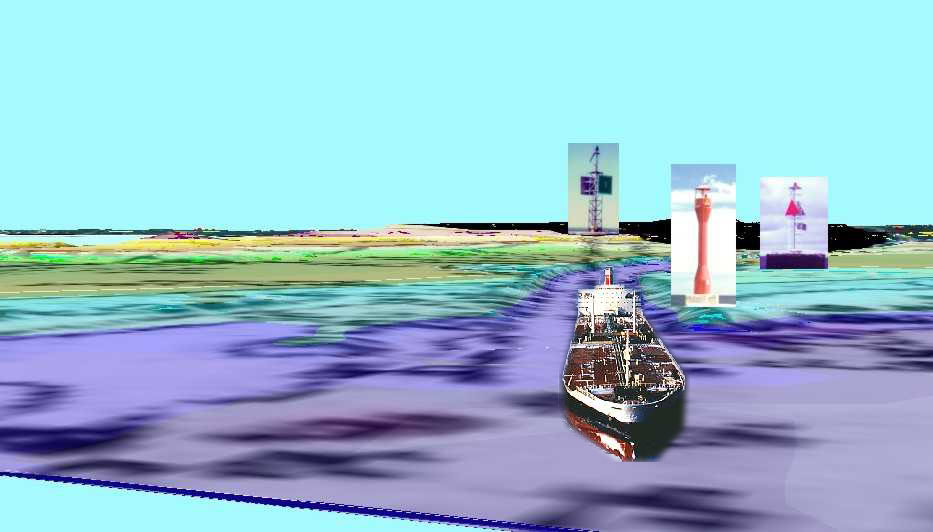
FIG 5.1 (Above): ZOOM INTO 3D CHART OVERLAY (ON NORTHERN CANAL, MASS BAY EXIT) OF FEDERAL DATA TIN FOR THE ILLUSTRATION OF 3D NAVAID INSERTION INTO 3D CHART.
FIG 5.2 (Below): ZOOM INTO 3D CHART OVERLAY (ON SOUTHERN CANAL, BUZZARDS BAY ENTRANCE) OF FEDERAL DATA TIN FOR THE ILLUSTRATION OF 3D NAVAID INSERTION INTO 3D CHART.
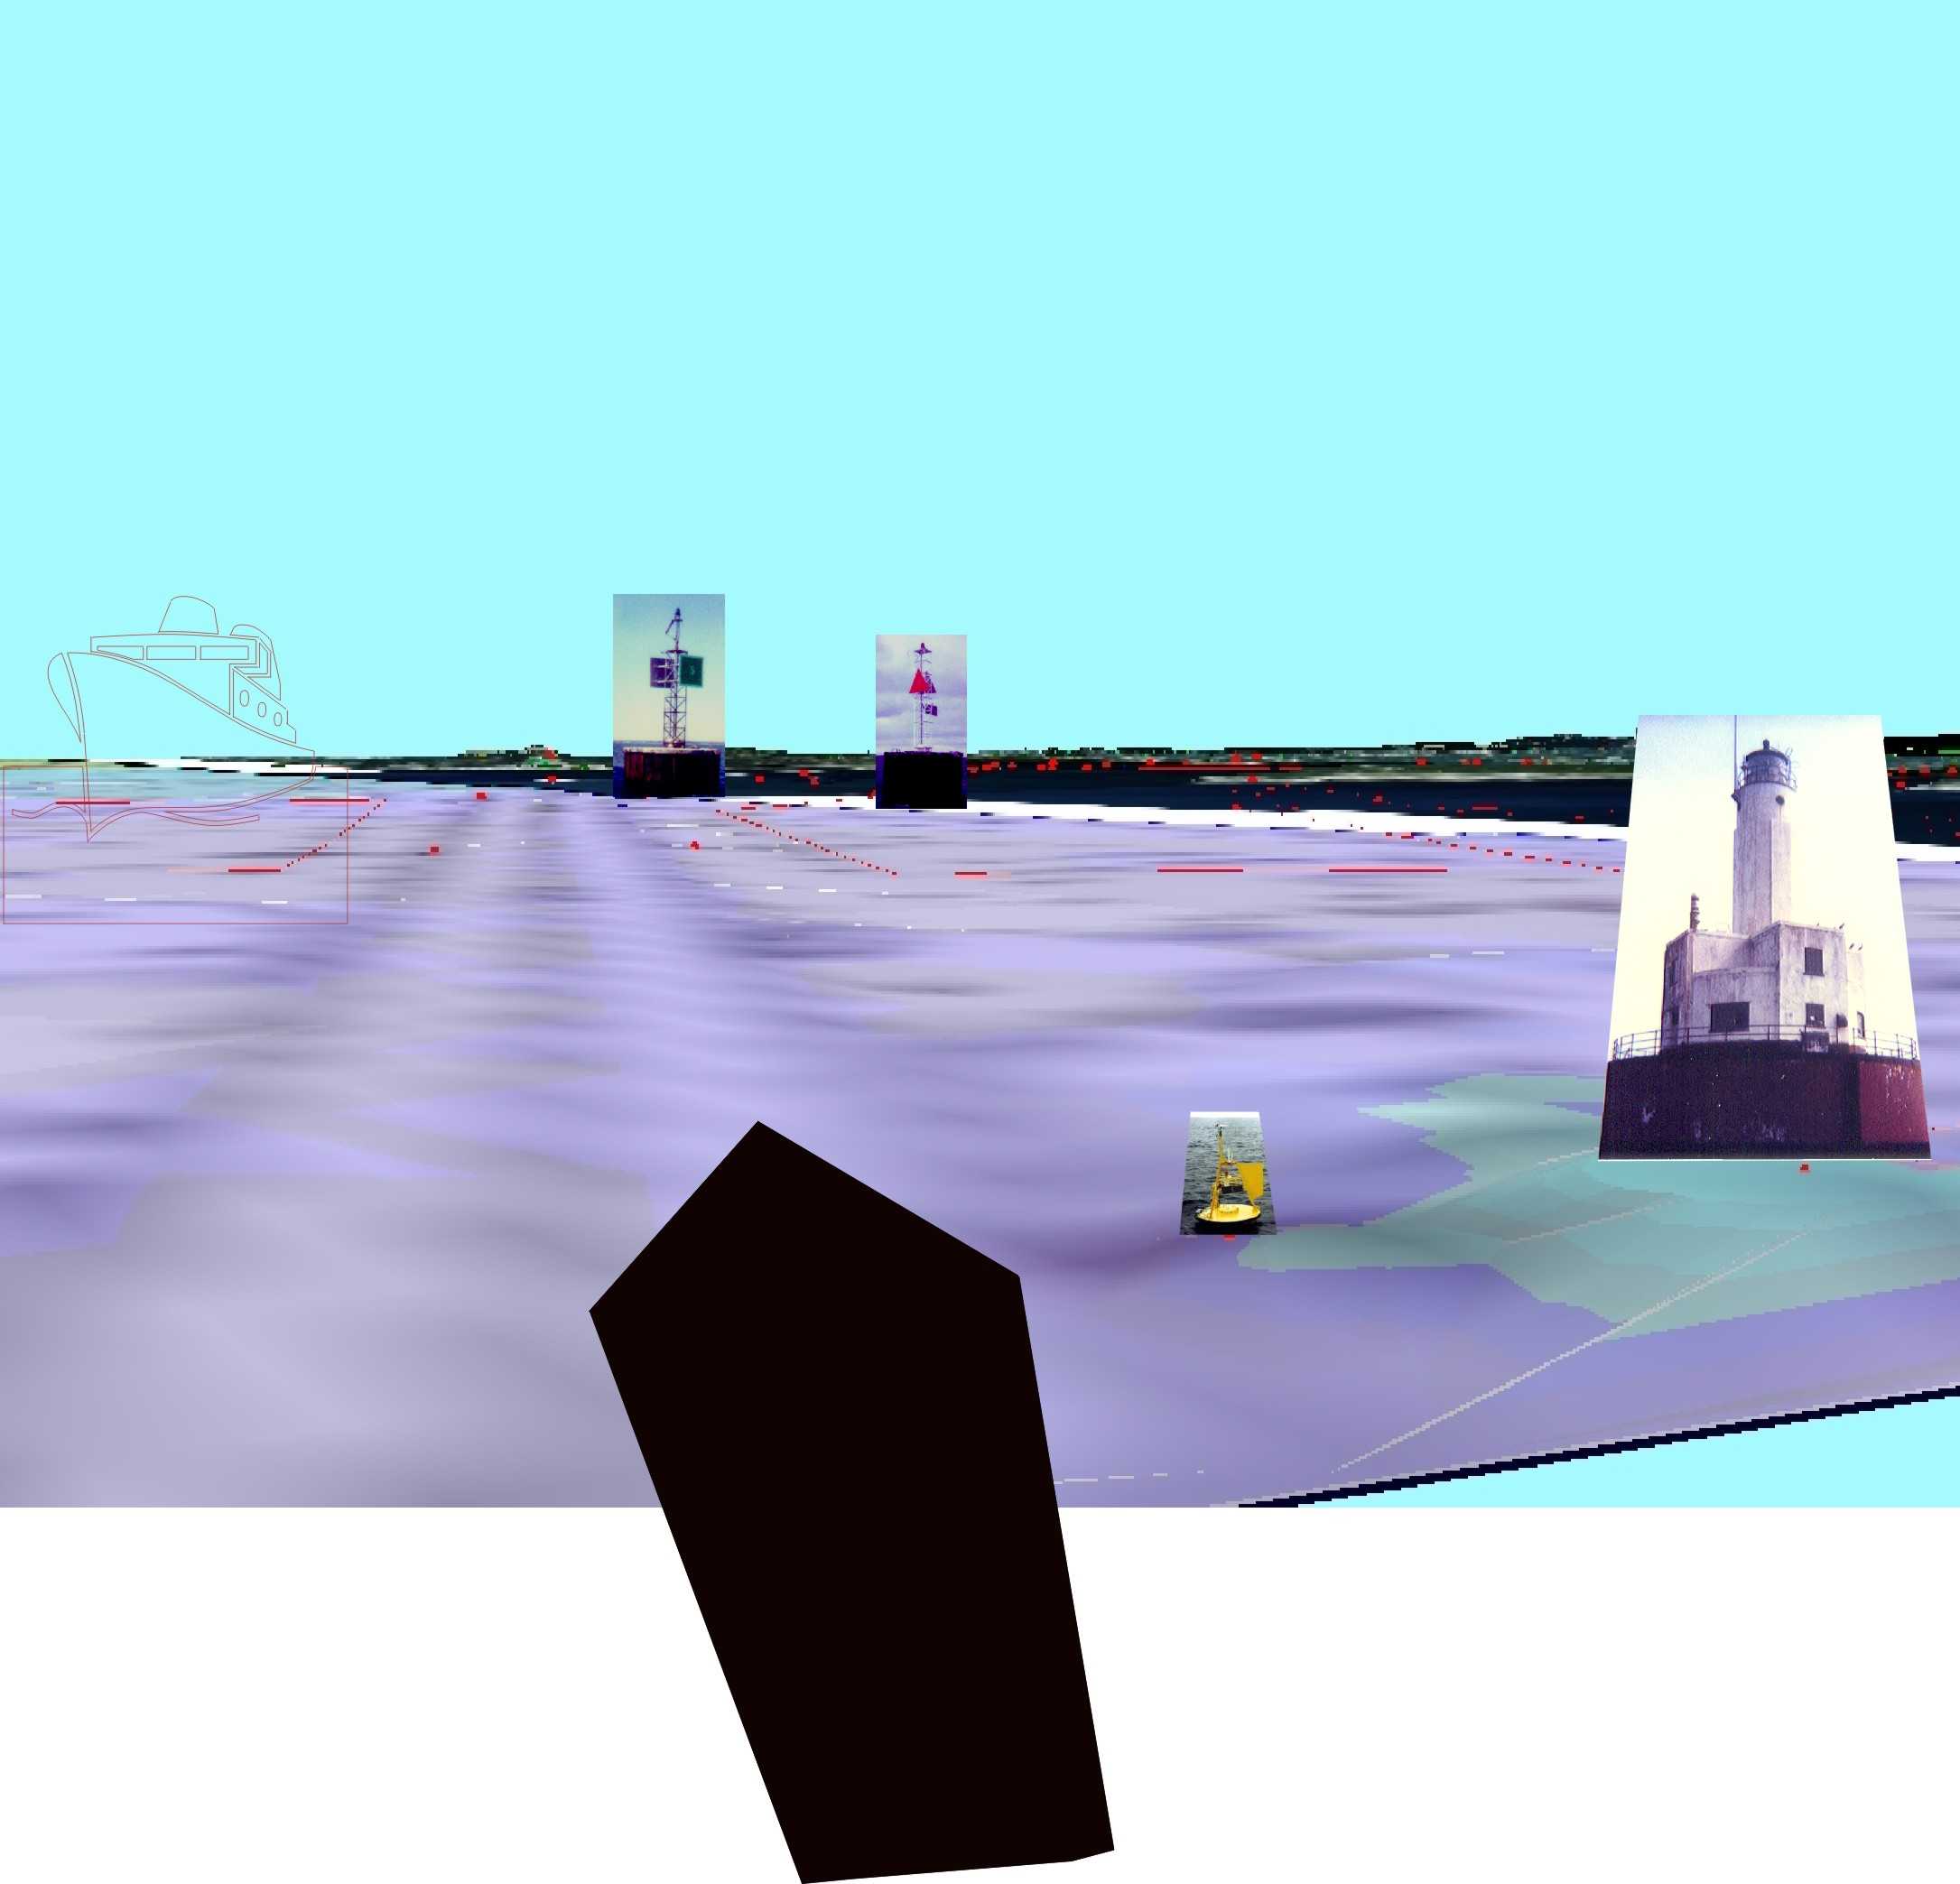
It is readily evident that the use of three-dimensional objects for aids to navigation will reduce the amount of script required on the raster chart image (and in the corresponding Coast Pilots). They also reduce the amount of time and effort of the mariner to identify and interpret the navaid. This, in turn, reduces the risks of an incident due to faulty navigation and it increases the amount of the mariner’s time spent "looking out" (the best collision reducer). Improved visual, data communication reduces vessel risks.
In the 3DCHART©, the aid to navigation attributes can be queried singly or as a group (above) and the inquiry will generate an on-screen attribute table with name, characteristics and location of the queried object or line in the 2D display window. In 3DSMARTCHART© the visual characteristics will be apparent and it will not be necessary to list them in a table.REAL-WORLD 3DSMARTCHART©:
The ultimate goal of the 3DCHART® project is the production of an integrated, real-time navigation system, which is called the 3DSMARTCHART®. It will accurately reveal the seafloor bathymetry to the mariner in a three-dimensional manner and enable the mariner to "fly" the vessel amongst the hazards, obstructions and perils of the depths with the added benefit of real-time sensors for water level, tidal current and meteorological data. The 3DCHART® will be integrated as the core element of 3DSMARTCHART®. The system will provide the mariners with their vessel’s position and a geo-spatial view perspective of their bathymetry, topography and real-time tide/current/meteorology parameters. CZM personnel will have real-time imagery for disaster mitigation/response.
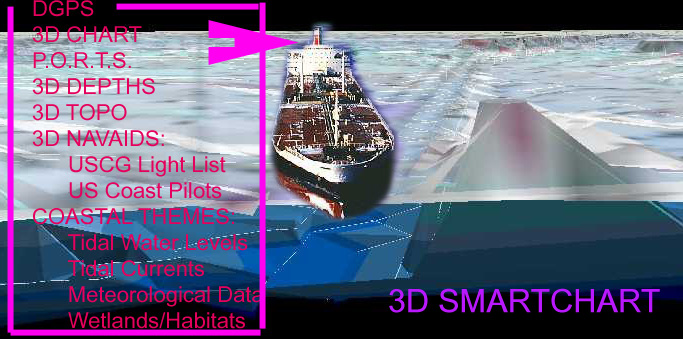
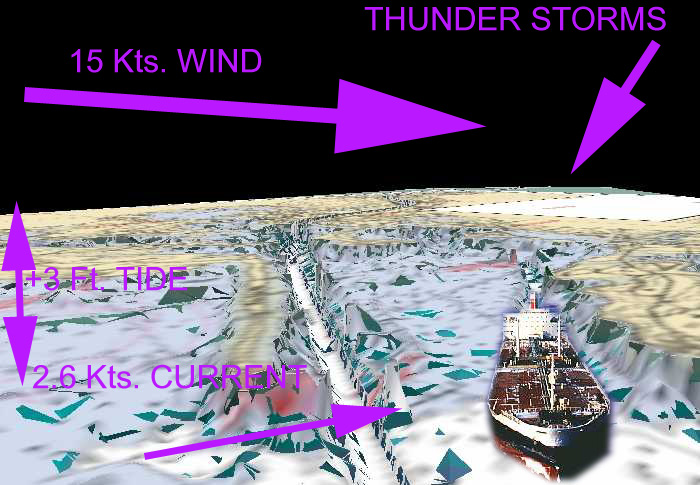
FIG 6.1 (Above): ZOOM INTO 3D CHART OVERLAY (ON SOUTHERN CANAL,BUZZARD'S BAY EXIT) OF FEDERAL DATA TIN FOR THE ILLUSTRATION OF PARAMETRIC INPUTS OF 3D SMARTCHART©.
FIG 6.2 (Below): ZOOM INTO 3D CHART OVERLAY (ON SOUTHERN CANAL, BUZZARDS BAY EXIT) OF FEDERAL DATA TIN FOR THE ILLUSTRATION OF MANEUVERING INFORMATION PARAMETERS OF 3D SMARTCHART©.
FUTURE RESEARCH:
As with any good project, this endeavor has raised as many questions as it has answered.
Areas for future investigation include:
PROJECT RESULTS:
CONCLUSIONS:
Federal Recommendations:
Software Recommendations for Esri (Arcview, 3D Analyst, Arc/Info)
SUMMARY:
This paper encapsulates the author's twenty-seven years experience with shifts in navigational technology and provides an insight into the construction of the first 3DCHART® by digitization and the application of GIS tools. Further insight into the development of a 3D chart from federal data sets was provided, as well as a comparison of the two methodologies and their results. The needs and benefits of a 3DCHART® for the Mariner and the Coastal Zone Manager were adequately portrayed. Technical issues of the 3D chart Project were conveyed and areas of future research identified. At present, digitization of the existing NOAA charts appears to be the most direct means of producing 3D Nautical Charts. Federal data sets for computerized production of 3D Nautical Charts have as many variations as the number of federal agencies involved in the data collection, processing, and dissemination. These variants provide many complications to the 3D chart development process.
Areas for Federal attention were identified and discussed with a call for improvement of USGS data sets in the coastal zone areas. Ample justification for the detailed collection and dissemination of 3D data by the Federal Agencies has been provided.
Recommendations for federal agencies and software manufacturers have been provided which reflect the need for 21st Century thinking and preparation. Hardware vendors must develop 254 dpi monitors, soonest, in order to eliminate the over-scaling problem inherent in the technology of present monitors.
A 3DSMARTCHART® system for real-time applications was illustrated.
Raster nautical charts will have a role in 21st Century marine transportation as vector charts are being developed. Real-time chart inputs will follow. A PC display of a 3D Nautical chart has now been constructed and is ready to begin field assessment and testing. Virtual Reality Charts {15} are a foreseeable "all weather", three dimensional chart development. Fiscal constraints must not inhibit NOAA charting and surveying activities for 3D data is key to "understanding" many scientific, marine. transportation and coastal zone issues of the 21st Century.
The paper emphasizes what a practical navigator and cartographer must know and respect, if they wish to avoid a "technology assisted incident" and avoid becoming a "statistic" in the implementation period that has followed each new maritime technology, such as Radar, Collision Avoidance Systems (CAS), Very High Frequency radio (VHF), Automatic Radar Plotting Aid (ARPA), and Global Positioning System (GPS). Lessons learned from these technologies will be appropriate for the new 3D Nautical Chart.
The significance of this work is the achievement of a more informed cartographic and navigational community that will result in federal and cartographic support for enhanced navigation safety and improved scientific understanding of the ocean process by the use of 3D nautical electronic charts through GIS applications.
ACKNOWLEDGEMENT:
The author gratefully acknowledges the support and contribution of MASSGIS orthophoto and thematic data that formed a portion of this project. Massgis is located at 20 Somer Street, 3rd floor, Boston, MA. 02108.
BIOGRAPHY:
Captain Stephen F. Ford is a 1970 graduate of the U.S. Merchant Marine Academy with
a 1978 MBA from the University of Houston. He is a Master Mariner of fifteen years
seagoing experience; Past Vice President of a U. S. flag shipping company of nine vessels,
and Head of Marine Transportation Department, of Texas A&M University at Galveston
from 1988 to 1996. Captain Ford’s service of three years as the P.O.R.T.S. Manager of
the Houston/Galveston system; eight years on the USCG Navigation Safety Advisory Committee
(NAVSAC); twelve years as member of the Houston/Galveston Navigation Safety Advisory
Council (HOGANSAC); plus four years service on the Houston Pilot Review Board amply
qualifies him for his technical, academic, expert and consultant roles in the U. S.
maritime industry.
In the mid-1970's Captain Ford developed the first electronic chart that was the
prototype to modern electronic navigation charts (ENC) and ECDIS devices. In the
influenced the development of Electronic Chart Display and Information Systems (ECDIS). In
the 1990's he proposed the development of "SMART CHARTS" for the
second-generation ECDIS units. This concept includes real-time sensor inputs to vector
ENC’s in order to give the mariners a "Management Information System"
onboard their vessel. Selected as one of ten key maritime industry personnel, he
participated in a 1993 NOAA initiative concerning "Modernizing Navigation
Services" to guide senior government leaders in their preparation for the 21st
Century.
In 1998, Captain Ford attained a second Master’s Degree in Geographic Information
Systems from Clark University. Now, he shares his subsequent research to create a
three-dimensional nautical chart. In addition to his professional activities, he has over
a dozen publications on a variety of maritime technology topics.
BIBLIOGRAPHY:
http://www.usm.maine.edu/~maps/exhibit2/sec4.htm, Osher Map Library, University of Southern Maine, Portland
3. Author, Unknown, 1999, http://anchor.ncd.noaa.gov/buoys/chartdesc.htm, NOAA website
4.Cooper, R. B. and Britsche, W. R., 1981, "An At-Sea Experiment for the Comparative Evaluation of Radar Piloting Techniques" DOT/USCG Report EA-81-U-66, 1981.
5. "DEM_75_Metadata.txt" from NOAA Bathymetric Dataset
6. Elfring, Lt. F. R. and Gonin, I. M., 1996, "Out Of The Fog", Proceedings Of The Marine Safety Council , July-September 1996, pp. 20 - 25
7. Ford, S. F. et al, 1994, "Final Report of the Committee on Modernizing Navigation Services", NOAA, 1994
8.Ford, S. F., 1994, "ENC: The Template For An International Geographic Information System", PACON ‘94 Proceedings, Australia
9.Ford, S. F., 1994, "ECDIS: Revolutionary or Evolutionary" The Navigation Institute, 1994 NationalTechnical Meeting Proceedings, January 25, 1994.
10. Ford, S. F., 1996,"Virtual Reality: The Solution for the Mariner’s All Weather Port", The Institute of Navigation Proceedings of the 52nd Annual Meeting, June 19-21, 1996, pp. 357-363.
11.Ford, S. F. and Bald, R. J., 1997, "Houston/Galveston Safe Passage Into The 21st Century, 1996, Proceedings of Seventh (1997) International Offshore and Polar Engineering ( ISOPE ) Conference, May 1997, pp.297 – 303
12. Fox, C. G., Bobbitt, M. A., and Wright, D. J., 1966, Integration and distribution of deepsea oceanographic data from the NE Pacific using ARC/INFO and Arcview, Proceedings of the 16th Annual Esri User Conference, Palm Springs, CA., Paper 293
13. International Maritime Organization, Performance Standards for Electronic Chart Display and Information Systems (ECDIS), A 19/Res 817, November 23, 1995
14. Kumler, M. P., 1994, An Intensive Comparison of Triangulated Irregular Networks (TINs) and Digital Elevation Models (DEMs), University of Toronto Press, 1994
15. Konda, Ford, Landphar, Larsen, and Basillato, 1997, "Proof of Graphic Concepts for Ship Piloting and Docking in Restricted Visibility Conditions", SWUTC-98/467407-1
16. Klepsvik, Dr. J. O. and Bjarnar, M. L., 1996, "Laser-Radar Technology for Underwater Inspection, Mapping", Sea Technology, January 1996 pp. 49 - 52
17.Lindholm, M., Wester, Mark E., Lehtosald, J., 1996, "Tools For Support Decision Making in Navigation With Integrated Bridge Systems", Institute of Navigation Proceedings of the 52nd Annual Meeting, 1996, pp. 335 - 341.
18.Lindholm, M., Laatu, S., Suhonen, M., and Ahvenjarvi, S., 1996,"SILJAQC, A New Concept for Navigational Quality Control", Institute of Navigation Proceedings of the 52nd Annual Meeting, June 19-21, 1996, pp. 349 - 355.
19.Lockwood, M. and Li, R., 1995, Marine Geographic Information Systems: What Sets Them Apart ?, Marine Geodesy, 18, pp. 157 – 159
20.Maloney, F. W., Clarke, RADM. J. P., Willis, Commodore R. J., Law, Captain D., van der Poel, Captain L. P. and Usher, Cdr. P. F. K., 1997, "The Case For Raster Nautical Charts", Sea Technology, June 1997, pp. 10 – 15
21. Minkel, LCDR. David H., and Whitney, Gene, 1992, "Implementation of Differential GPS at the Coast and Geodetic Survey", Fifth Biennial National Ocean Service IHO Conference, 1992, pp. 31 - 36.
22.Smith, Walter H. F., and Sandwell, David T., 1997, "Global Sea Floor Topography From Satellite Altimetry and Ship Depth Soundings", September 26, 1997, Science (Vol. 277), pp. 1956-1962
23.Stembel, Oren E. and Yellin, Martin J., 1999, " Raster Nautical Charts: Effect of Scan Resolution and Screen Resolution on the Quality and Scale of the Chart", http://chartmaker.ncd.noaa.gov/ocs/rnc/newpaper.htm
24."Standards for Digital Elevation Models" by U.S. Department of Interior, U. S. Geological Survey, National Mapping Division, August 1997
25.Pryor, Don, 1993, "Modernizing Navigation and Positioning Services", NOAA Presentation, July 9, 1993
26.Remondi, B. W., 1992, "Real-time Centimeter-accuracy GPS for Marine Applications", Fifth Biennial National Ocean Service IHO Conference, 1992, pp. 19-23.
27.Richards, Captain Tom, 1993,"Updating Nautical Surveys", NOAA presentation, Fall 1993
28.Tanner, W. F., 1976, "Standards for Measuring Shoreline Changes", Coastal Research and the Geology Department, Florida State University, Tallahasse, FL., 1976
29.Whitman, Dr. D. C., 1996, "Laser Airborne Bathymetry - Lifting the Littoral", Sea Technology, August 1996, pp.95 – 98
30. Wright, D. J. and Goodchild, M. F., 1997, Data from the Deep: Implications for the GIS Community, Int. Journal Geographic Information Systems, 11(6), pp. 523 - 528
31. "1995-2005 Strategic Plan, National Oceanic and Atmospheric Administration", July 15, 1993, NOAA Document.