Paper 224
Jonathan McDowell
GIS Specialist
Clackamas County
You Want Me to Do What without Ground Control? A Comparative between GPS Control Points and Photogrammetry
Abstract
A critical aspect of enhancing a tax lot data layer with ARC COGO is the rectification of available ground control points to corresponding points in the coverage. This paper will explore two methods of selecting ground control features, one with traditional surveyed points and the other using high-resolution digital photography and photogrammetrics, and compare these methods in positional accuracy and precision.
Background
Clackamas County is currently using a tax lot base created by a local utility, Portland General Electric (PGE). PGE used the map for locating power poles and lampposts. Metro, the regional government for the Portland Metropolitan area, then bought the base map from PGE. The GIS staff maintained the coverage to meet the needs of their planners. The Clackamas County Assessor’s Office has since taken over the maintenance of the base map. The cartographer working on the base map improved its quality. He has done this by using platted surveys, legal descriptions, and moving the current base map to fit the ortho photography. However, the base map still contains an error of +/- 40 feet. This error is due to the source of control. The existing control coverage was generated from the section corners on the USGS 7.5-minute topoquadrangles. This coverage is stored in NAD83 State Plane, Oregon North Zone.
In 1996, the City of Lake Oswego approached Clackamas County about enhancing its portion of the tax lot base map. They wanted a more precise method of creating a base map. Instead of having the tax lots digitized, they wanted all the plats, partition plats, and metes and bounds captured using coordinate geometry. In order to assist Clackamas County in creating a new base map, both parties agreed to share the cost. Lake Oswego agreed to pay for the data capture of the plats. Clackamas County agreed to use the cadastral data to build a new tax lot base for the City.
Approximately one year after the project started, the City of West Linn decided to join the project. They needed a more accurate base map to maintain their utility information. Currently the sewer and water lines are displayed as though they are running through the middle of homes.
The staff at West Linn, Lake Oswego, and Clackamas County all want similar functionality from a tax lot base map. They want a base map that serves as a tool for land use planning, maintenance of utility data, provides precise cadastral dimensions, and displays well with the orthophotography at one inch equal to one hundred feet. In order to meet this need, not only do they need to rebuild the tax lot base maps; they need to provide control to tie the new base map to real world coordinates. What makes this project unique is how West Linn and Lake Oswego went about creating their separate control networks. Both jurisdictions provided functional and precise control. The staff at the City of West Linn decided to use road intersection points. These points were derived from 1996 digital orthophotography, which will serve as interim control until the County Surveyor restores the section ¼ corners with GPS. Concurrently, the City of Lake Oswego hired a third party to capture points throughout the city using GPS.
Geography
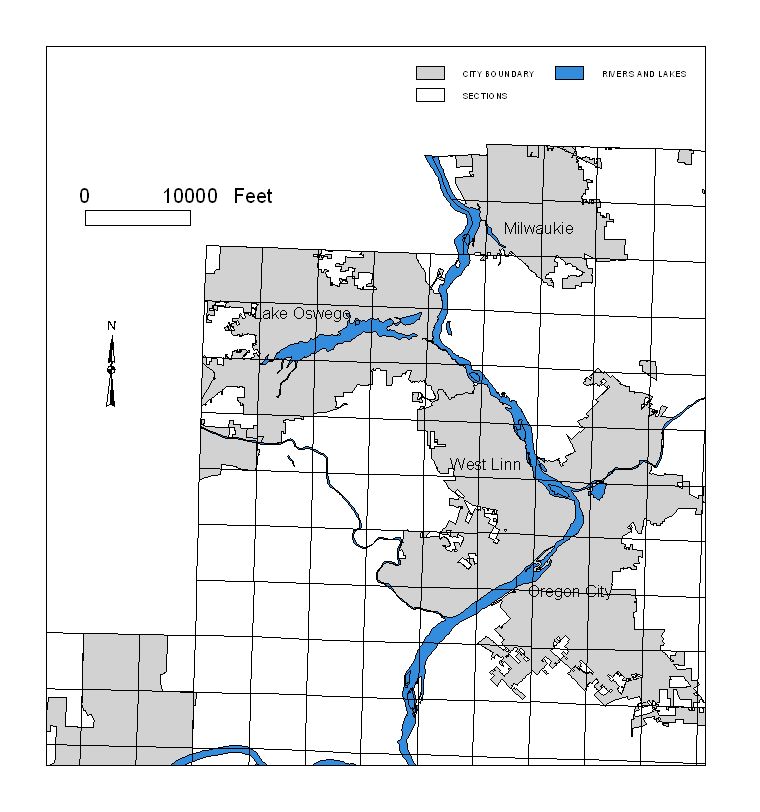
West Linn is directly south of the City of Lake Oswego. The two cities share a common border that stretches approximately 21/2 miles through sections 14 and 15 Township 2 south and Range 1 east of the Willamette Meridian. (See figure 1.)
Figure 1
The Control
Lake Oswego
For Lake Oswego, the original plan was to have two phases. Phase one involved having the plats digitized using ARC COGO and creating a control network with GPS. The GPS survey measured the following features: monuments with plats, benchmarks, manholes, water access, drainage, aerial photography control points, donated land corners, and the easy to find section corners. Lake Oswego hired Orbtech to do the GPS survey. The staff at the city of Lake Oswego decided to name their control coverage Lo_control. (See Figure 2.)
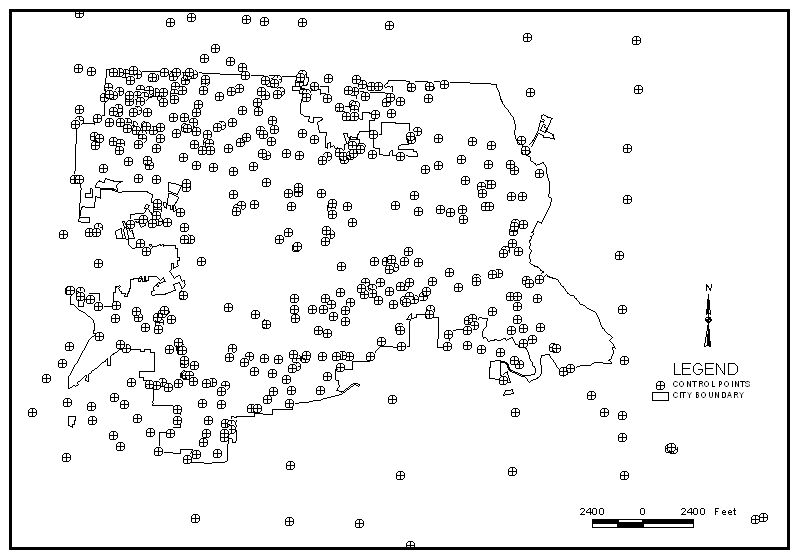
Figure 2
According to the recorded survey, PS-28717, the project required the points to have HARN state plane, Oregon North Zone coordinates and NGVD 29 elevation points.
The GPS baselines were combined in a free least squares adjustment to check the validity of the GPS measurements within themselves, with the largest error ellipse (2s/95% confidence level) having a semi major axis of 0.05 feet (16mm) at station CHAS, with the largest vertical residual being 0.05 feet (16mm) also at station CHAS. The network was then constrained to HARN stations CHAS and term RESET (holding the latitude, longitude and ellipsoid height of the published coordinates) with the largest error ellipse having a semi major axis 0.02 feet (8mm) at stations CLO #4 and CLO #5, with the largest vertical residual being 0.03 feet (10mm), at station CLO #7. The adjusted WGS84 coordinates were then transformed to NAD83 (91) state plane coordinates Oregon North Zone (3601) by applying the zone parameters to the GS measurements. Orthometric heights as shown in this survey are from differential level runs from the nearest benchmark in the City of Lake Oswego vertical network and were provided by the City of Lake Oswego Surveyor, Gerald B. King, LS 1997.
-PS - 28717 recorded at the Clackamas County Surveyors Office
Orbtech was contracted to conduct the survey. The surveyor used static GPS methods on tripods to perform a control survey that established seven control points. The seven points provided the base for the measurement of additional 17,684 features. A RTK GPS with a hand held range pole was used to collect these features. All of the measurements were taken with either one of two Leica system 200 dual frequency GPS receivers or a Leica system 300 dual frequency GPS receivers. According to the survey, the manufacturer’s level of accuracy for this equipment is 5-mm +/- 1 PPM for static surveys. To process the GPS baseline, the survey used Leica Ski, versions 2.1, 2.11, and 2.2 software. All of the measurements were adjusted to the final project coordinates simultaneously.
In order to make the surveys relate to each plat, a name was given to each point based on geography and sequence of identification. The name for the control point located at the southwest corner of lot 24, block 1, of Westlake in Section 6, Township 2 South, Range 1 East, is E06C-010PL. The first four characters show where the point is actually located. The majority of the city is located in Section 2 South, Range 1 East of the Willamette Meridian. The part of the city outside of this township is located in the adjacent county to the north, Multnomah. In simplify the location of a section in county, a standardized naming convention was developed. Since the county is located south the range line, it is dropped from the name. Also, the Department of Revenue has named the ¼ and 1/16 alphabetically also contributes to the naming convention. (See Figure 3.)
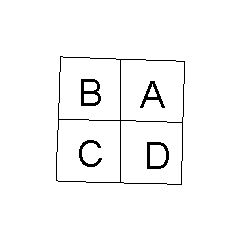
Figure 3
For example, to appropriately identify the Section 6, Township 2 South, Range 1 East, it is written as 21E06C. Since the control survey is for the part in Township 2 South, Range 1 East, the 21 is dropped to create E06C. The next three characters identify the order it was surveyed. In this case 010 means it was the tenth point surveyed. The last two characters are the identifier code. PL means it is a plat point. A plat point is a control point for a plat. There are other identifiers. SU means it's a survey unit. A survey unit is a Donated Land Corner or Section corner.
Before West Linn joined the tax lot enhancement project, the city engineers decided to derive control from 1996 black and white orthophotography. The process involved identifying the center of each road intersection in the city at the time of the flight. The first step was to look for the centerline spikes in the center of the intersections. The centerline spike is a steel spike driven into the asphalt or concrete marking the center of the intersection. Then a white circle was painted around the spike so the camera could photographed the spot. If the road centerline did not exist, then the approximate center of the road intersection was estimated. The photogrammetrist located these points and put them into an AutoCAD drawing file titled Contour4pt. (See Figure 4.)
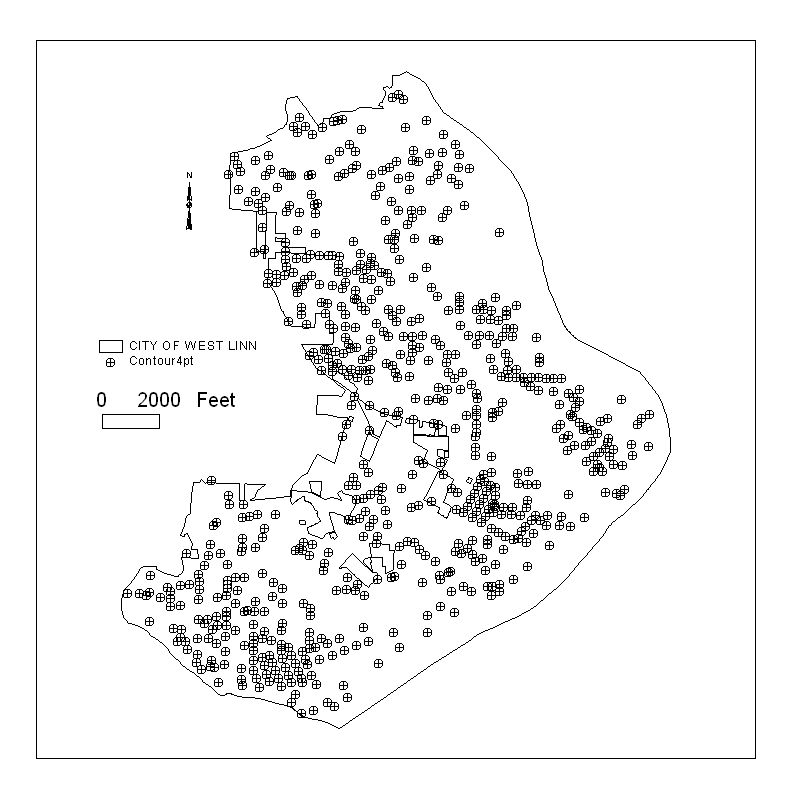
Figure 4
The control for the photography for West Linn was derived from known points in the vicinity. These points were captured using GPS. The photogrammetric network is in international feet. The coordinate system is NAD83 HARN, State Plane, Oregon North Zone. The vertical data used in NGVD 29m National Geodetic Survey High Precision Network stations TERM, ROCKY BUTTE RESET, and MACK. The following stations set by the Oregon Department of Transportation are also used: Z 450 and U 631. The primary vertical control were derived from the Nation Geodetic Survey Benchmarks X 211, Y 723, and V 723. David and Smith Associates converted the primary vertical control to NAVD 88 vertical datum, and 1.06-meters to the NGVD 29 elevation.
The Tools
The ArcEdit module, ARC COGO, is the primary software used in rectifying the plats to control. Modifications were made to the ArcInfo 7.x menu as and interface to remove redundancy in data entry work. The entire move, copy, and rotate menus had additional buttons added. These three buttons allow the user to quickly toggle among the three edit features: arcs, labels, and annotation. (See figure 5.)
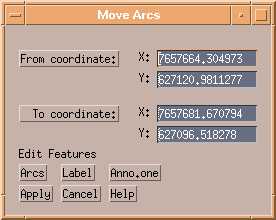
Figure 5
Another menu addition allows the user to select the desired control coverage and set the snap environment accordingly.
A control button added to the main ARC COGO edit menu that allows the user to set the control coverage. The button initiates the Controlcov AML. The Controlcov AML sets the selected control as a back coverage, sets the snapcoverage, and the necessary snapping features. By changing the snap cover, it becomes possible to get the coordinates for the control point without changing edit coverages. Setting the options to none and either node or label respectively, maintains the ability to get the coordinates for the nodes in the edit coverage. (See figure 6)
/* controlcov.aml
/*
/*======================================================================
/*
/* Purpose: To set the to the backenv a control coverage. And to set the
/* back coverage to the snap coverage. Depending on the control
/* coverage, sets the appropriate snap features.
/* contour4pt: sf none label
/* lo_control: sf none label
/* seclines : sf none node
/*
/*======================================================================
&sv controlpath = /atax/cogo/control
&if %.controlexists% &then &do
rb %controlpath%/%.controlcov%
cogoenv
&end
&sv .controlcov = [getchoice contour4pt lo_control seclines none -prompt 'Select Control Coverage']
&if %.controlcov% = contour4pt &then &do
bc %controlpath%/%.controlcov% 36
be label
sc %controlpath%/%.controlcov%
sf none label
&sv .controlexists = .TRUE.
&end
&if %.controlcov% = lo_control &then &do
bc %controlpath%/%.controlcov% 36
be label
sc %controlpath%/%.controlcov%
sf none label
&sv .controlexists = .TRUE.
&end
&if %.controlcov% = seclines &then &do
bc %controlpath%/%.controlcov% 6
be arc tics
sc %controlpath%/%.controlcov%
sf none tics
&sv .controlexists = .TRUE.
&end
draw
&return
Figure 6
In addition to the programs, digital orthophotography is used as a quality assurance. The photography is used to double-check the positioning of the plats. If there is a discrepancy with the relationship of the plats, the photography is used check to see how the surveys relate to each other on the ground.
The Process
The Lake Oswego Method
There are five steps involved in adjusting the plats to control. The first step is to identify all of the plats for the section being built. The second step is to identify and locate the tie point 1 and 2 for each plat. Next, control points 1 and 2 are identified and located. Tie point 1 is snapped to control point 1 and tie point 2 is rotated to match control point 2. Finally, the inverse between tie point 2 and control point 2 is taken to identify the error. If the error is greater than .5th-ft, than it is noted and referred to when the plats are appended together. The plat with the lowest error holds it position. The plats with greater error are moved to fit the better data.
The following describes the process of placing the for mention plat, 2671 Westlake to Lake Oswego’s Control. This plat is located in the SW ¼ of Section 6, Township 2 South, Range 1 East. This plat was identified during step one, the inventory of the section.
Now step two, identifying the control points. According to the index, tie point 1 is located on the east corner of lot 24, block 4 of Westlake. Tie point 2 is located on the southwest corner of Lot 24, Block 4 of Westlake. (See figure 7)
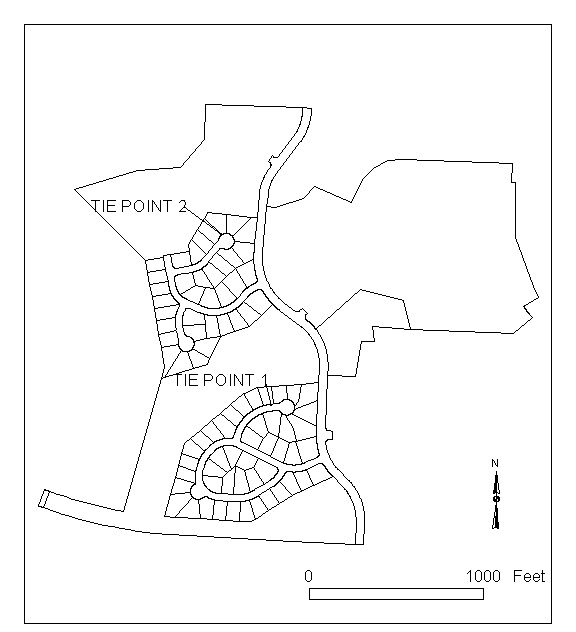
Figure 7
Next, the control points are identified and located. The control point associated with tie point 1 is E06C-010PL. The control point associated with tie point 2 is E06C-069PL.
The Plat, Westlake, is moved so the coordinates for tie point 1 are the same as the associated control point. The plat is rotated so tie point 2 is matched with its associated control point. (See figure 8)
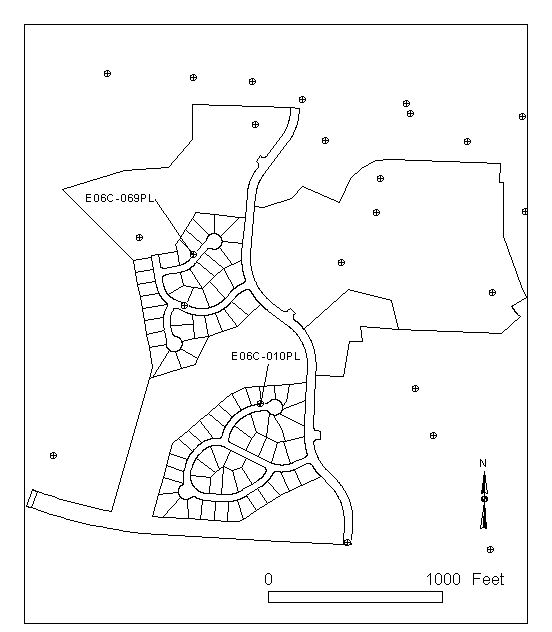
Figure 8
Finally, the inverse between tie point 2 it’s associated control point is measured. The error for Westlake is .11-ft or 1.38-in. This is within the tolerances of the project and control. (See Figure 9)
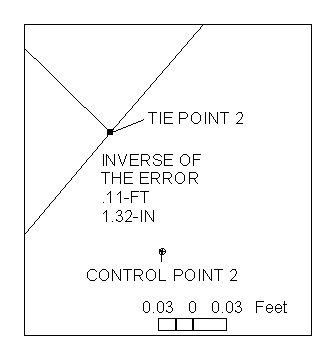
Figure 9
The West Linn Method
Since there are no predefined tie points for West Linn’s control, a different approach to rectifying the plats is used. The goal for this part of the project is to maintain the spatial relationship of the arcs to each other, not the ground control. In the future, when section corner control points become available, the plats will be shifted to match the better control. In order to get the plats to work with the road intersections, they are appended together. The best intersections are identified on the photography and within the appended plat coverage. Then the plats are moved to match the control.
The two methods are the same up to this point. The plat inventory is complete for a section. When section 34 was built, plat number 3066, Rivers Edge, was chosen as the starting plat. (See figure 10.)
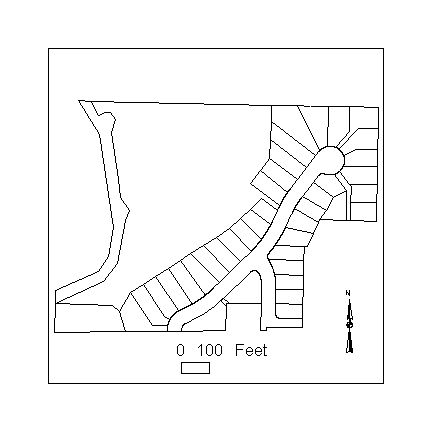
Figure 10
Then all the adjacent plats are appended to it. If any problems such as overlaps or gaps found between the plats, they are dealt with at this point. If the plats share an initial point, they are appended at this location and rotated to match along the common line.
If they do not share a common line, but share a boundary along a right-of-way, then they are matched to that point. Else, they are matched to the longest common boundary line. Next, the tie points and control points are located. (See figure 11.)
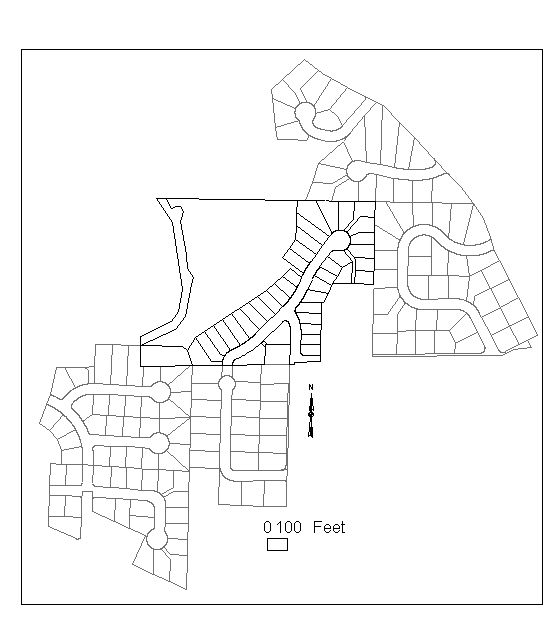
Figure 11
The best places to use for tie points are the straight t-intersections. The curves have a tendency to distort the placing of plats. Fortunately, in this example, the road intersections that are used as control are also located at the edge to the plats. Tie point one is located in the southwest part of the plats, and tie point 2 is located on the east side. Using the orthophotography for this section, the coinciding control points are located. (See figure 12.)
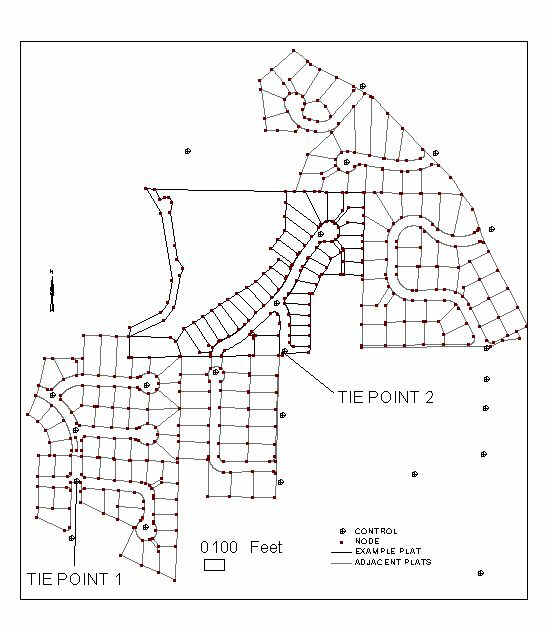
Figure 12
Now the plats are moved in position. This step is similar to the rectifying plats for Lake Oswego. However, process of placing them to control is different. By using all of the intersections available, the user can determine what two points work best for ground control. In the example, only two points are usable. (See figure 13.)
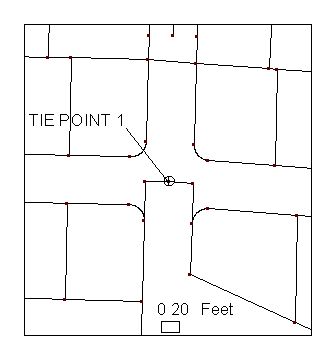
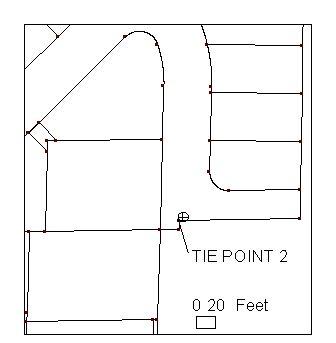
Figure 13
What was Learned
Lake Oswego
Lake Oswego’s control coverage was not as complete as originally thought at the start of the project. Before the field survey was conducted, two points were identified in the office. The City Surveyor went out and uncovered or marked the locations of the control points for the third party contractor to survey. Some points that were not captured due to the high percentage of dense tree cover making it difficult or impossible to get enough satellites to capture the point with GPS. (See Figure 14.)
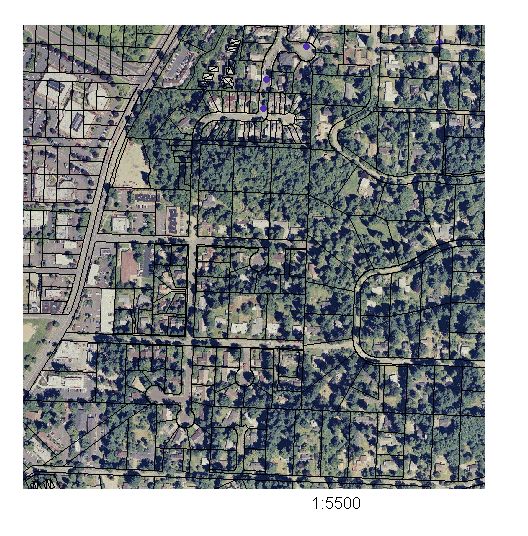
Figure 14
Another problem that occurred because of the control coverage involved edge tying the sections. In order to resolve this issue, the city surveyor found as many of the section ¼ corners as possible. Due to time and the lack of maintenance from previously elected county surveyors, some of the section corners could not be located. (The current elected county surveyor is correctly restoring the corners and establishing a control network using GPS.) (See figure 15)
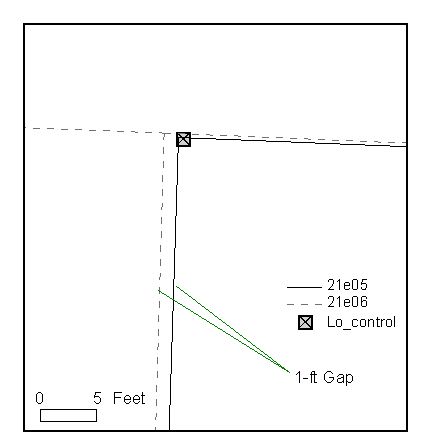
Figure 15
There were also occurrences of control points that did not met the .5-ft tolerance. In the image below, the control points cause the plat to overlap both adjacent plats to the North and the South. In the case, the control was thrown out and the plat with was adjusted to a new source of control. In order to solve the issues of missing or erroneous control, the city surveyor went out and to obtain the NAD83 HPGN coordinates for as many section corners as he could find. (See Figure 16.)
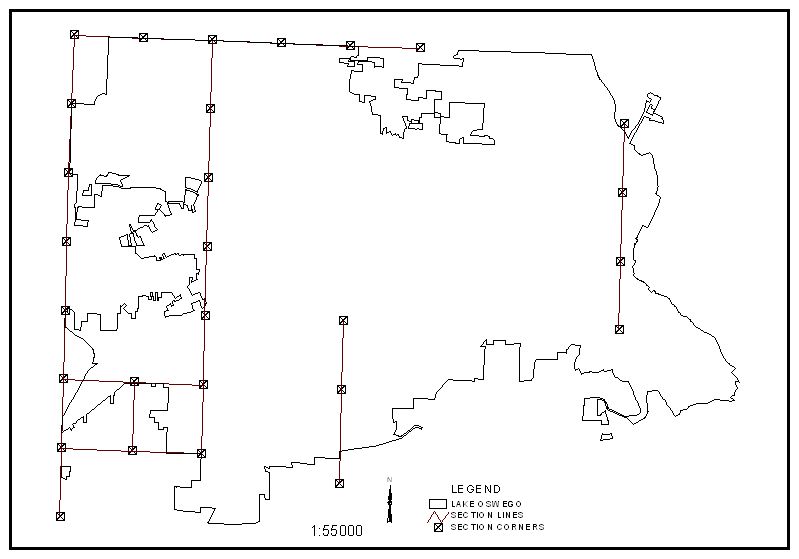
Figure 16
This allowed for a plat that did has questionable, limited, or no control to be rectified. In some areas where there were overlapping plats, having a common tie point brought both into project tolerances. The areas with a dense canopy cover are no longer a problem because there are now control points to tie the plats too.
The necessity of orthophotography became apparent in the part of the project. As stated previously, it would have been difficult to resolve the overlapping plat problems without knowing how it looked on the ground.
West Linn
The most apparent issue that occurred during this aspect of the project dealt with historical plats. Historical plats we surveyed in the mid-to-late nineteenth and early twenty centuries. When the plats were appended to each other and place to control, the error with in the historical plats became apparent. In one area, no matter where the plats were tied down, the inverse ¼ section did not match the control or the photography by over forty feet. In order to resolve this problem, the plats where appended in ¼ section blocks, placed to control, then the older plats were fit within the areas between the newer plats. The process of identifying the best control points became a guessing game. At first, the plats were moved into position the rotated to match the control. However, the plats did match the photography. Another point was chosen and the plats were readjusted.
The problem with edge-tying the sections also occurs with this method of control. However, most of the problems will not be resolved until the county surveyor provides new more precise geodetic control. In order to reduce the overlaps and gaps between the sections, all of the plats that overlap the section lines hold their position, and the adjacent plats are moved to fit them. The overall error between the tie points and the control points ranges between 3-ft and 7-ft. The more points within a section decrease the error. If there are only a few usable points, then the error increases. The ideal points are those located in an intersection that does not contain a curve. It was learned that using the intersections with curves increased the error by two feet.
Conclusion
There are other jurisdictions within Clackamas County that are involved in this project. Their part of the project is not in progress because of the lack of control. The City of Molalla is currently exploring Lake Oswego’s method of control. If they do decide to use this method, they will make sure to survey as many section corners as possible and common points shared by plats. If a jurisdiction decides to use West Linn’s method, it is recommended that they use road intersections that contain a road centerline spike and not to approximate the center.
Overall, the project is successful. Lake Oswego’s control original control network provided a functional tool for rectifying cadastral data. By having a minimum of two control points, a plat is placed and rotated and appended to adjacent plats with relative ease. However, there were a few problems due to dense tree cover and the lack of, section corners and few erroneous control points. West Linn’s control provides a temporary coverage, which allows the cadastral data to display well over digital orthophotography and utility data. Unfortunately, the data does not edge tie with adjacent sections and it is difficult to find control points that work.