
Introduction
The City of Los Angeles' Bureau of Street Lighting has developed a Map Maintenance application to allow users to display and update data attributes representing L.A.'s vast street lighting infrastructure. The Bureau manages approximately 230,000 street lights on city streets that span 15 council districts covering an area of more than 400 square miles. As one of the largest municipalities in the United States, the City of L.A. faces a major challenge in keeping its lighting system fully operational and in a safe and aesthetically pleasing condition.
Streetlighting Projects and System Maps
Figure 1: Shiela Kline's 1992 artwork "Vermonica" consists of over thirty vintage L.A. City electroliers, erected in a lot at Vermont Ave. and Santa Monica Blvd.
While most of L.A.'s streets are lit with modern, continuous lighting systems powered with 120-volt multiple (parallel) circuits and using energy efficient High Pressure Sodium lamps, there are also a great number of older ornamental lights still powered by antiquated series circuits and using inefficient incandescent lamps.
New streetlights are installed and existing ones retrofitted through the assessment improvement act of 1911 and by public works construction projects funded from various sources. Street lighting construction projects in the City of L.A. are usually designed by private consultants, while some are designed by in-house engineering staff. During the project's design phase, lighting designers heavily depend on so-called Street Lighting System Maps, or SLSMs--paper maps typically drawn at 100-scale and depicting physical locations and characteristics of street lights.
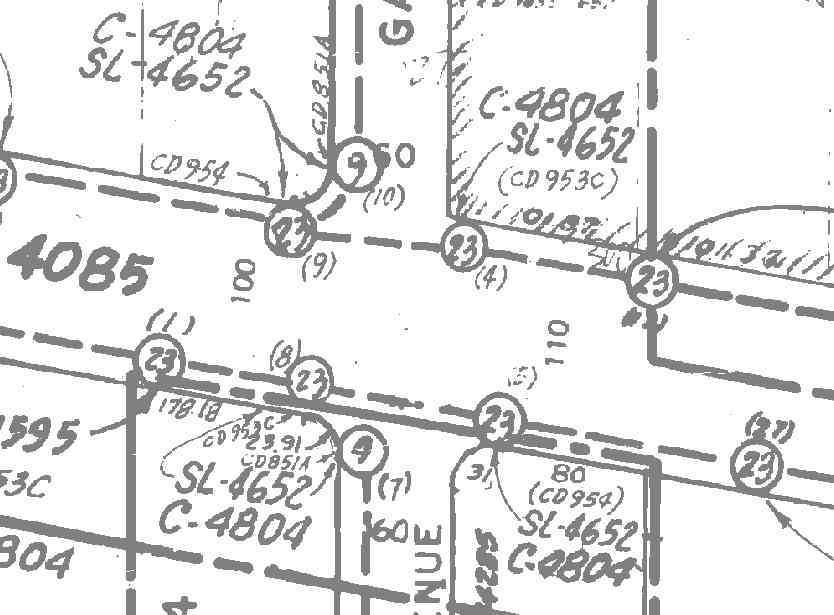
Figure 2: Street Lighting System Map Sample
The accuracy of the information on the street lighting system maps is crucial to a successful design and goes a long way in preventing repetitive field checks and costly change orders that lead to project cost overruns. The Bureau has always looked into ways of improving the quality and accuracy of system maps, and recently hired a private contractor to perform a data conversion of those maps into an Esri shapefile format.
While the conversion project was completed without
major problems, the responsibility for development of a maintenance application
to keep the converted data up to date fell on the Bureau's IT division.
Map Maintenance Application
The IT staff considered various technologies, and after analysis selected MapObjects with Visual Basic (VB). The staff subsequently undertook additional training to acquire the skills necessary for successful development of the application.
The Map Maintenance application or module is the first of three mission-critical modules that will make up the Street Lighting Information System, a central data repository to support day-to-day business operations. The other two modules are Query and Display and Project Tracking.
The Query & Display module is similar in functionality to the Map Maintenance module, except it will be used by management, field, and engineering staff for the sole purpose of viewing the streetlighting data without modifying it.
The Project Tracking module will be used
by both management and engineering staff to track a project's status in
great detail. These modules will be developed upon successful implementation
of the Map Maintenance project.

Figure 3: Application Components
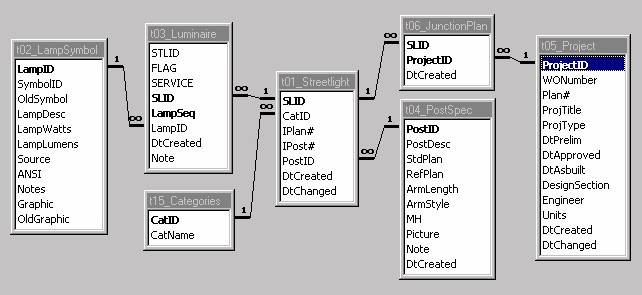
Figure 4: Database Design
This design also provides a robust data architecture
for retrieving and modifying streetlighting data as well as a strong foundation
for integrating with other organizational databases.
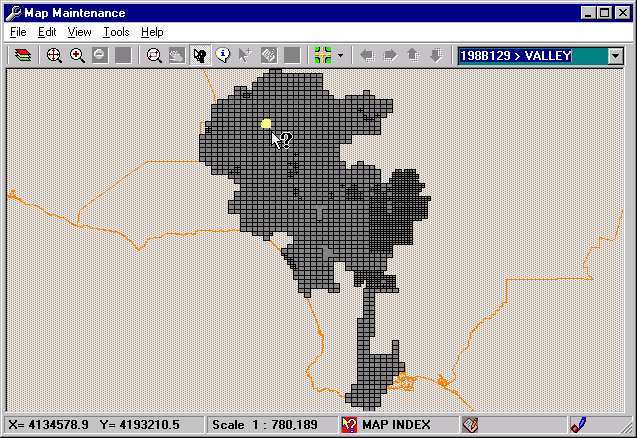
Additionally, buttons on the toolbar become enabled or disabled depending on the current map scale. This provides the user with visual cues that make the application more user-friendly. The scale-dependent state of the interface can be controlled with the following code, which is fired from Map Control events:
When the user "zooms in," the individual streetlights are displayed as red squares (Figure 6). Clicking on a given streetlight results in a pop-up of the Edit Streetlight form (see Figure 7) showing all the underlying data about that particular streetlight.
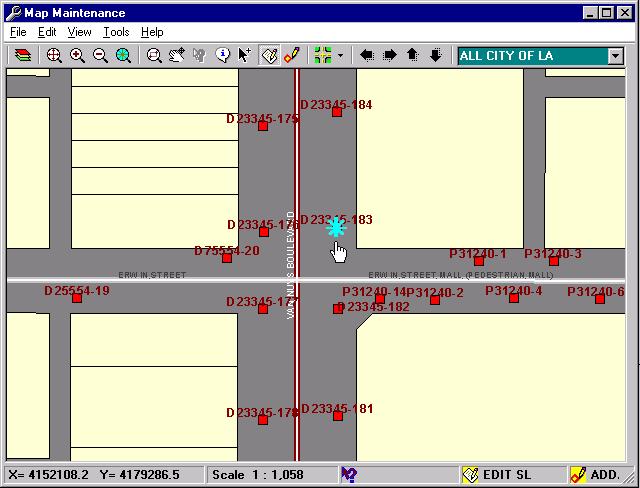
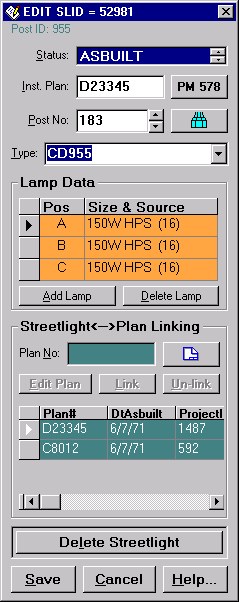
Figure 7: Edit Streetlight Form
DEVELOPMENT TIPS
When building a GIS (Geographic Information System) using MapObjects, consider the following tips, making sure to allow ample time to design the application before beginning to code. (If you don't take the time to think it through, you'll end up spending a lot of time down the road changing things around and re-coding your application.)
These tips are not inclusive, but can help new developers orient themselves and decide on an appropriate plan of action.
Tip 1-Map Layers
Decide how to present the data. What are the layers? What is the appropriate order and scale for the display of map features? (For example, Map Maintenance App displays street centerlines only at scales under 20,000 and streetlights at scales under 7,500.)
Tip 2-Toolbar
Design a toolbar with buttons that will provide access to most commonly used functions. Generally, these functions will fall into three categories: navigation tools, query tools, and edit tools. Enable or disable the buttons appropriately as the user zooms in and out of the map. (For example, the Add Streetlight button becomes enabled only at smaller scales to insure accurate positioning of new streetlights.)
Tip 3-Status Bar
Design a status bar with panels to display the current state of your application such as cursor coordinates, map scale, operations allowed (e.g., edit or add), etc. The more visual aids provided, the more user-friendly the application will be.
Tip 4-Data Access
Decide on data access methods (ADO, DAO, or both) and how the retrieved data will be presented to the user. One simple approach would be to use popup forms, similar to EDIT STREETLIGHT (Figure 7), in combination with OCX controls like Microsoft's MSHFlexGrid, ImageView, TreeList or third-party controls like Sheridan Data Widgets.
MapObjects Help states: "If using particularly large datasets (greater than 100,000 records) for searching, consideration should be given to storing data in SDE rather than Shapefiles." If this applies to your application, and you can not afford SDE because of prohibitive costs, consider breaking up the shapefile into smaller files to improve performance. Otherwise, use PlaceLocator and Geocoder objects to speed up searches.
Tip 6-Design a Centralized Error Handler
To save users from annoying and unrecoverable errors that can crash the application:
Public Sub ErrorHandler(Optional sSubName As String = " ")
'report the error to the user
MsgBox sSubName & " Error:" & Str$(Err.Number) & vbCr & _
Err.Description, vbCritical, _
"Reported by " & Err.Source, _
Err.HelpFile, Err.HelpContext
'write the error message into the external error log
LogError Err.Number, Err.Source & ">>" & _
sSubName, Err.Description
'reset the mouse pointer for a map control and VB forms
frmMain.Map1.MousePointer = moDefault
Screen.MousePointer = vbDefault
'test for any specific error numbers and respond
'with appropriate actions
'...
End SubFigure 8: Example of Error Handler
Tip 7-Implement Error Log
If the application is intended for multi-user access, adding an error log will help in monitoring and correcting errors when they come up. The sample code above calls the LogError sub to append an error into the error log file.
Tip 8-Deployment Issues
Just because your application is completed and running well, your mission is not accomplished until the application is successfully installed and tested on the machine other than the one you used during development. In fact, a lot can go wrong before the application even starts running on a client machine. Combinations of operating systems, networks, VB versions, ADO data providers, shared dynamic link library files and other software can create an environment in which the application may not properly execute. The following recommendations will help to minimize such problems:
Conclusion
The IT staff members of L.A. City's Bureau of Street Lighting who developed the Map Maintenance application are neither programming pros nor cyber gurus. Provided with some training, excellent tools and support from management, they have been able to create a specialized application that promises to save the City in employee hours and costly project overruns.
The primary intent of this paper is to encourage
other department or agency members, who may be considering the need for
similar applications, that they, too, can successfully develop an in-house
MapObjects application.
Resources
Magazines:
Access-Office-VB Advisor
McManus, Jeffrey P. Database Access with Visual Basic 6. SAMS, 1999.
Gunderloy, Mike. Visual Basic Developer's Guide to ADO. Sybex, 1999.
Training:
Rouben L. Isahakian, P.E.
Senior Systems Analyst I
Bureau of Street Lighting, City of Los Angeles
600 S. Spring Street, Suite 1400
Los Angeles, CA 90014
Phone: (213) 847-6520
Fax: (213) 847-5388
Email: risahak@bsl.lacity.org
Patrick Cross
Senior Systems Analyst I
Bureau of Street Lighting, City of Los Angeles
600 S. Spring Street, Suite 1400
Los Angeles, CA 90014
Phone: (213) 847-5400
Fax: (213) 847-5388
Email: pcross@bsl.lacity.org