Patti Akers, MA, Clint Garrison , Leslie Upledger Ray, MA, MPPA, and Patricia Murrin, RN, MPH
A Geographic Look at Severe Injury and Death in San Diego Due to Violence
This presentation will look at the correlation between location and severe injury and death due to violence in San Diego County. This will be a practical overview of integrating health data with GIS technology. Data will be abstracted from the San Diego County trauma registry and medical examiner's data. Maps will include rates of severe injury and death by San Diego County communities by mechanism of injury: gunshot, stabbing, unarmed, and other assault. This presentation will also include general demographic characteristics of the population. The purpose of this study is to identify high-risk areas and/or populations.
Nationwide, homicide accounts for 15% of all injury deaths. However it accounts for a much larger percentage among the young. Homicide accounts for about 25-30% of all injury deaths among infants, teens and young adults. Nationwide the homicide rate in 1995 was 8.6 per 100,000 population (Christoffel and Gallagher, 1999). San Diego's rate was lower than the national average. Using the State death files the homicide rate for San Diego was 7.94 per 100,000 population during 1995. This rate has dropped dramatically in the past few years and in 1998 the rate dropped to 3.61 per 100,000 population.
Seven years of data were abstracted from the San Diego County Trauma Registry and Medical Examiner's Database and analyzed to determine who was at highest risk of severe injury or death due to violence (fiscal years 91/92 - 97/98). Factors analyzed include type of violent activity and victim demographics. Annual rates were calculated per 100,000 population. Injuries include severe injuries only; victim must have been considered a trauma patient to be included. San Diego County Emergency Medical Services receives a Trauma Registry for every trauma patient admitted to any of the designated trauma center hospitals who meets one or more of the following criteria (MTOS Modified Major Trauma Outcome Study): length of hospitalization of three or more days, admission to intensive or intermediate care units, deaths due to traumatic injuries, and/or transfer to or from another acute care hospital.
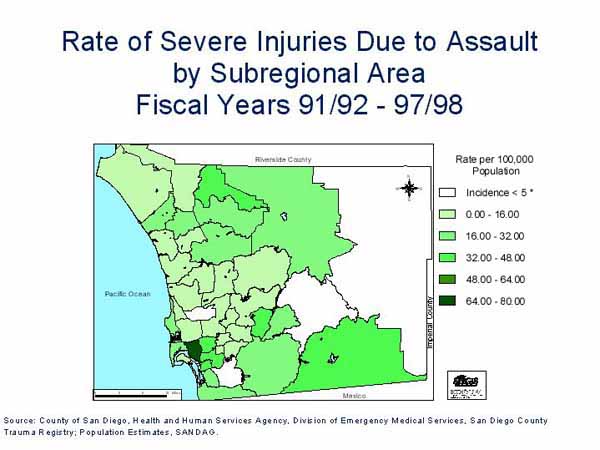
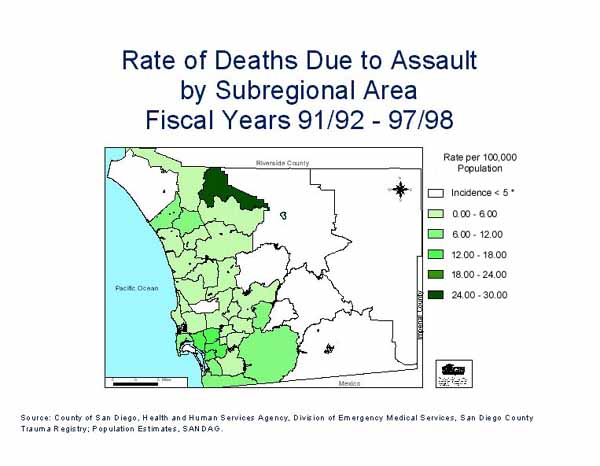
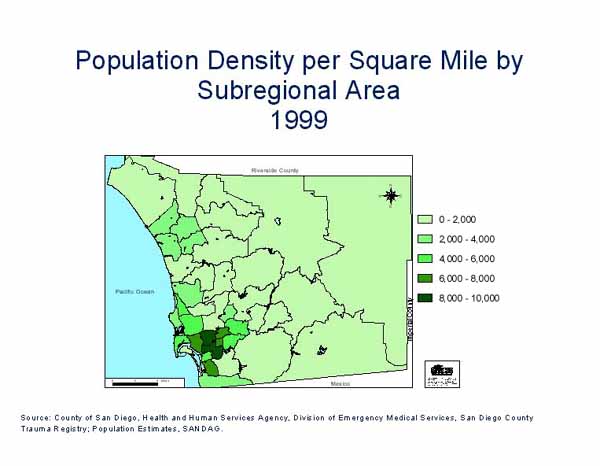
Maps were created for each of the injury types by severity (severe injury and deaths) by Subregional Area (SRA) to aid determining populations at risk. Population density maps were also created for comparison. The maps were created using ArcView 3.1. These choropleth maps showed rates of severe injury and death for each SRA, a .dbf file was created in which the rate for each area was assigned to the corresponding code. This database file was then incorporated into the ArcView program and linked by SRA to the shapefile (layer) for that SRA using the "join" command. Rates were grouped into categories representing equal value intervals, and the category for each area was plotted with a representative color scheme.
Violent injury was defined as assaults and homicide due to unarmed fights, cut/pierce wounds and firearm injuries. To calculate annualized rates, the population estimates for each of the seven years were added together to create the population. This population was then divided by the number of incidents and multiplied by 100,000 to get the rate per 100,000 per year. Rates were annualized for comparability.
Thirty percent of those severely injured or killed were between the ages of 24 and 34. Another 20% were between the ages of 20-24 and 18% were aged 35-44. During the past seven years, the age groups with the highest incidence of severe injury/death were 25-34 year olds, however those with the highest rate were 20-24 year olds (665.79/100,000 population). While Whites accounted for 63% of the population, only 33% of violence can be attributed to them, with a rate of 20.33. Hispanics (71.28) accounted for 42% of severe injuries and death due to violence, however Blacks had the highest rate (104.12/100,000 population).
Unarmed Assaults: During the last seven years overall violent deaths and injuries have declined. Unarmed injuries are the exception. Severe injuries due to unarmed assaults increased 97% while deaths due to unarmed assault decreased 23%. The Central Subregional Area (SRA) had the highest rate of severe injuries due to unarmed assault. Unarmed assault deaths were highest in the Central, Mid City and National City SRAs. These SRAs were the most densely populated and had the lowest median income in San Diego County (averaging only 66% of the County median income).
Cut/Pierce: Severe injuries and deaths declined 86% and 88% respectively during the past seven years. The Central SRA had the highest rates of both severe injury and death.
Firearm: Severe injuries and deaths due to firearms declined 52% and 64% respectively during the past seven years. The SRAs with the highest rates of firearm injuries were Central, National City and Pauma. It was important to note that while Pauma had the highest rate it also had a very low population. There were only seven deaths and seven severe injuries during the past years compared to 199 severe injuries and 93 deaths in the Central SRA. If this study included only data for the last four years Pauma would not have had a rate calculated for it due to its low incidence (rates are not calculated for incidence less than five due to instability).
The San Diego County Trauma Centers are:
Christoffel, T and Gallagher SS, Injury Prevention and Public Health: Practical Knowledge, Skills and Strategies. Gaithersburg, Maryland: Aspen Publishers, 1999.
Author Information
Patti Akers, Biostatistician, email Pakershe@co.san-diego.ca.us
County of San Diego, Health and Human Services Agency, Division of Emergency Medical Services, 6255 Mission Gorge Rd, San Diego, CA 92120, phone: 619.285.6429, fax: 619.285.6531