Chunguang Zhang, GIS Analyst Adv.(czhang5@hotmail.com)
Implementation of Quarter_quad Mapping System with Automated Registration and Rectification Process
ABSTRACT
GIS database at Georgia Department of Transportation(GDOT) is county-based library systems, which serve 159 counties with seven layers. This system is well established and maintained, and is a valuable source of data for all GIS applications. Recently the GIS Application Development Unit of GDOT began offering the county map series as geo-referenced map images available for use in any data viewing software application. These products have proven very useful and versatile in providing for the growing appetite for geographic information at GDOT and in the state. But there are some limitations when you start providing image data by county in a large state. The shapes of counties are irregular so the images cannot be edge-matched. This limits display of an analysis to one county at a time. The scale of the county maps precluded the use of city data, which also hindered the mapping that crossed those corporate limits. The decision was made to build a new map product to integrate the available county and city data using the DOQQ indexcode due to the highly usage of DOT Quads. The 3.75 minute series mapping module developed in GDOT will provide a powerful tool for basemap building which will prove more flexible and useful for GIS data users with better tools for environmental, transportation, planning, and land use analysis.
GIS Application Development Unit of GDOT is responsible for providing high-quality transportation map, traffic volume map, and many special projects for GDOT. The unit was only established several years, but many successful projects have been finished since its start. With the use of Arc/Info GIS software, the unit has finished all 159 county based digital map production. Currently, GIS Application Development Unit based on existing mapping data stored in library, has developed quarter_quadrangle digital map production using DOQQ index code. This paper discus s the implementation of this automated mapping system and the way of automated registration and rectification of images converted from these map products.
The origins of GDOT GIS unit capability began not as a GIS
project but as an outgrowth of using information technologies to
improve the operations of a variety of transportation processes.
One of the major efforts began several years ago was to convert
state, county and city base maps into digital form. The base maps
provided in GDOT are at scales of 1:600k of state, 1:63k of
county and 1:12k of city. The coverage (Geographic extent)
available are at the state, regional, county and city levels. The
database stored for 159 counties is an Arc/Info library with
seven feature layers. This system is well established and
maintained, and is a valuable source of data for all GIS
applications. While these productions have proven successful and
efficient use of county map for different district purpose, the
GIS unit was occurring another significant trend that began to
offer all county maps as converted geo-referenced image. This
provides a powerful tool when combined with all other county or
state data layers either as Arcview shape file or Arc/Info
coverage. Because the whole mapping system is managed and
maintained in Unix backbone server, people could not access these
data without Arc/Info software and Unix workstation. With the
increasing awareness of GIS as potential tool, GDOT has launched
a training class for Arcview users. These arcview users have no
much knowledge about Arc/Info could easily learn arcview and
obtain geo-referenced image as base map for many event-driven
projects using primary GIS dynamic segmentation function. The
unit has put all GIS data layers and image data in NT network
system. The users throughout the GDOT with wide spread interest
could access these data with little effort or knowledge of the
GIS software have developed many successful projects. The GIS
users are able to make best use of these geo-referenced images.
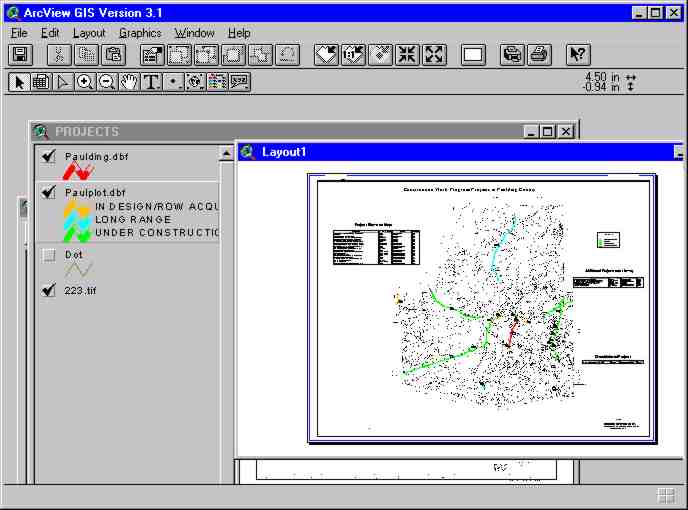
Fig 1.
(Fig 1. Example of using geo-referenced images for event-driven project)
However the current county mapping system has limitations when we try to merge different county images, because county shapes are irregular, the images can not be edge-matched. This limits the display of one county at a time, which hindered mapping that crossed those corporate limits. Another limitation is the scale of the county map that is 1:63k, this preclude the use of city attributes like roads number and road names etc. The decision was made to make another map production which will integrated county and city features and published it in a rectangular format so that any spatial extent could be displayed. Since Digital orthophoto Quarter Quadrangles have been used as mapping reference for transportation planning, environmental and land use of many projects, their boundaries were chosen as the map extent of the new map products. Many public and private organizations have benefited from the state's investment in Digital Orthophoto Quarter Quadrangles. This imagery, developed through a joint funding agreement between Geological Survey, provides low-cost, high-resolution imagery of the entire state. The appropriateness of this invaluable DOQQ map scale will also allow us to display city features. They will be a very useful reference both in the field and desktop mapping application.
The module of Quarter Quadrangle mapping system was built in Arc/Info Arcplot. Two major problems we have to deal with are 1). Find out the mapextent for each Quarter quadrangle map 2). Find out which county falls into which quarter quadrangle map. When these two files are built an associated INFO file could be built and then a cursor in AML will be used to search each request quarter quadrangle map and plot it. The mapextent file was built from DOQQ index coverage. An AML cursor was used to select each index polygon and write to info file the lower left corner and upper right corner coordinates. AML script:
/***********************************************************************
/* The Georgia Department of Transportation State Map Project
/***********************************************************************
/* File name: indexcode_lam.aml
/*
/* Created (By, Date):Chunguang Zhang 02/02/97
/* Updated
/*
/* Program Description: build a info file to store quarter_quad mapextent
/*
/***********************************************************************
/* ARGUMENTS:
/* ARGUMENT: record =
/* ARGUMENT: lxcoordinate = [extract 1 [show node 4 coordinate]]
/* ARGUMENT: lycoordinate = [extract 2 [show node 4 coordinate]]
/* ARGUMENT: hxcoordinate = [extract 1 [show node 2 coordinate]]
/* ARGUMENT: hycoordinate = [extract 2 [show node 2 coordinate]]
/* ARGUMENT: indexcode = [show polygon %record% item indexcode]
/***********************************************************************
ae
&set record = 3299
&do &until %record% eq 3920
EC indexcodelam
ef polygon
&set record = %record% + 1
select $recno = %record%
&set indexcode = [show polygon %record% item indexcode]
put /usr/pd/dtpdcgz/dem/poly1
ec poly1
ef node
select $recno = 4
&set lxcoordinate = [extract 1 [show node 4 coordinate]]
&set lycoordinate = [extract 2 [show node 4 coordinate]]
select $recno = 2
&set hxcoordinate = [extract 1 [show node 2 coordinate]]
&set hycoordinate = [extract 2 [show node 2 coordinate]]
&data arc
INFO /local/quarterplot/info
ARC
SELECT INDEXCODELAM.INFO
ADD
%indexcode%
%lxcoordinate%
%lycoordinate%
%hxcoordinate%
%hycoordinate%
[unquote '']
Q STOP
kill poly1 all
q
&END
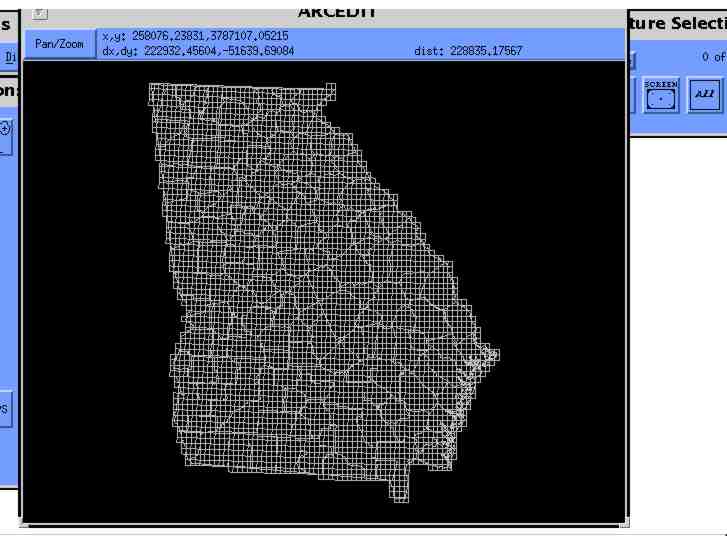
(Fig.2 County Indexcode Coverage)
Each quarter quadrangle has one or more counties covered. In order to find out these county fips, the DOQQ index coverage is overlay with the state county boundary coverage and output an ascii file contain indexcode and fips information. Fig2. Then a visual basic program was coded to produce an access file with each quarter quadrangle indexcode associated with fips code of different counties. This file was then loaded to Arc/Info Info table and then joined with mapextent file to be used for plotting. Fig.3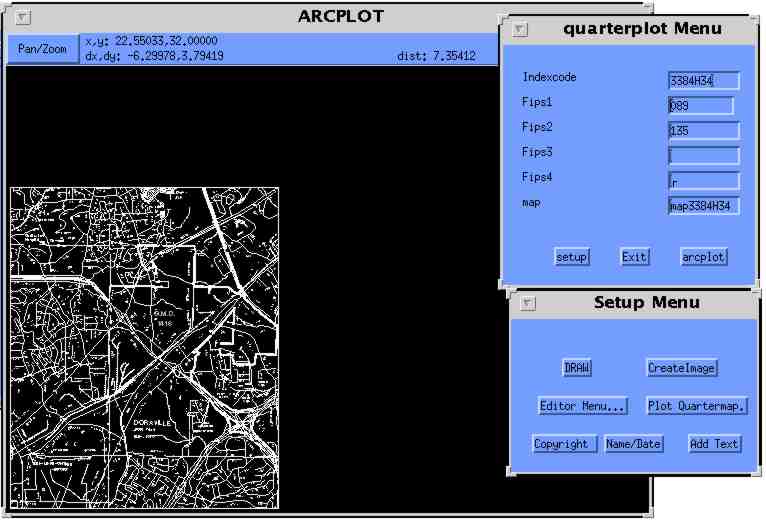
(Fig.3 Quarter_quad Plotting Menu)
As the final product will be converted to tif image to be displayed on the background for arcview users in GDOT, each quarter_quad map com position need to be converted to the georeferenced tif image. It will be time consuming job to register and rectify for almost 4000 quarter_quad image if we just manually do it without finding an automatic way. Currently there is no software to automatically do the registration and rectification. The image can be easily converted by ARCPRESS. But how to register and rectify without selecting matched points from maps and images. The basic task to solve this problem is to write a world file(.tfw) for each quarter_quad. How the georeferencing information is accessed
The image-to-world transformation is accessed each time an image is displayed (e.g., when you pan or zoom). The transformation is calculated from one of the following sources, listed in order of priority: · the world file · the header file (if the image type supports one) · from the row/column information of the image (an identity transformation) (Esri arcview help file).
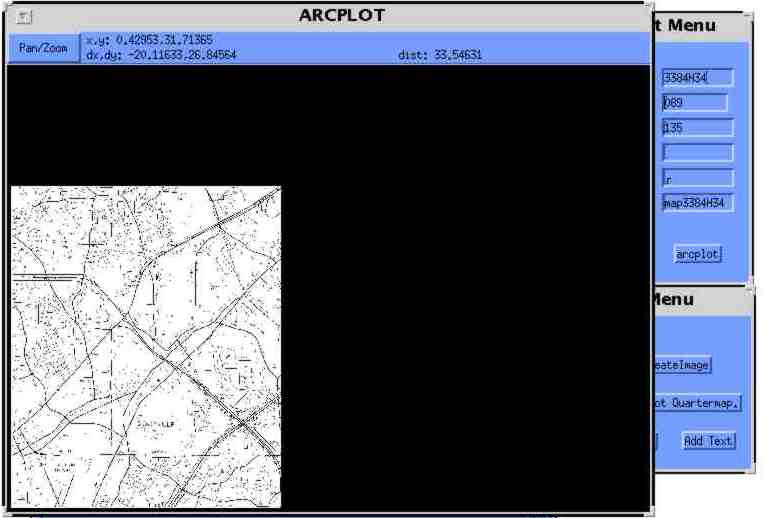
(Fig4. Registered and Rectified Quarter_quad Image)
This paper describes the steps to implement the quarter_quad mapping system and most importantly to find a way to automatically register and rectify the image. The method is proven successful and could also be used in other similar mapping system. The system is useful especially for producing large-scale map or converting images from map production for Arcview users to make actual event-driven projects.