Robert Lemon and Xudong Jia
California State Polytechnic University, Pomona
ABSTRACT
Yorba Linda Water District currently is preparing a full-scale
GIS implementation plan for customer service, facility management, work
order processing, capital facilities planning, and engineering analyses.
The most challenging issue within the District was to explore the benefits,
usefulness, and limitations of GIS technology as an enterprise solution
to departmental decision making prior to major GIS investment. This is
a common challenge among small, specialized government agencies that tend
to regard GIS as a technological solution that is only suited for large,
multi-departmental organizations, such as city and state agencies. A study
has been completed that developed a small-scale, business-oriented ArcView
GIS application system for water consumption analysis, water conservation,
routine maintenance tracking, meter replacement and system shutdown analysis
utilizing actual district data. Zeroing in through this low-cost, in-house
prototyping system demonstrates a new approach of needs assessment for
small and medium-size water/wastewater service agencies with "ground zero"
GIS knowledge.
INTRODUCTION
Geographic Information Systems (GIS) technology allows users to combine the functionality of mapping software with the power of a relational database. It deals with any data that has a geographical component. As such, GIS provides a vital information management solution for water/wastewater service agencies that focus on the planning, construction, operation and maintenance of various location-oriented facilities.
After several decades of growth, GIS provides new opportunities for agencies to analyze their data in ways not previously possible. However, it has not yet reached the status of being a household acronym, although the ever-increasing use of Global Positioning System (GPS) technology in consumer products is working to familiarize lay people with GIS. Against this backdrop, it is understandable that smaller agencies specializing in a specific area of service may still tend to regard GIS as esoteric and better suited to large organizations with multi-disciplinary services. It is rationalized that large organizations, such as city and state agencies, can more easily justify the often significant expense necessary for the implementation of GIS technology because they offer a large variety of services and have the ability to distribute costs amongst various departmental budgets.
This fundamental misgiving is exacerbated by the fact that the critical first step of employing a GIS consulting firm to complete a GIS Needs Assessment and Implementation Plan is in itself a substantial financial undertaking, often costing from $25,000 to $75,000. This type of GIS need assessment typically focuses on technical and integration issues, in addition to providing an analysis of potential benefits that could be reaped by implementing GIS within a specific organization. If an implementation plan is done correctly, it provides an invaluable road map for an agency committed to implementing GIS in the most efficacious manner possible. A properly completed report is well worth the initial investment, as it will serve as the building block upon which the agency's GIS system will be built. However, it is often a challenge to gain support and funding for such an effort because its end product is somewhat intangible, being primarily comprised of ideas rather than a functioning product.
This challenge can be successfully overcome by developing
a low-cost, in-house pilot study that quickly identifies various potential
uses of GIS technology, examines data issues and technical requirements
related to the large-scale GIS investment and builds up confidence in GIS
implementation within the agency. This prototyping system can serve as
a catalyst in obtaining support from an agency's upper management and governing
political body, which may in turn result in a willingness to commit significant
funds to further GIS exploration and implementation. The Yorba Linda Water
District experience demonstrates the application of this approach to dealing
with this formidable challenge.
THE YORBA LINDA WATER DISTRICT EXPERIENCE
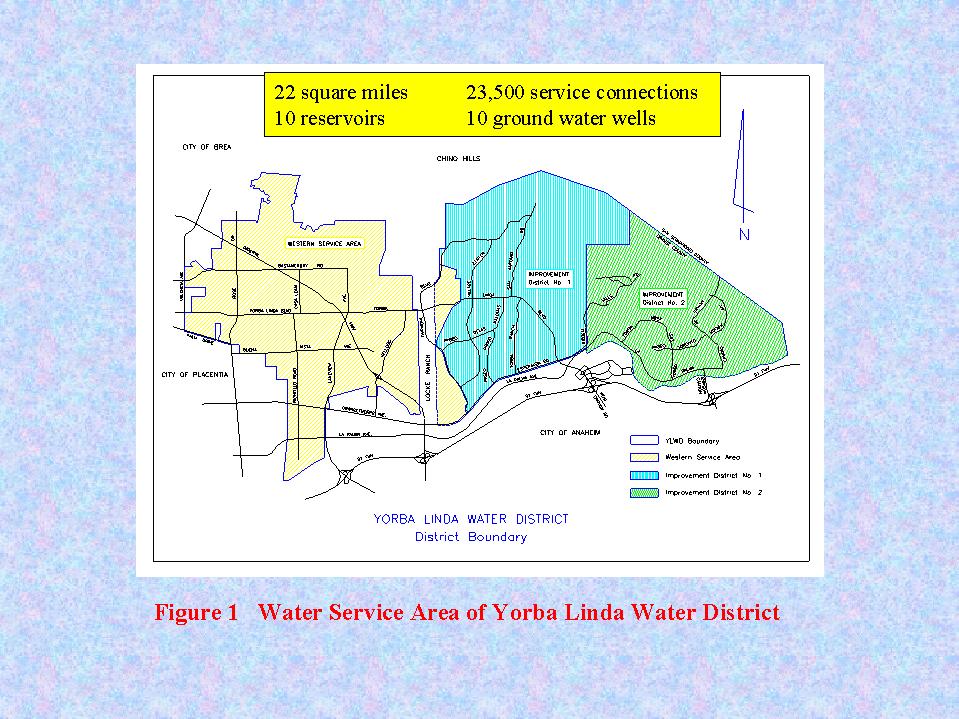
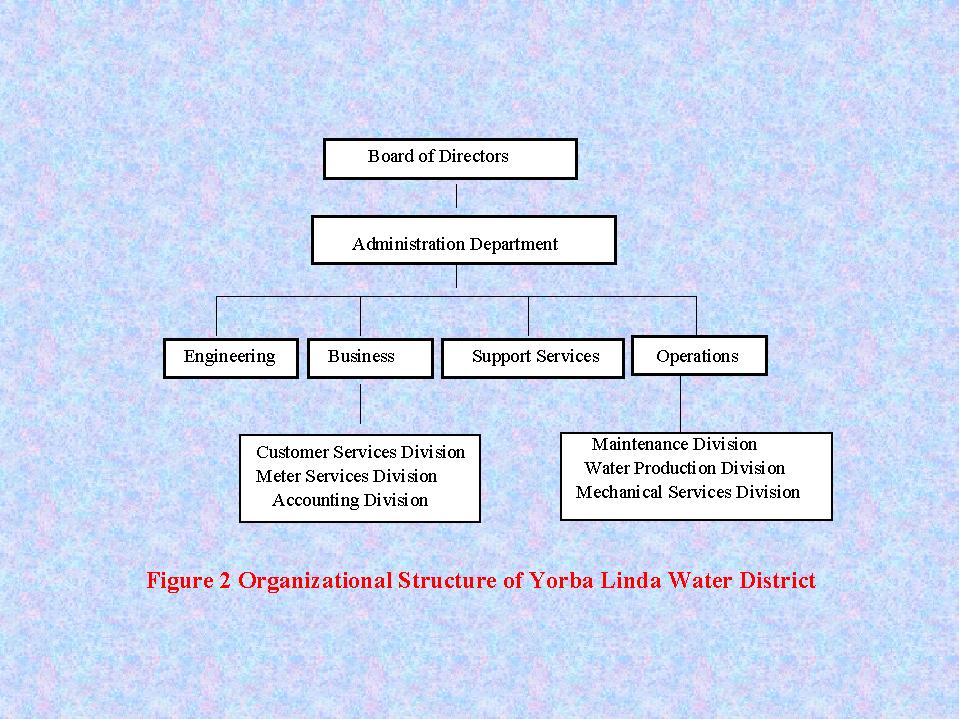
The Yorba Linda Water District (YLWD) is an independent special district that provides water and sewer services to the City of Yorba Linda and portions of Placentia, Anaheim, Brea and unincorporated Orange County, California. The District's Water Service Area (see Fig. 1 ) covers 22 square miles and includes approximately 23,500 service connections, ten reservoirs and ten ground water wells. The District's Sewer Service Area includes approximately 12,400 service connections and 138 miles of sewer mains. YLWD's organizational structure consists of five major departments and includes a staff of 53 employees(see Fig. 2)
Throughout its history, the District has stressed the importance of a customer-focused business approach and has embraced new technology to improve business efficiency and effectiveness. In keeping with this philosophy, the District's Board of Directors approved a $300,000 line item for a GIS implementation project in the District's 1997-1999 Fiscal Budget and reaffirmed their support for GIS implementation with the approval of a $500,000 line item in the District's 1999-2001 Fiscal Budget. Although the District is committed to employing new technology within its organization, it prudently requires that sufficient evidence be provided as to the benefits the technology can offer before authorizing significant expenditures. Additionally, it requires that the implementation of new technology follow a planned approach that maximizes the opportunity for utilizing the technology as an enterprise solution.
Although there are a plethora of examples demonstrating "what GIS can do", the lack of an example that profiled "what GIS can do for the Yorba Linda Water District" created a well founded hesitancy to authorize the funding of GIS implementation. This being the case, as of late 1999, none of the monies first approved in 1997 for a GIS implementation project had been authorized for release and the District was at ground zero status relative to its GIS implementation. In late 1999, the District's employee-based Technology, Innovation and Productivity (TIP) Committee was convened to focus on the exploration of GIS technology. The TIP Committee was tasked with soliciting and reviewing proposals from three separate consultants to prepare a Needs Assessment and GIS Implementation Plan. At that time, the Committee was responsible for providing a recommendation as to whether a full-scale implementation plan should be undertaken. However, authorization had only been received to begin a no-cost exploration process, as commitment by upper management to hire GIS consultants to develop an implementation plan had not yet been established.
As the Committee's exploration process continued, in which Committee members were educated on the benefits and capabilities of GIS, a simultaneous effort to produce an in-house preliminary pilot study was undertaken. A GIS application system was created in conjunction with the project requirements of a course being taken by one of the Committee members (Lemon, 1999). The course "GIS Applications in Civil Engineering", was offered through the Civil Engineering Department of Cal Poly Pomona. This course stressed an application approach to the establishment of a GIS database and required a GIS project to be developed by each student (Jia, 2000).
The GIS application system was created using ArcView 3.1, MS Word, MS Excel, and the District's current PICK D3 customer service database. The specific objectives for developing the system included:
The project was presented to the Committee for the purpose
of increasing each member's familiarity with GIS functionality and stimulating
discussion regarding application ideas. The presentation was subsequently
presented to the General Manager of the District and then, pursuant to
the General Manager's request, to a subcommittee of the District's Board
of Directors. Upon the completion of these presentations, and the accompanying
favorable responses, the recommendation to fund a full-scale GIS Implementation
Plan was forwarded to the General Manager and Board of Directors and received
their full support. In this manner, the preliminary pilot study was able
to meet its initial objectives while providing the invaluable auxiliary
benefit of serving as a catalyst in obtaining support and receiving authorization
for significant GIS related expenditures. In addition, the pilot study
raised the level of GIS awareness within the organization and developed
a sense of enthusiasm and momentum for GIS implementation.
NEEDS ASSESSMENT
The first step in developing the pilot study was to perform a cursory needs assessment. A needs assessment is critical to the successful implementation of GIS within an organization. The deliverables from a successful needs assessment typically include a GIS implementation plan that outlines GIS applications, data flow, common spatial identifiers and cost/benefit analysis results. The primary areas of focus in a GIS implementation plan include the following:
The application-oriented needs assessment investigates business activities in an organization to identify various ways to improve performance and efficiency using GIS technology. It identifies workflow processes and data flows in order to determine interdepartmental dependencies related to data. By conducting a systematic look at how departments function and the spatial data needed to do their work, the study is able to develop an implementation plan that centralizes data and leverages the functionality of GIS to make data more accessible and easier to analyze. This results in the elimination of data redundancies, and the associated inaccuracies inherent in the practice of having multiple revisions of the same data, and creates an environment in which quicker and better decisions can be made.
The Yorba Linda Water District used a hybridized version
of the application-oriented needs assessment in which great familiarity
with the agency's tasks, goals and culture was leveraged to create a preliminary
pilot study. In contrast to most needs assessments that focus heavily upon
existing data inventories, technical issues and integration problems, the
explicit aim of the pilot study was to showcase the use of GIS in the accomplishment
of simple everyday tasks. The applications developed were specifically
chosen not for their technical complexity, but for the ability to communicate
most effectively how GIS can make a specific individual's job easier, thereby
resulting in an ability to perform their job more efficiently.
PRELIMINARY GIS PILOT STUDY
The applications that could be developed were largely a function of the available data and the ease with which this data could be converted into a usable format. This being the case, the issues of data resources and data preparation and conversion are discussed in the following section.
Data Resources
The District was at ground zero status in terms of GIS technology. As such, no GIS data, such as existing ArcView shapefiles or ArcInfo coverages, was readily available. Therefore, it was necessary to construct a GIS database that utilized data currently stored in various formats. The three primary resources available were the following:
A District-wide, digital map containing all parcels, water facilities and sewer facilities within the District's boundaries does not exist. Some progress has been made in the creation of an AutoCAD drawing that includes street centerlines and lot lines for parcels within the District. However, the drawing had several inherent limitations. Specifically it contained a user-defined coordinate system, rather than the State Plane Coordinate System, and had all polygon features that were constructed of individual line segments. Additionally, it was only partially complete, covering approximately 30% of the District's entire service area.
The Engineering Department's hard-copy atlas sheets and as-built construction drawings are the main sources of location information for the District's facilities. The atlas sheets serve as the primary references for both the Engineering staff and Operations field personnel. The as-built drawings are marked-up copies of engineering design drawings that reflect field changes approved during the process of construction. Due to the hard-copy format of these sources, their inclusion in a GIS system would be predicated upon a substantial investment in data conversion. For the purposes of the pilot study, these materials were referenced to obtain additional attribute information for inclusion in feature attribute tables.
Data Preparation and Conversion
There were two distinct categories of data prepared for the pilot study. The first category was feature data created from the partially completed AutoCAD drawing and hard-copy maps. The second category was attribute data obtained from the customer service database and annotations on the hard-copy maps. Together, these two data components acted as the foundation of the GIS database used in the project.
1) Feature Data
The AutoCAD drawing was first modified within the AutoCAD environment to create polygon elements out of the line elements used to delineate parcel boundaries. Information from the hard-copy atlas maps and as-built construction drawings was then used to create new graphical elements within the AutoCAD environment. Line features representing water mains and service lines were added. New polygon features were also added to represent fire hydrants, valves, blow-off valves and water meters. Text was added to identify addresses, as this would facilitate the linking of attribute tables to features. As these elements were created, they were segregated amongst eight distinct AutoCAD drawing layers. The result was a complete and organized AutoCAD drawing that was ready to be imported into ArcView.
ArcView's CAD Reader extension was used to convert the AutoCAD drawing into an ArcView shapefile. The resulting shapefile consisted of a theme with three groups of features: polygons, lines, and annotation. Within ArcView, these features were further extracted to create eight desired themes for use in various applications discussed later.
2) Attribute Data
The PICK D3 customer service database was the essential element used to create an attribute table (CUSTOM_SERVICE) that was linked to the parcels. Relevant fields within the attribute table were retained and additional fields, whose data was obtained from the hard-copy maps, were incorporated into the table. Three additional attribute tables (FIRE_HYDRANT, BLOWOFF_VALVE and VALVE) were also created for associated feature sets. The information for these tables primarily came from the hard-copy maps.
Once the above four tables had been imported into ArcView, it was necessary to link them to feature sets. The earlier conversion of the AutoCAD drawing to an ArcView shapefile had created a feature attribute table for the geographic features. The information contained within the table was limited to items commonly found in an AutoCAD environment, such as layer, color and line weight. In order to link the attribute tables (CUSTOM_SERVICE, FIRE_HYDRANT, BLOWOFF_VALVE and VALVE) to the feature attribute table, a unique spatial identifier was created for each element within each table and the pairing of a feature and its corresponding record were completed one at a time.
Data related to service lines and water meters was already
contained within the parcel attribute table. As each service line and water
meter is associated with a specific parcel, it was determined that this
information should be retained within the parcel attribute table rather
than creating separate tables. This would allow the results of queries
based upon meter or service line information to be displayed through the
highlighting of associated parcels. As highlighted parcels are much more
visible in a view than highlighted service lines or water meters would
be, this appeared to be the best course of action. Additionally, an attribute
table was not constructed for the water main data set. However, the geographic
elements of both the water main and service line data sets would be used
for spatial analysis operations.
Application Development
It is readily apparent that the potential benefits of any technology are greatly enhanced when that technology can be used as an enterprise solution. To determine if GIS could serve as an enterprise solution, six different District divisions and departments were investigated to see how they might benefit from the use of GIS. The departments and divisions focused upon within the pilot study included the following:
Table 1 Summary of GIS Applications Involved in the Pilot Study
|
|
|
|
| Consumption Analysis | Display usage distribution of neighborhood | Customer Service |
| Customer Usage Information | Display usage relative to surrounding parcels | Customer Service |
| Parcel Query | Display information for selected parcel | Customer Service |
| Revenue Projections | Calculate statistics relative to total consumption | Accounting |
| Benefit Split Percentages | Calculate statistics split by geographic area | Accounting |
| Water Conservation Program | Display usage distribution normalized by area | Public Information |
| Blow-Off Value Flushing Program | Trace and display maintenance activities | Operations |
| Fire Hydrant Maintenance Program | Trace and display maintenance activities | Operations |
| Valve Excercising Program | Trace and display maintenance activities | Operations |
| Valve Maintenance Program | Trace and display maintenance activities | Operations |
| Facility Replacement Program | Display facility distribution by age/model | Operations |
| Facility Query | Display information for selected facility | Operations |
| Identification of Meter Misreads | Display meter readings relative to average usage | Meter Services |
| Meter Replacement Program | Display meter distribution by age/model | Meter Services |
| Meter Inventory | Calculate statistics relative to total meters | Meter Services |
| Facilities Inventory | Calculate statistics relative to total facilities | Engineering |
| Shutdown Analysis | Display parcels impacted by main shutdown | Engineering |
Application #1 Consumption Analysis/Customer Usage/Water Conservation Program
The Customer Service Division is the "front line" of the District and typically receives a large volume of customer inquiries. Many of these calls center upon a customer's assertion that they have been incorrectly billed for water usage. This conclusion is typically arrived at after they have compared their bill amount with that of one of their neighbors. Finding that their bill amount is significantly higher, they conclude that there must be something wrong.
In response to these inquires, the Division often provides the customer with a spreadsheet that details the history of the account. However, there is no readily available resource to compare a customer's usage with those of surrounding properties without comparing individual accounts one at a time. It is also explained to the customer that usage can vary widely with the lot size, amount of landscape and size of household that a customer may have. However, it is often difficult to convince a customer that, although their bill is larger than that of the neighbor they consulted, it is within the normal range for water usage.
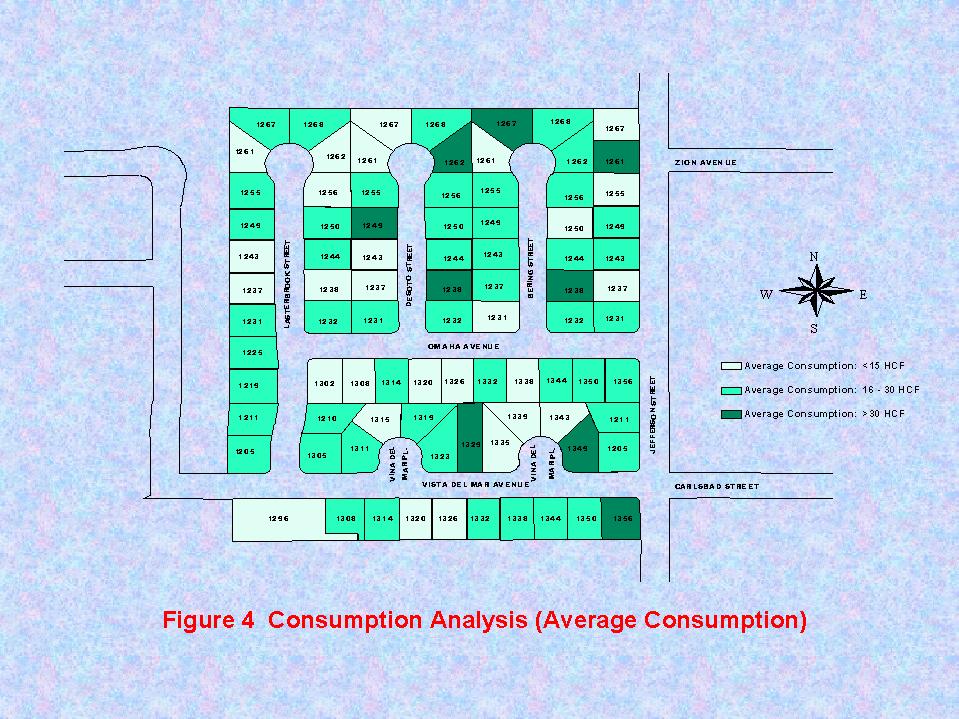
GIS provides an effective tool for performing a comparative consumption analysis, the results of which can be used both internally and as a response to customer inquires. This analysis can be based upon either current consumption or the average consumption over the history of the account. Additionally, a specific parcel can be selected and the consumption values of all surrounding parcels can be shown in relation to the usage of the selected parcel. The first two scenarios would provide a thematic map that would illustrate the distribution of high and low consumption values within a given neighborhood (see Fig. 4). The thematic map for the third scenario would show the consumption of all surrounding parcels as a percentage of the consumption value for the selected lot. The ability to provide this type of "snapshot" of the local neighborhood usage patterns to a customer can be invaluable in helping a customer to fully understand where his or her consumption value fits in a larger scale view.
These same thematic maps detailing water usage could be
utilized by the Public Information Division to determine the impact that
the District's educational water conservation efforts are having on the
usage habits of its customers. A thematic map that compares current usage
with the previous year's usage would be an excellent tool to gauge the
effectiveness of the District's Water Conservation Program. However, a
more creative use of GIS is to determine prime candidates for a Public
Outreach Program that targets customers with above average consumption.
To complete this task, the simple use of the individual, average consumption
values highlighted in the previous thematic maps would not be the best
approach, as water varies greatly with lot size. However, GIS can calculate
the area of each parcel, as it can do for any polygon feature, and then
take the parcel's average consumption and divide it by the calculated area.
A thematic map can then be created that displays the results and easily
identifies parcels that are using a disproportionately large amount of
water in consideration of their lot size (see
Fig. 5). In this manner, a limited budget for the public outreach
efforts of the water conservation program can be focused in areas where
it has the greatest potential for achieving significant impacts.
Application #2 Identification of Meter Misreads/Meter Replacement Program
The Meter Services Division reviews meter readings that are listed in a spreadsheet after data recorders are downloaded. Currently, data reading software is used to automatically flag any values in excess of 400% of the historical average consumption for a specific parcel. Identification of values that are below this threshold, but still significantly in excess of average values, involves either a laborious effort of reviewing all 23,500 meter readings or a hit-and-miss spot check approach. These high consumption values are typically indicative of a malfunctioning meter or a simple misread of the meter. In either case, they require field investigation.
GIS has the ability to readily provide for the identification of "misreads" and malfunctioning meters. This is accomplished by performing an analysis that divides the current consumption by the reading taken for the same meter during the same month the previous year. The result can be displayed as a percentage and a thematic map can be created that identifies large consumption differentials (see Fig. 6). Once a suspicious value is flagged, a parcel querycan be performed to obtain detailed information on the service account.
The Meter Services Division is also responsible for replacing
old and malfunctioning meters. At this time, replacement is completed as
a reactive response to the identification of a malfunctioning or old meter.
However, GIS could be utilized to establish a meter replacement program
to systematically replace meters that may be prone to "reading slow". As
the age of a meter increases, and its mechanical parts start to wear, its
ability to register low flow volumes decreases. This results in an inaccurate
consumption value which is lower than the actual amount of water consumed.
This in turn affects District revenues, as payment is not collected for
the water that does not register on the meter. The use of GIS to create
a thematic map displaying the distribution of water meters based on age
would be invaluable in developing an organized approach to combat this
problem (see Fig. 7).
Application #3 Shutdown Analysis
The Engineering Department supervises the construction of capital improvement and replacement projects. These projects often require "mainline shutdowns" when it is necessary to tie-in a newly constructed section of water main to an existing section of main. A shutdown involves isolating a section of pipe and then proceeding to drain it, thereby disrupting service to all parcels connected to that specific pipe section. Once the pipe is drained and no longer pressurized, a section of the existing water main can be removed and a new mainline connection constructed.
Prior to any fieldwork, the Engineering Department must perform a shutdown analysis. The shutdown analysis requires related maps and drawings to be manually reviewed in order to determine which valves must be closed to isolate the necessary section of the main. The maps are then analyzed to determine which parcels and fire hydrants will be out of service. A list of affected customers is drafted and notification letters advising of the temporary disruption in service are prepared for distribution. Additionally, the Fire Authority is notified of specific fire hydrants that will be temporarily out of service. As the atlas sheets are drawn at a large scale, multiple sheets are required for a single shutdown. Furthermore, as the service line locations are not graphically represented on the atlas sheets, but rather referenced through annotations, the shutdown analysis becomes a time consuming and laborious process.
GIS provides a set of spatial analysis functions that can be used to automatically determine all affected parcels and facilities (see Fig. 8). The analysis is performed by determining the sequential intersection of three separate themes (water mains, service lines and parcels) for the area of interest. The resultant parcel attribute table, containing customer name and address information, can then be exported to a word processing program to perform a mail merge for the standard notification letters.
This approach works very well for a situation that does
not involve terminus mains branching off from a selected main. As ArcView
does not have tracing capabilities, it is unable to detect if the branched
terminus mains and associated service lines are also affected after a selected
main is shut off. This demonstrates one of the limitations of the ArcView
software.
CONCLUSIONS
This paper presents a low-cost, in-house solution to dealing with the challenge of garnering support for the initial stages of GIS implementation within an organization that is at ground zero GIS status. The solution involves having an in-house employee create a prototype system specifically tailored for an individual organization. The pilot study was undertaken by utilizing Esri'S user-friendly ArcView software. The most important asset utilized in the pilot study development process is the employee's intimate understanding of the organization's activities, challenges, goals and corporate culture. By leveraging this knowledge in the selection of applications to be showcased, a demonstration can be provided that is, although admittedly far less sophisticated than conventional needs assessments, very powerful in its ability to communicate in a manner that resonates with its intended audience. It was this ability to observe GIS functionality with the use of the District's own data that allowed the pilot study to play a pivotal role in gaining support and enthusiasm for GIS implementation.
The in-house pilot study development process affords the
additional advantages of familiarizing oneself with the capabilities and
limitations of GIS, as well as serving as a catalyst for application ideas.
This allows an organization's employees to take a more active role in the
needs assessment process. Although GIS consultants are critical to the
design and implementation of a GIS, it is the end users that can provide
the most valuable insights relative to applications that are prime candidates
for GIS. The inclusion of the end user's knowledge of the business functions
and workflow processes within an organization are critical to the success
of a GIS implementation project. If this business-related knowledge is
supplemented with an understanding of GIS functionality and capabilities,
an organization is poised to maximize the benefits that can be received
from GIS implementation.
ACKNOWLEDGMENTS
The authors are grateful to William J. Robertson and Kenneth
R. Vecchiarelli of the Yorba Linda Water District and Edward C. Hohmann
of California State Polytechnic University, Pomona for their contributions
and support of the preparation of this paper and its presentation at the
Twentieth Annual Esri International User Conference.
REFERENCES
1. Xudong Jia and Cheryl L. Hickman
(2000). Incorporating Student Working Experiences Into GIS Education, at
the
Twentieth Annual
Esri International User Conference, June 26 - 30, 2000, San Diego, California.
2. Robert Lemon (1999). Preliminary
GIS Pilot Study for Yorba Linda Water District. Department of Civil Engineering,
California State
Polytechnic University, Pomona
AUTHOR INFORMATION
Robert Lemon
Project Manager
Yorba Linda Water District
4622 Plumosa Drive
Yorba Linda, CA 92886
Phone: 714-777-3748 Fax: 714-777-8304
E-mail: rlemon@95net.com
Xudong Jia, Ph.D.
Assistant Professor
Department of Civil Engineering
California State Polytechnic University, Pomona
Pomona, CA 91768
Phone: 909-869-4312 Fax: 909-869-4342
E-mail: xjia@csupomona.edu