Ian Overton
A new integrated stormwater data set for asset management and flow modelling has been generated for a portion of the City of Adelaide in South Australia. This is the first example of cross-area government stormwater infrastructure mapping in Australia. The stormwater dataset includes all pipes and junction features for 10 local government areas within the Patawalonga River Catchment portion of Adelaide. With it the State and Local Governments are able to model stormwater events to alert emergency services, predict areas of flooding, trace where pollution spills will flow through the system or identify potential sources of pollution. The dataset is also a valuable addition to the asset management system used by council engineering departments.
Stormwater networks in Australia manage the run-off water from rainfall and spillage within urban areas. The network consists of drains and pipes that transport water collected from inlets in the paths and road gutters and transport it to wetlands and ultimately out to sea. This is separate from the sewage network that has its own pipeline system. The Stormwater network has been growing since the establishment of the city over one hundred years ago and the increase in population places ever-increasing demands on it. Local Government Authorities (LGAs), also referred to as local councils or local government, are responsible for the establishment and maintenance of the stormwater system whose major use is to mitigate flooding caused by large rainfall events.
The need for LGAs to maintain and record their assets has seen the introduction of a number of disparate systems for the storing and querying of spatial asset data. However, as the responsibility of these systems lies with individual local councils the data is captured and stored locally with no guarantee of consistency between neighbouring councils. The systems for storing this information included numerous digital formats for GIS and other asset management packages, hardcopy maps in various scales, textual databases and the memories of council engineers.
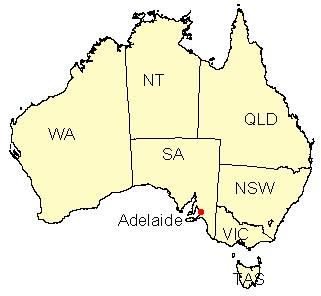
The Environmental Protection Agency (EPA) commissioned BC Tonkin and Associates Pty Ltd, The City of West Torrens and Mapping and Beyond to undertake a project to collect and integrate the stormwater network for the Patawalonga catchment in Adelaide, South Australia. The catchment covers approximately 23,400 hectares within the Adelaide urban area. The natural catchment boundary encompasses all or part of ten council areas including Adelaide, Charles Sturt, Marion, West Torrens, Burnside, Unley, Mitcham, Adelaide Hills, Onkaparinga and Holdfast Bay LGAs. This project has produced the first example in Australia of a digital network of stormwater pipes that crosses council boundaries. The aim of the project was to facilitate the management of stormwater and flood events in the catchment and provide emergency services the ability to track and respond to pollutants in the system. A GIS was used to collect, store and analyse the information on the stormwater network. The exercise also formed part of a pilot project to investigate the use of GIS as a tool to integrate stormwater data and provide an analysis package to meet the needs of the various stakeholders.
Figure 1. Project site location in Adelaide, South Australia
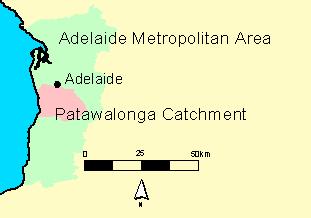
Figure 2. Map of Adelaide showing the area enclosed in the Patawalonga Catchment
A GIS was identified as the best way to manage the stormwater infrastructure and to help them to comply with the AAS27 requirement (A quality standard for the financial valuation and reporting of assets) for asset valuation and reporting. The original data was collected by various means including GPS, aerial photography, heads-up digitising, and CAD. This data contained a vast list of attributes many of which were not required for the project. Many of the original fields related to asset management requirements, a lot of data was missing and attribute fields left blank. Errors were found in both the spatial and attribute data. The process of consolidating the data was made difficult by replicated unique identifiers, missing links, missing data in fields, ambiguous data and conflicting fields. The data contained a number of errors. Some were obvious, such as drains with pit attributes and box culverts with diameters. The data entry errors were not so obvious but still had to be identified and corrected. Our study suggested that data entry rules should be developed and applied to data entry to avoid some of these problems.
The data needed for this project consisted of the following:
The data available from the councils at the start of the project can be summarised in the table below.
| Council | Digital Data Coverage |
Software |
Hardcopy Data Coverage |
| ADELAIDE | 90% |
ARC/INFO |
Part |
| ADELAIDE HILLS | Nil |
Part |
|
| BURNSIDE | Full |
Maestro |
|
| CHARLES STURT | Nil |
Full |
|
| HOLDFAST BAY | Full |
MapInfo |
90% |
| MARION | Full |
Maestro |
|
| MITCHAM | 95% |
ParaMap/Excel |
|
| ONKAPARINGA | 90% |
MapInfo/Access |
75% |
| UNLEY | Nil |
95% |
|
| WEST TORRENS | Full |
ArcView |
Part |
The first step in creating an integrated database was to collect all the attribute data and process it into single common format. The second stage was to then capture all the spatial information about the stormwater network of pipes and open drains. The spatial data then had to be integrated to create a contiguous system that allowed water to flow through it.
Because each council had their own method for storing information a single database that could store all the original data and the new attributes had to be created. This ensured that no original data was lost and made provision for all the new attributes of the pipes to be used throughout the system. Some of the components that needed to be captured were, size, construction date and the material used for the pipe. The system is also recorded features such as side entry pits, junction boxes and gratings, which have more of a point location, rather than the linear features of the pipes. Some council’s recorded both point and linear features in the same database creating difficulties with attributes like width and diameter. A standardised approach was adopted to handle all the different types and provide a useful final product. The data dictionary developed for the project was an amalgamation of a number of different approaches to storing such data. This dictionary format is now being requested by other councils to use as a tool for standardising their asset data collection.
The spatial data was then taken from the range of different digital systems and combined into ARC/INFO. The range of data types included the GIS packages ARC/INFO, ArcView, MapInfo, Maestro (Formida) and Latitude and also included an asset management package called Paramap.
The main exercise was to convert each data format into an ARC/INFO coverage and to get the attribute data into the INFO tables.
A new field called ‘accuracy’ was added for spatial and attribute data based on the capture method and the time since checking. Additional spatial data had to be generated to comply with the project topology and make the system flow.
Once the data was aggregated the topology had to be built to provide the modelling and tracing functionality described below. The process involved the following steps:
Allocation of points to network - Original data in two separate data sets. Arc/Info data model;
Edgematching - Connect data at council boundaries;
Connectivity - Connect data within council boundaries;
Flow Direction - Make sure nothing runs uphill. Arc/Info Network module

Figure 3. Example of Data Processing showing original data without Node Snapping

Figure 4. Final Stormwater Network Coverage for the Patawalonga

Figure 5. Detail of Stormwater Network Coverage
Once the database had been created and a single spatial system developed a number of different uses were possible.
For example modelling can be undertaken to:
The following data was supplied on CD to the various stakeholders at the completion of the project.

Figure 6. Trace Example through the network from a site of an Oil Spill

Figure 7. Trace Example through the system showing locations of two pollutants and their possible source

Figure 8. An Example of the Stormwater Network overlaid on an Aerial Photograph for Asset Management and Maintenance

9. Another Example of the Stormwater Network added to a 3D model for Flood Management
The construction of the Integrated Stormwater GIS has created an opportunity for
The project was funded by the South Australian Environmental Protection Agency, Planning SA, Catchment Management Subsidy Scheme, Transport SA and the Patawalonga Catchment Water Management Board.
The project was undertaken in collaboration with BC Tonkin Pty Ltd who were involved in the hydrology and data collection, and the City of West Torrens who performed data digitising and field data pick-up. The author wishes to acknowledge the assistance of Megan Tutty and Karen Hansen, at Mapping and Beyond, for their work in constructing the GIS database. Key people from BC Tonkin included Paul Lightbody and David McDonald along with Stephen Walker from the City of West Torrens.
Integrated Stormwater GIS for the Patawalonga Catchment, Adelaide, South Australia - Final Report. (2000). BC Tonkin Pty Ltd, Mapping and Beyond Pty Ltd and the City of West Torrens. Presented to the Environmental Protection Agency, South Australia.
Ian Overton
Managing Director
Mapping and Beyond Pty. Ltd.
33 Queen Street, Thebarton, South Australia, 5031
+61 8 8303 3841
+61 8 8303 5719
ioverton@mappingandbeyond.com
http://www.mappinganbeyond.com