Data Integration and Analysis for the Year 2000
Author: Tobias Wolf
Paper # 261
Abstract & background
EPA Region 3 was interested in expanding its ArcView user base. In order to achieve this goal, EPA had to develop solutions to minimize ArcView’s complexity, facilitate use for those with minimal computer skills, and allow the user to access and retrieve data with ease. In an effort to familiarize EPA Region 3 staff with the structure and content of its data library, the GIS Team developed an ArcView Application named View Assistant. View Assistant delivers technical GIS data to a large group of end users with different levels of computer/ArcView proficiency. The user interface was created with Dialog Designer and allows the EPA to organize all their GIS data into user-friendly data selection palettes. The data palettes reduce ArcView’s complexity and provide an enhanced understanding of EPA’s data structure by automatically loading and classifying data with in a view automatically. This makes View Assistant an intuitive, robust and fun tool to use for all EPA staff.
Technical details
View Assistant is an ArcView extension that was developed using Esri’s Avenue and Dialog Designer. This extension was created to simplify ArcView for a large diverse user base. View Assistant was programmed with PC ArcView 3.1 on a Windows NT machine. The Dialog Designer extension was used to make GUI’s that would allow users to select data from the EPA’s data library. All of the EPA’s data is kept on a Unix server, which can be accessed and transferred to the NT environment via the software Samba.
EPA employees that would like to use GIS at their desktop computer are placed into the EPA’s GIS group on the LAN. The EPA’s LAN delivers a network version of PC ArcView 3.1, using Novell. Novell is able to deliver the ArcView software plus setup the user with Samba and access rights to the EPA data on the Unix server. All data on the Unix server is read only access so there are no problems with users corrupting the data. The central location of the data also gives the database administrator the ability to easily update data on a regular basis. The updated data that goes into the data library is always given the same name as the previous data set so that View Assistant can recognize the data and no programming changes have to be made. All data that is brought into ArcView using View Assistant is classified using avls (ArcView legend files). Some avls are created manually and some avls are created on the fly within ArcView depending on the complexity of the data set. Details of other tools in View Assistant will be described in the Overview section.
Overview
Now I will show you how I disguised ArcView to remove its’ complexity of ArcView while its’ functionality.
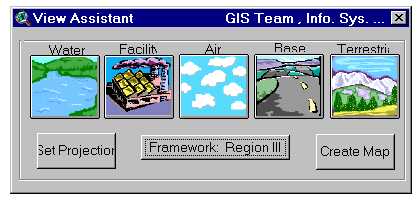
The View Assistant GUI contains everything you need to create a complex view and map. The interface has four main functions, Data checklists, Framework button, Projection button and a Layout button.
View Assistant’s Main GUI Interface
Colored Data category buttons used to access data sets
Data checklist:
The View Assistant interface contains five data category buttons, which open separate GUI’s containing data checklist. These buttons serve several different purposes:
They organize the data into easy to understand groups, in plain English names.
They allow users to add and delete data from a view.
The data that is added is classified with appropriate symbology.
Tables are joined automatically to shapefiles to produce complex data sets.
How this helps end-users:
The buttons eliminate the need to search for data within complex directory structures, with cryptic file names.
Easy to see what data is available
User does not need to know how to classify the legend of a shapefile or how to join tables to a shapefile.
Allows users to save smaller projects with minimal data, since all data can be loaded quickly. There is no need to keep any extraneous data in a project.
View Assistant’s Data Checklist GUI
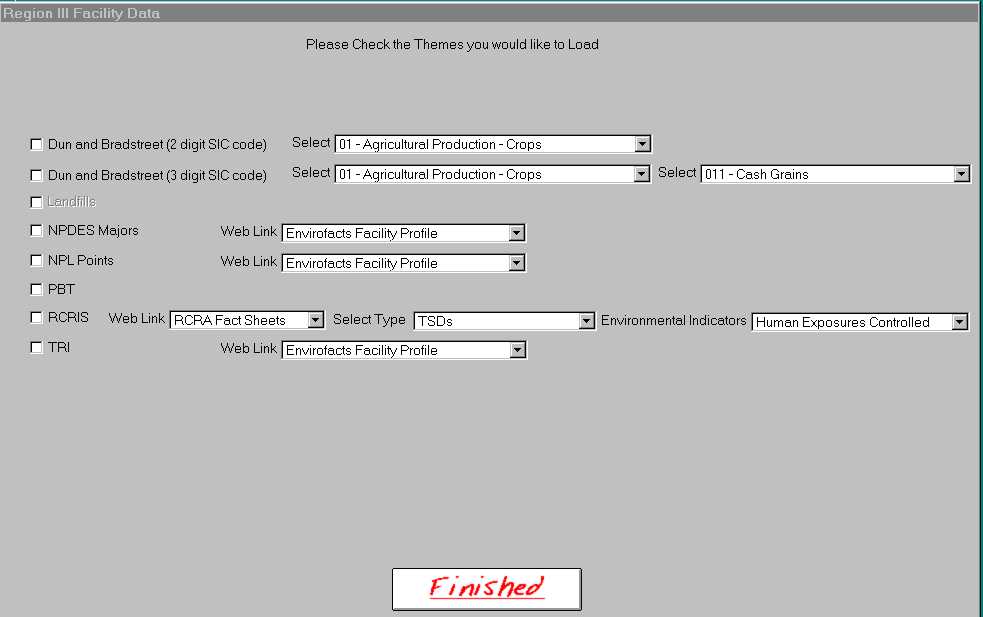
The data check list shown above has some special features. After pushing one of the data category buttons from View Assistant’s main GUI, a specific data checklist will become visible. The above data check list is a grouping of EPA’s Facility data, shown in alphabetical order. From this view it is immediately apparent to the user what type of data is available without searching through any directory structures. Also in order to load a theme the only thing the user needs to do is check the appropriate box. Another thing to notice is that some data is general like the PBT and other data requires other drop down selections, which queries the data layers producing more specific and complex data.
Other Data features:
Since the themes load automatically we have built in advanced ArcView functionality to make them more useful. When certain data is added to the view several hot linking features will be available. Most of the EPA facilities have been automatically linked to an Internet web page with specific data on each of the sites. We have also created our own custom hotlink button, which creates layouts summarizing data with graphs and charts for specific watersheds.
- Hot-linking the themes to the Internet capitalizes on investments already made by the agency. This link connects the theme to current information about the data.
View Assistant’s Framework GUI
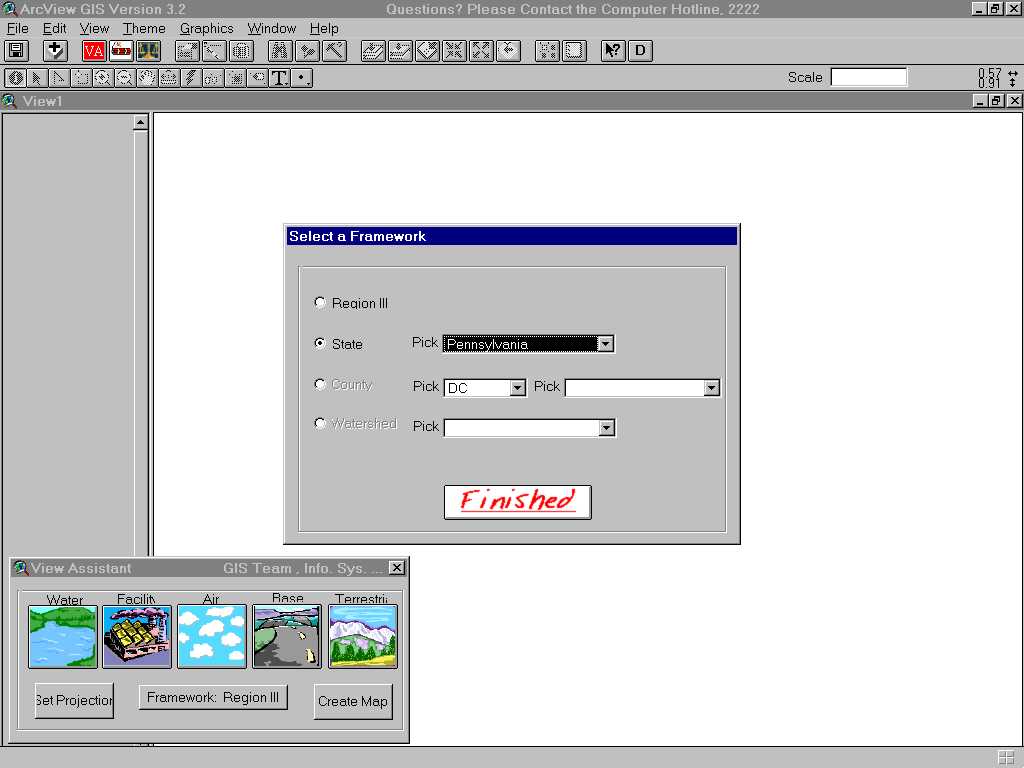
Framework button:
This button allows users to change the extent of their view from a regional view to a state, county or a watershed view. Once a user changes the framework all data that is added to the view will be clipped to that specific area.
How this helps end-users:
Allows user to work on data in a specific area and make a professional looking map without knowing how to clip data.
The Data checklist will automatically change to show the themes appropriate to the scale/framework chosen.
- Allows database administrator to make more data available for the different scales and
framework chosen.
View Assistant’s Main GUI Interface
Set Projection button:
This button gives users the ability to change the projection of their view form decimal degrees to three other projections. The selections of projections are named so that the user does not have to understand the concept of projections.
Projections: Albers Equal Area Conic (Equal Area)
Lambert Conformal Conic (Preserves Shape)
Equidistant Azimuth (Preserves distance and direction)
Decimal Degrees (Generic Latitude/Longitude)
Create Map button:
This button gives users the ability to easily create standardized layouts, containing all the basic map elements.
The button will prompt users to name the title of their layout and to choose whether they would like portrait or landscape layout.
Also users are able to select a logo to place on their layout from the logo chooser GUI, which is a custom GUI that pops up after the selection of the layout. Any custom logos that are used frequently, like the EPA logo, are placed into the chooser.
Finally the button adds the legends of all active themes including images, a map scale, and a north arrow.
Conclusion
As a result of these efforts more employees at the EPA have access and are using ArcView to explore and use GIS. It is interesting to note that even though the GIS team has been making maps for the EPA for many years a lot of the employees were unaware of the capabilities of GIS and the data available. View Assistant has made it possible for any employee to get a jump-start in using ArcView and viewing EPA’s data. To further encourage the use of ArcView and View Assistant, training has been available to all EPA employees. The two-hour session focuses on using View Assistant to learn about the data that is available and how it works with ArcView. The response has been great. As the user group increases more employees are incorporating GIS into their projects as a helpful tool.
Acknowledgments
David West, who was the head of the EPA GIS team until December of 1999, initiated the View Assistant project. He wanted someone on the GIS team to create a tool within ArcView to help EPA employees learn how to use GIS to explore EPA’s vast database. I used Avenue and Dialog Designer to develop View Assistant, which uses wizard like GUI’s to help beginner ArcView users get over some of the hurdles in learning ArcView. With View Assistant a first time user can sit down with ArcView and explore data, create complex views and maps.
The View Assistant extension was created for Region III EPA by D. Tobias Wolf, a Signal Corporation employee under contract to the EPA.
Author Information
D. Tobias Wolf
Senior GIS Analyst/Programmer
Contact info:
#215-814-5372 phone
Wolf.Toby@epamail.epa.gov
Signal Corporation
1650 Arch Street
Philadelphia, PA 19103
Mail Code 3PM50