Fabio Oliosi
Utility network managers often prefer to deal with schemes because they offer a faster visual access to technical and topological information. To this purpose Cablecom, a Swiss leading cable operator, chose Esri products, associated with FiberNet and CoaxNet solutions as their GIS standards. These two applications based on SDE API-C automate schematics generation from SDE, ArcFM and Telcordia's Network Engineer data. From an appropriate user interface they offer straightforward attribute and data access, custom and dynamic labeling and symbology for each network component. This paper presents the benefits, work flow improvements and peculiar aspects of these overall concept.
Cablecom, Switzerland's leading cable network operator chose an Esri solution to implement a GIS/NIS system. Network Engineer by Mesa Solutions coupled with ArcFM, ArcInfo and SDE provides the system framework for both geographic and functional utility network data management. At the same time Cablecom, in collaboration with Powersoft, R. Pian SA carried out a project that focussed the schematic representation of the entire fiber network and proposed new standard methodologies for technical schematic management.
According to the chosen approach, fiber network data is input through the geographic user interface of Network Engineer. A new customized version of FiberNet software tool by Powersoft, R. Pian SA can access this data as it provides clear and detailed schemata from the SDE and Network Engineer tables.
Powersoft, with its great experience in the utility network schematics domain, has offered, since 1986, a set of specialized software modules and solutions to problems related to utility networks where schemata are data driven automatically generated pictures. This allows one to easily keep all the network schemes up to date and to ensure the consistency between schematisation and network physical reality.
A teamwork that joint field experts from Cablecom and Powersoft provided a schemata representation model for fibers and cables and Powersoft implemented the customizations in order to fit the user needs.
Like a geographic map, a schema on its more synthetic and symbolic plan shows relations, structures, trends and details that are often hidden in text files, spreadsheets or databases. Thanks to schemata most of the technical activities in many domains like telecoms, utilities and road management becomes profitable.
Personnel from different departments must access up-to-date technical information anytime. Complete and detailed information should be presented using different layouts in order to fit specific needs. Some of them are described in the following sections.
On the other hand, technical schemata production and update activities related to a 4000 Km optical fiber network requires a great deal of effort in terms of time and tools. The use of standard CAD tools could be a time wasting activity if most of the information is already stored in GIS/NIS databases or in other tables or spreadsheets. Redundance and double entries normally compromise the database coherence.
Cablecom adopted ArcInfo with Network Engineer to provide an extremely efficient and specific data entry framework. CAD tool tasks can thus be limited to a simple, intelligent and specialized graphic data rendering.
In order to provide general views, an overview schema contains only network main nodes and the correspondent cable links. Nodes fit a regular grid on a pseudogeographic plan.
The details of the electro-optic components, the fibers and their connections need more detailed plans. Here geographical positioning is not necessary. On the contrary, logical sequencing of these components according to signal direction is important.
Both on overviews and on technical views the software has to provide simple drawing tools. The user may want to input annotation or sketch some complementary information or, again, to move some of the schema components. These functions could be useful to describe any planned modification or to improve the graphical layout.
Some components like splice boxes, needs an extremely detailed description of every single connected fiber. Large volumes of alphanumeric information requires documentation of source target owner, color, type, signal loss etc. The tool has to provide specific and standard views.
During input activities from the geographic plan, schematic representation is particularly useful and sometimes necessary. Data entry verification and quality check activities can be rapidly and efficiently carried out with an appropriate tool that offers a clear and graphical description of each detail.
This solution proposes an application called FiberNet that can access and process data from SDE and Network Engineer tables and present them in a schema view.
FiberNet is an open, database-driven application managing schematic layout representation and documentation for optical fiber network. It allows the user to create and customize representation for any optical component. Specific routing and positioning algorithms automate schemata generation.
The choice of the main network components that have to be represented on the schema is carried out on the map view through the Network Engineer user interface. NE/FN Interface transfers this list to Fibernet. Fibernet manages saving and retrieving operations on the DBMS. Of course a set of editing functions allows the user to modify and graphically improve the schema. FiberNet offers many options in order to alter the parameters of the schema generation process and therefore define the final layout.
System client/server architecture is quite simple as shown in the component diagram here below (figure 2):

The red arrows represent the data flux.
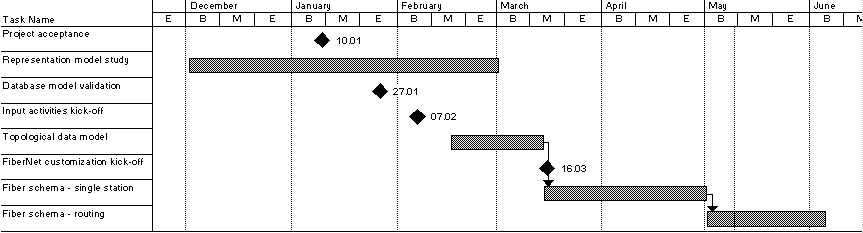
A preliminary analysis of the old Cablecom network CAD drawings and an analysis of client's current requirements led to the definition of a schemata representation model. The following schema types have thus been chosen:
This schema contains nodes and cables connecting nodes. Nodes are positioned on a virtual, regular and orthogonal grid.

Their position on the schema reflects as much as possible their relative geographical position according to graphical constraints like grid step or free cells availability. This kind of node placement is called pseudo-geographic. Three kinds of cable schema have been defined: Overview, Head-End and Hub.
Here vertical columns represent nodes and cables or buffers. Space between nodes may vary according to fiber routing complexity before and after each node.

Patch panels, splice boxes, splitters and Multi-Component Boxes (MCB) are inside nodes. MCBs and splice boxes have two kinds of exits for fibers: simple fibers and pigtails.
Patch panels have plug connectors for fibers. A patch cord may interconnect two plugs. Splitters can also be connected into a plug.
Routing zones exist between node and cable columns for fibers and buffers.
Cables and buffers are represented by thin and rounded rectangles.
Two kinds of fiber or cable representation are permitted: parallel lines or collapsed lines.
Since all fiber detailed information cannot graphically fit on the Fiber Schema, a specific designed schema offers a complete SMCB description. Such a schema will be generated on the fly on an A4 landscape oriented sheet.

The SMCB graphical representation stands in the middle of the form with two by five columns tables on each side.
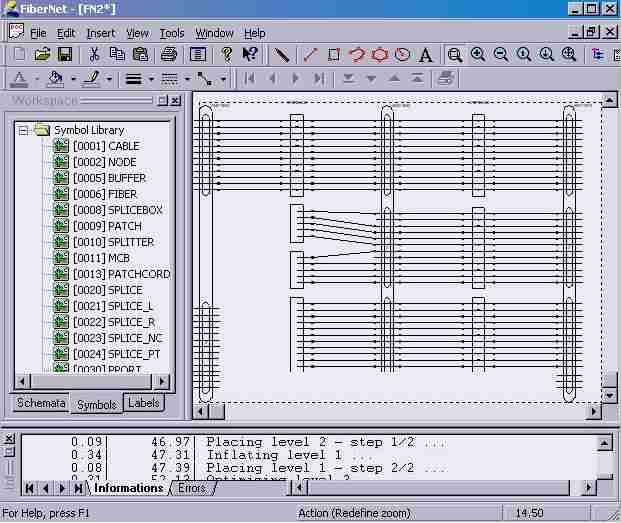
Effective, simple and efficient, the graphical user interface offers many toolbars and working windows. The left window, in the figure here below, allows the user to easily navigate within a tree structure of schemes, component attribute labels and symbols. The right window holds the graphics for editing, drawing and viewing operations. The bottom window contains a messages log.
Coupled with Network Engineer and ArcFM Esri solution a database-driven application managing schematic layout representation, connection and documentation for optical fiber network has been developed. Based on a client-server architecure FiberNet leverages the precious amount of information concerning technical data and components connections that are stored in SDE tables in order to offer automatic schemata generation. This solution minimizes drawing activity. It improves data consistency by eliminating redundant data and double entries. Fibernet guarantees ready to use and consistently reliable up-to-date schemata.
The author would thank Mr. Jürg Rubin, Cablecom Media AG, Zurich for the useful discussions on the representation model.
Fabio Oliosi
Sales and Technical Manager
Powersoft, R. Pian SA, Switzerland