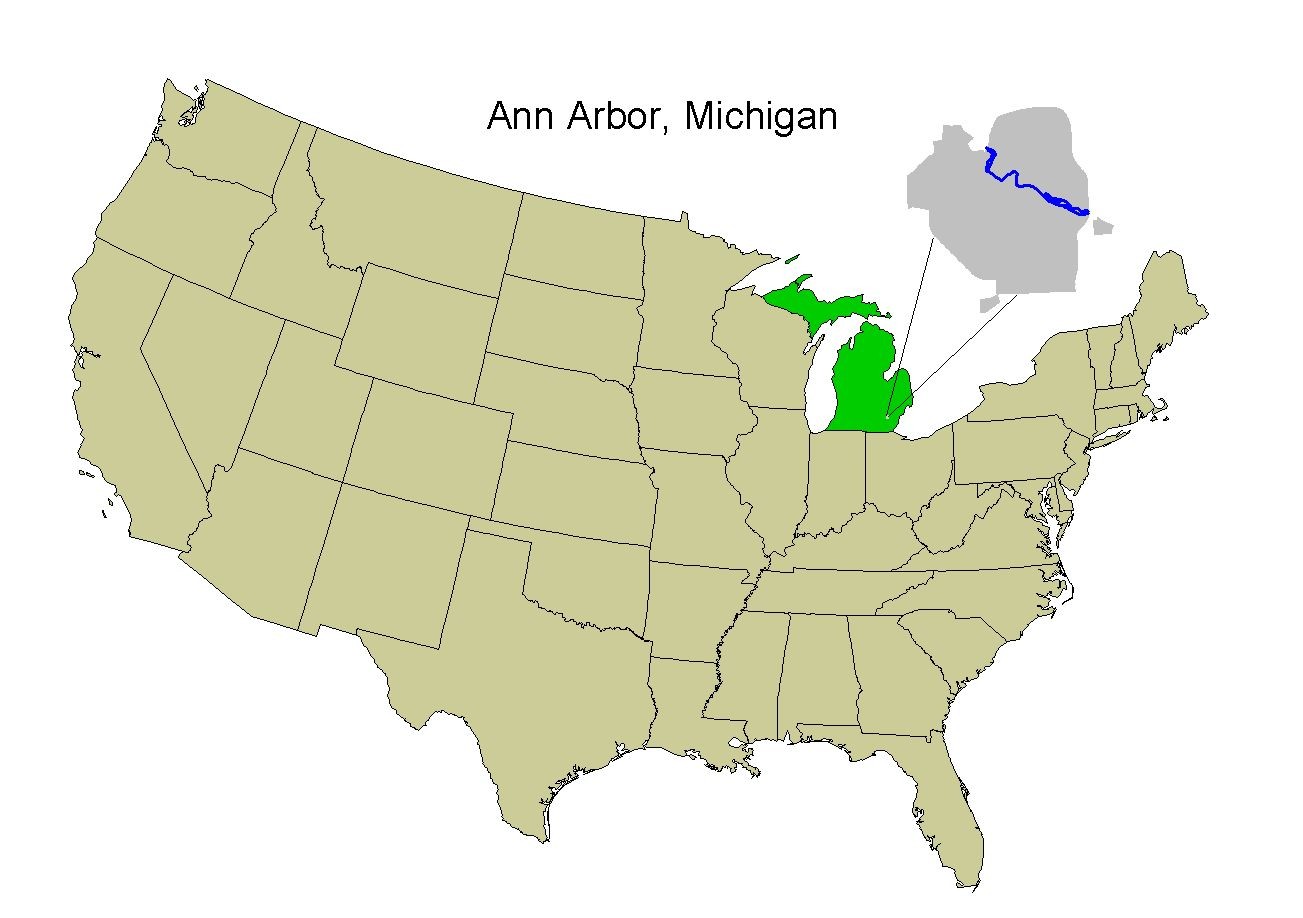
Figure - 1 Ann Arbor Geographical Location
The Ann Arbor Water Utility is a public utility that owns and operates a water distribution system that provides retail water service to more than 110,000 people.
An important element of the mater planning effort for the City was the development of a water distribution geographic information system and a new state-of-the-art hydraulic model.
The purpose of this paper is to discuss the benefits and issues of using Geographic Information System (GIS) technology for developing a hydraulic and water quality model of the City's water distribution system, evaluating water system improvement alternatives, and developing a long-range pipeline rehabilitation and replacement program.
Introduction:
Located in Southeast Michigan, Ann Arbor is just 45 miles west of Detroit and 35 miles north of the Ohio border. Figure-1 shows the geographical location of Ann Arbor. Ann Arbor is home to the University of Michigan, one of the country's top Universities. The University of Michigan shapes the composition of the city's economy, population and cultural awareness.
Figure - 1 Ann Arbor Geographical Location
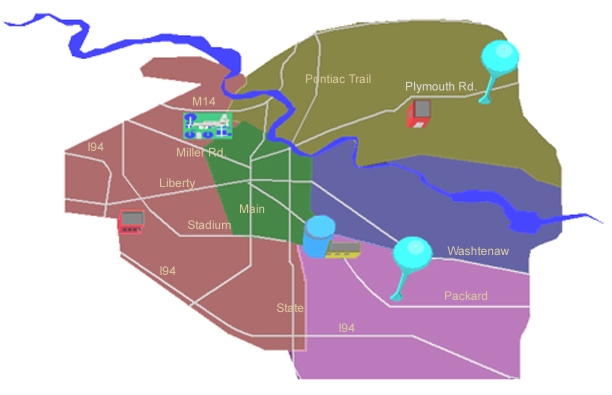
The Ann Arbor Water Utility owns and operates a water distribution system covering approximately 26.6 square miles and providing retail water service to more than 110,000 people. The City's water distribution system is comprised of five pressure districts: Gravity, West High, Northeast High, Geddes High, and Southeast High. Treated water is delivered from the water treatment plant to thew distribution system by gravity flow and by two sets of high service pumps which serve the West High and Northeast High pressure districts, respectively. Four outlying pumping stations are used to transfer water to the higher-pressure districts and to pump water out of the ground reservoirs during periods of high demand. Water storage in the Ann Arbor system is provided by the clearwell reservoirs at the treatment plant, three outlying ground reservoirs, and two elevated tanks. The distribution system contains 448 miles of water mains, 3,646 fire hydrants, and 5,635 water main valves. Figure 2 shows a schematic layout of the distribution system.
Figure 2 - Water Distribution System Schematic Layout
Project Overview:
The Study Area for this study consists of the area currently served by the Ann Arbor water utility as well as parts of neighboring Scio and Ann Arbor Townships to be served by the Year 2020.
The principal elements of this study include the following:
Under a sub-contract to Black & Veatch, Woolpert Engineers, LLP converted 1" = 200' water distribution maps to an ArcINFO format digital file. After the conversion was completed, the GIS database tables contained relatively few attributes for the line theme and point theme. The only data captured during the conversion process were Pipe IDs, pipe diameter, pipe length, and Node IDs. No data was captured on pipe age, material type, or node elevations.
Several methods were utilized to obtain the additional information needed to continue the project tasks, including the creation of the distribution system hydraulic model. To obtain the Z-axis coordinates of the distribution network nodes, a USGS digital elevation model (DEM) was generated and intercepted with the node theme. Pipe ages were estimated using the City's replacement valve database. The ArcVIEW near command was used to allocate each pipe to the nearest replaced valve and each pipe was then assigned a preliminary age equal to the valve replacement date. In conjunction with Water Utility personnel, there were several interactive revisions of the preliminary pipe age database which ultimately led to development of a final version of the pipe age database. Based on the pipe age information and City's personnel's recollections, each pipe was then assigned a pipe material type.
Field Test Program
A field test program was conducted to determine the actual pump operating characteristics, and the actual pressure and flow characteristics within the Ann Arbor water distribution system. The results were used to help establish input data for the hydraulic model and to verify the accuracy of the model. Four different types of field tests were performed: (1) loss of head tests, (2) hydraulic profile tests, (3) hydrant flow tests, and (4) pump efficiency tests.
Hydraulic Model Creation
Ann Arbor's water distribution system was evaluated using the H2ONET program, which can be used to model hydraulics of a distribution system under a specified set of conditions. In general, the flow and hydraulic grade patterns depend upon the magnitude and location of system inputs and demands and on the characteristics of the water mains and other facilities in the distribution network.
The distribution network portion of the computer model was developed using Ann Arbor's GIS database. The GIS database contains information on the diameter, pipe material, age, and length of all water mains within the Ann Arbor distribution system.
Historically, hydraulic models for master planning have been generalized (skeletonized) to reduce the model complexity to a manageable number of pipes and nodes while still meeting the hydraulic accuracy needs for master planning. Typically, a skeletonized model for cities comparable to Ann Arbor may have included all pipes 10-inches and larger plus limited numbers of 8-inch and 6-inch mains where judged hydraulically necessary. Including additional detail would have been judged not cost-effective due to the extra work needed to add detail to the pipe network and to the demand allocation, the limited hydraulic impact of smaller mains, increased computer processing time, and difficulties in using more detailed hydraulic analysis results. In addition, computer hardware and software capable of handling models with several thousand pipe segments were not generally available until recent years.
Generalized hydraulic models have proven adequate for master planning
purposes, but as model uses are extended into analyzing a utility's day-to-day
service questions, utilities are exploring the benefits of more detailed
models. For example, including smaller mains may help the understanding
of a customer complaint if the probable cause is located in the smaller
lines. Generalized models are also not as appropriate for analyzing water
quality issues since the flow paths and retention times in the smaller
mains can be critical. Computer capabilities, hydraulic modeling software,
and GIS software have advanced substantially in the last few years, to
the point that managing models comparable to Ann Arbor's full system model
is feasible. Figure -3 shows the detailed fully system hydraulic model.
Figure-3 the detailed full system hydraulic model.
Demand Allocation
Once the physical aspects of the distribution system model were finalized, average day demands were allocated to the network junctions by user class for the base year (1997) and future design years. Nodal demands were determined from annual meter sales data at a parcel level. Water use for each parcel was assigned to the nearest model node. For large parcels that contain more than one model node, the water use was distributed uniformly across those nodes. The total average day demands for residential, industrial-commercial-institutional, university, and wholesale were summed separately for each model junction. Thus, the allocation of average day demand is based on a spatial distribution of nearly 22,000 individual customers.
In order to more accurately reflect the water demand distribution in the hydraulic model, water demands were not allocated to junctions along the major transmission mains, since service taps are generally not made on the larger-diameter transmission mains. Unaccounted-for water use was evenly distributed across the network junctions.
Model Verification
Before using the model, it is necessary to determine whether the hydraulic model provides an accurate representation of the actual distribution system hydraulics. In order to make this assessment, a series of analyses are conducted for the purpose of calibrating the distribution system model. Essentially, the calibration process consists of setting up the hydraulic model to reflect the actual water demands and operational conditions that existed during a specified time period, running the analysis, and then comparing the calculated flows and pressures with the actual flows and pressures as recorded in the SCADA records.
Water Quality
The water quality model is an extension of the calibrated Master Plan hydraulic model. Modeling water quality parameters requires Extended Period Simulations (EPS). Development of an EPS model involves incorporation of diurnal demand patterns, operational controls, and model verification. Several tasks were performed under the Water Quality modeling.
Water Age Analyses
Water age is defined as the time it takes the water to reach the customer's tap after leaving the initial sources of supply, which is the water treatment plant. Water age can be modeled with computer models running in Extended Period Simulation (EPS) mode. The water age at a certain point in the distribution system is calculated from the flow weighted average of travel times along the various flow paths from the source. Water age is also affected by retention of water in storage reservoirs. Since high water age corresponds to extended periods of time in the distribution system for various reactions to occur, water age is modeled as general parameter to evaluate potential water quality deterioration in water networks.
Fluoride Tracer Analyses
Fluoride is added to Ann Arbor's treated water for dental health benefits. Fluoride can be used as a tracer to determine travel time within the distribution network. Fluoride tracer tests can be used to help with the calibration of water quality models. In a fluoride tracer tests, the fluoride feed at the source is discontinued, and fluoride concentration is monitored at selected points throughout the network. The time between the source shutoff and the fluoride drop at sampling location depends on the flow travel time between the two points. The time of travel is estimated by the time require 50 percent reduction in tracer concentration (t50) at the sampling location.
Chlorine Residual Analyses
The Ann Arbor water treatment plant uses monochloramines for disinfecting treated water. In comparison to free-residual chlorination, chloramination provides combined residuals, which persist for longer periods of time. A measurable quantity of chlorine residual has to be maintained throughout the distribution network. A water quality model provides a means to predict chlorine residuals throughout the system and identify potential problem areas.
Pipeline Replacement and Rehabilitation
The Ann Arbor Water Utilities Department is responsible for maintaining the water distribution system, which represents a major capital and operating investment. As pipes deteriorate and begin to fail, a program to cost-effectively replace deteriorated pipelines will be an important part of system maintenance.
In order to identify and evaluate trends in main breaks and determine the basis for developing a pipeline replacement/rehabilitation program, a model was developed using GIS to compare water distribution pipes to historical main breaks. The model was then applied to determine specific replacement/rehabilitation recommendations in the pilot area.
The Water Distribution Management System (WDMS) is a software tool developed
by Black & Veatch for use in managing a distribution system and developing
pipeline replacement/rehabilitation programs. WDMS provides users with
an engineering-oriented database application that organizes the large quantities
of data that are associated with distribution system planning. WDMS was
used in concert with GIS files and spreadsheet files to analyze the historical
main break data and develop a pipeline replacement/rehabilitation plan
for the Ann Arbor water Utility.
Conclusion
The primary objectives of this multi-purpose project were to provide
the City of Ann Arbor with a state-of-the-art GIS database containing all
visible planimetric features and to develop a water distribution system
model to serve as the basis for future evaluation of the City's water distribution
system.
The City of Ann Arbor Water Master Plan establishes a road map for the improvement and expansion of the water distribution system to the year 2020. The City's water supply and distribution system infrastructure has been developed since 1880's and includes wells, a water softening plant, a network of distribution mains, water storage reservoirs, pumping stations, elevated tanks, and appurtenances.
The Master Plan focuses on development of recommended hydraulic improvements
for the water distribution system. Additional major areas of work include
development of a distribution system Geographical Information System (GIS),
a water quality model, and development of a pilot model for analyzing water
main breaks as a precursor to pipe replacement planning. The recommended
improvements will serve as a basis for the design, construction, and financing
of facilities to meet Ann Arbor's water demands while improving the overall
quality of service.
Reference:
(1) "City of Ann Arbor, Water Master Plan", Black & Veatch
Corporation, 1999.
(2) "Calibrating Hydraulic Analyses of Distribution Systems Using Fluoride
Tracer Studies, M.S. Kennedy, et al, Journal AWWA, July 1991, pp54-59.
Paul H. Hsiung
GIS Manager/Project Engineer
Black & Veatch Corporation
8400 Ward Parkway
Kansas City, MO 64114
Tel: 913.458.3442
Fax: 913.458.3730
E-mail: hsiungph@bv.com
Richard A. Stoebner
Project Manager
Black & Veatch Corporation
8400 Ward Parkway
Kansas City, MO 64114
Tel: 913.458.3255
Tel: 913.458.3730
E-mail: stoebnerra@bv.com