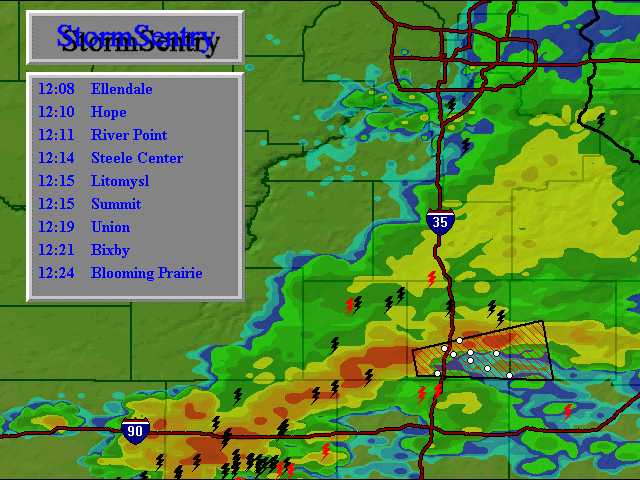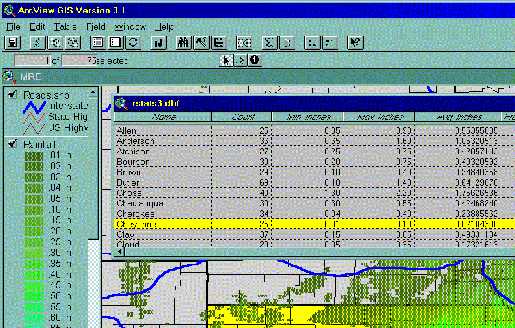
Figure 1. An example of National Weather Service watch/warning/advisory information point shapefile displayed in ArcView
A wide variety of real-time weather data, from sources around the world, updated as often as once per minute, are now available converted into several Esri GIS formats. Using this data, numerous examples of potential weather-related decision support applications can be developed. Several specific ArcView and MapObjects implementations of weather data merged with GIS are highlighted. Different examples of visualization and analysis of weather data within GIS is demonstrated. The collection, quality-control, value-added processing, and delivery of the weather data is also explained.
DTN Weather Services has developed a system that provides commercial availability of a significant variety of value-added weather data products suitable for use by the GIS (Geographical Information System) community. For many years GIS has been used to manage geo-referenced information to organize and solve a multitude of problems. However access to weather information was limited and/or burdensome. Early in the year 2000, DTN Weather Services introduced an extensive suite of value-added weather data in Esri (Environmental Systems Research Institute) GIS data formats. With this reliable, consistent, and quality-controlled weather data, Esri GIS decision support systems can now easily become "weather-enabled".
Over the past 30 years, the Esri data formats have become the de facto standard in the GIS industry. Due to Esri’s leadership role in the industry, DTN Weather Services chose to convert substantial quantities and types of real-time and forecast weather data into the Esri GIS data formats. This represents the first time that a comprehensive suite of high-quality, commercial-grade weather information, from worldwide sources, has been made available to GIS users, making it possible to immediately integrate live weather information into their custom applications.
DTN Weather Services has established a robust infrastructure to collect, apply quality-control, process, and distribute weather information to the GIS community. The processing of the weather data involves two fundamental steps: central pre-processing and GIS conversion/data management. DTN Weather Services has developed site deployable software to perform the conversion/data management.
Real-time and forecast weather data is collected at a central processing facility in Minneapolis via a multitude of sensing and communications satellites, the Internet, and dedicated phone lines connected to various government weather centers worldwide. Highly redundant computer and communications facilities combined with around the clock staffing provide commercial grade availability/reliability of the weather data.
At the central processing facility, advanced quality-control measures are applied to check the raw weather data for errors upon receipt of the data. Unfortunately it is not uncommon to encounter miscoded or corrupted raw weather data as it is received directly from the sources. Depending upon the end-user weather application, the presence of even a single incorrect weather value can substantially contaminate an analysis. To safeguard against data contamination, DTN Weather Services employs a variety of very sophisticated and complementary quality-control checks to the raw weather data. The result is very "clean" weather data stream that can be used with confidence in mission critical applications. These value-added weather data sets are distributed, via multiple communications satellites and the Internet, to end-users.
Whenever possible the weather information is collected from redundant sources. This provides several benefits including higher overall reliability/availability to the end-user and access to the first available report. Some of the weather data sources that DTN Weather Services utilize include, but are not limited to, include:
After the processed weather data has been transmitted to a customer site, the DTN Weather Services Metwork FileServer software automatically converts the weather data directly into Esri GIS formats. The user determines the formats of the converted weather data. Esri point shapefiles, polygon shapefiles, and grids are available options. Many GIS-ready geo-referenced bitmap images of weather information, produced by DTN Weather Services, are also available. Early usage patterns indicate popular utilization of images that have been converted into Tagged Image File Format (TIFF). In this case, the Metwork FileServer software automatically generates a corresponding Esri WorldFile (.TFW).
The Metwork FileServer also performs other functions, including data management, to ensure full access to the weather data by end user applications. Although certain weather data conforms to international coding standards as defined by the World Meteorological Organization (WMO), each weather type has certain data management requirements. For example, the National Weather Service watches/warnings/advisories bulletins are issued on an as needed (non-scheduled) basis. Although a particular watch/warning/advisory is issued on a location basis (usually by counties) for a specified length of time, it is not uncommon to have a portion or all of the watch/warning/advisory be pre-maturely modified or cancelled. The Metwork FileServer continuously monitors the status of each watch/warning/advisory and automatically makes the necessary updates to the corresponding point shapefile. Other types of weather data are also processed in such a way that the end user need not concern themselves with data specific data management issues that they may not be familiar with.
Figure 1. An example of National Weather Service watch/warning/advisory information point shapefile displayed in ArcView
Combining real-time and forecast weather information with a GIS has very significant potential for improving weather related decision support systems. GIS offers much more than a typical "display" of weather graphics; a GIS provides the capability of combining the weather data itself with virtually any other geographically based information and then makes it possible to calculate meaningful value-added results. DTN Weather Services value-added weather data, combined with a GIS, can immediately unlock analytical potential that was previously incomprehensible. By bringing weather information into GIS, analysis tools can be used to solve more complex business problems.
Several years ago, DTN Weather Services introduced GIS technology to the broadcast television industry with the StormPro weather radar display and storm tracking system. StormPro utilizes the Esri MapObjects applications development toolkit. StormPro integrates real-time weather data with GIS components to track storm systems, storm epicenters, and the areas they affect, and predict the future storm path over time. Detailed map backgrounds, with high-resolution weather data, are dynamically produced while on-the-air. By embedding GIS components into StormPro, a more detailed analysis of the geographical position of the storm is achieved, giving TV viewers a better understanding of the location and the overall potential storm impact.
Figure 2. The DTN Weather Services StormPro system is a GIS-based radar display and storm tracking system used by television stations throughout the United States
DTN Weather Services has been authorized by the National Weather Service to redistribute data from a national network of WSR-88D Doppler weather radar systems commonly referred to as NEXRAD. DTN Weather Services maintains continuous real-time access to all of these radar systems. Although previous work has demonstrated the utility (and challenges) of converting NEXRAD data into GIS formats, additional pre-processing of the NEXRAD data, prior to receipt by the GIS, adds considerable data. One example is the generation of a mosaic of precipitation. Every 5 minutes DTN Weather Services produces a mosaic of all of the precipitation activity in the country. The mosaic is based on the 0.5 degree elevation scan base reflectivity NEXRAD product (this provides the best overall depiction of where precipitation is actually falling to the earth). The mosaic effectively pastes together radar echoes from overlapping radar sites. Considerable additional value is added by the automatic removal of radar ground clutter and other false radar signals. With this process, the mosaic represents a depiction of precipitation, not simply radar echoes – a very significant difference. The mosaic radar product is then compared to other meteorological parameters and the radar data is assigned a probable precipitation type (rain, snow, sleet mixture). The mosaic data is available in either an Esri polygon or point shape.
Figure 3. The DTN Weather Services NEXRAD radar mosaic removes ground-clutter and other false-radar echoes plus encodes rain/snow/sleet characteristics
An example of improved weather-related decision support realized with the combination of weather data and GIS can be found in water resource management. An immediate calculation of instantaneous rainfall rate can be made from GIS-ready DTN Weather Services near real-time weather radar data products. This derived parameter is then immediately compared to the local geographical topography within the GIS. The result is an exact determination of how much water is entering a particular watershed, where that water will flow (based on terrain slope and runoff characteristics), and ultimately how the rain will affect stream flow. Dramatically improved watershed management and flash flood forecasting can result from the merging of GIS and DTN Weather Services value-added data products.
Monitoring global surface and upper-atmospheric weather conditions within a GIS is now a relatively easy task. DTN Weather Services provides both current weather observations and forecast information (up to 10 days into the future), for the entire earth, in Esri point shapefile and grid format respectively. Current observations from over 6,000 locations are continuously received, processed, and distributed. Data from global weather prediction models are available at least twice daily. The Metwork FileServer automatically converts the WMO forecast GRIB format grids into Esri grid format. GIS grid tools such as Esri ArcView Spatial Analyst provide maximum analysis potential.
Figure 4. An example of global temperatures, displayed in ArcView with Spatial Analyst. The Metwork FileServer converts WMO GRIB format into Esri Grid format.
Note: image size/quality is degraded in order to conform to publication guidelines
Energy related industries, that have historically used GIS, can gain new benefits from using DTN Weather Services supplied weather data in GIS data formats. For example, the electric utility industry can now more tightly integrate high-resolution forecast weather information into their operations. Forecast weather data from state of the art numerical weather prediction models are now available from DTN Weather Services in Esri grid formats. Short-range, localized forecasts or long-range national and global forecasts are available. One potential use of this type of data would be the generation of population and industry density-weighted calculations of energy load versus forecast temperature for a potentially more realistic energy load forecast. Improved energy load forecasts help avoid power shortages and allow utilities to be more competitive when buying/selling excess power on the national grid. Other parts of the electric utility can now utilize other real-time weather information to enhance their operations. For example, transmission operations monitor weather conditions such as lightning, severe storms and winds. If there is damage or potential for damage, the transmission engineer must be prepared to re-route energy or dispatch repair crews to return the grid to full operation. Finally, distribution operations monitors radar and lightning to manage field crews. As storms move into the service area, dispatchers need to know where to be prepared to send repair crews and whether or not to pull them off jobs or put off-duty crews on standby.
DTN Weather Services is now able to provide information from Global Atmospherics Incorporated (GAI) National Lightning Detection Network in the Esri Shapefile format. This allows easy integration of lightning data directly into GIS applications. In addition to the traditional display of the location of lightning activity on a map, a GIS provides the opportunity for precise calculations of the proximity of lightning activity relative to golf courses, outdoor concerts, fuel storage facilities and a multitude of lightning sensitive events for any geographical point. The introduction of lightning data directly into GIS applications opens up new ways to provide solutions to weather related problems.
Figure 5. GAI lightning data, updated each minute, is now available in Esri shapefile format from DTN Weather Services ready for direct integration into GIS systems
Emergency management agencies, already a user of GIS technology for advance planning purposes, can now easily integrate real-time weather data from DTN Weather Services into their operations to improve decision making and allow faster response times during threatening weather situations. Large-scale weather events such as hurricanes can now be monitored directly within a GIS. Numerous smaller-scale weather events can also be utilized with a GIS. For example, DTN Weather Services provides continuous real-time access to individual storm cells and their corresponding meteorological characteristics including speed and direction of movement, intensity, presence and size of hail, and presence of possible developing tornadic activity. Emergency management agencies, equipped with GIS tools and the appropriate weather data, can be more proactive and responsive towards many natural disasters.
Figure 6. The forecast track of a tropical storm or hurricane can be monitored within a GIS
Figure 7. The location and characteristics of individual storm cells can be tracked
The transportation industry, whether it is road, rail, or air, has specific weather requirements. The integration of real-time weather information into a GIS based transportation management system is not only possible, but is now much easier and more practical than ever to implement. Many applications are possible. For example, very accurate and immediate determinations of what sections of pavement being affected by specific weather features can allow more accurate traffic metering, road maintenance, re-routing options, and fuel and safety management. Likewise, aviators can now access specially pre-processed satellite image data files, as polygon shapes, that contain location and estimated height of cloud tops.
Although the use of remotely sensed images of vegetation and clear-sky land images are commonplace with GIS users, the availability of current cloud cover information has been lacking. DTN Weather Services now provides a unique set of cloud cover data suitable for use in a GIS. The cloud data, supplied as a polygon shape, is derived primarily from infrared sensors aboard a series of geo-stationary weather satellites. After the infrared images are geo-registered, they are compared to a variety of other co-located meteorological data to discriminate actual clouds from other cold non-cloud features (i.e. snow cover, cold dry air aloft). Once a cloud feature is identified, the height of the cloud top is then estimated by comparison to a vertical temperature profile of the atmosphere at that time and place. The resultant cloud data file shows only where clouds actually exist and approximately how high they are. The aviation community can utilize this information to track flights through a 3-D cloud field in a GIS.
Figure 8. The location and heights of clouds can now be integrated into an GIS
Note: image size/quality is degraded in order to conform to publication guidelines
Many land transportation management systems can benefit from the integration of weather into their GIS. One example is the railroad industry, interested in increasing overall efficiencies and reducing costs from weather induced derailments (high winds blowing material off rail cars and/or blowing rail cars off track). DTN Weather Services recently implemented an advanced automated weather alert system for a major railroad. The system was based on a variety of real-time weather information, the Metwork FileServer and Esri ArcView components. Specific weather events, as defined by the railroad, are continuously monitored. When a particular weather parameter exceeds a pre-defined threshold, and threatens to affect a particular section of railroad track, a strictly coded alert message is automatically sent to the individual dispatcher responsible for the affected section of track. This system allows continuous monitoring thousands of miles of track for user specified weather conditions. The combination of GIS technology and weather information makes possible advanced automated alert systems like this which have the potential to save substantial money due to smoother operations and fewer weather related disruptions of service.
Agriculture professionals, so often dependent upon the weather, can now access GIS-ready weather data for display and analysis of the potential effect weather will have on their crops. GIS and weather are appropriate components that can contribute to increased efficiencies in the emerging field of precision agriculture. The availability of geo-registered weather information that can, within a GIS, accurately map and calculate weather parameters for each section of cropland is now upon us. For example, the mapping of accumulated precipitation derived from radar can easily be accomplished. Radar-derived precipitation estimates, converted into GIS formats, affords the agricultural community the ability to easily and quantitatively evaluate the spatial (geographical area) and temporal (time) variations of rainfall. Individual rain gauges remain important for exact measurements of rainfall at precise locations. Rain gauge measurements can be used to calibrate the radar-derived precipitation estimates. This combination of old and new technology combine to provide the best of both worlds in terms of monitoring, with spatial and temporal precision, agriculture hydrological issues.
Figure 9. DTN Weather Services value-added products such as radar-derived rainfall estimates allow excellent spatial analysis of the rainfall over sections of cropland.
Note: image size/quality is degraded in order to conform to publication guidelines
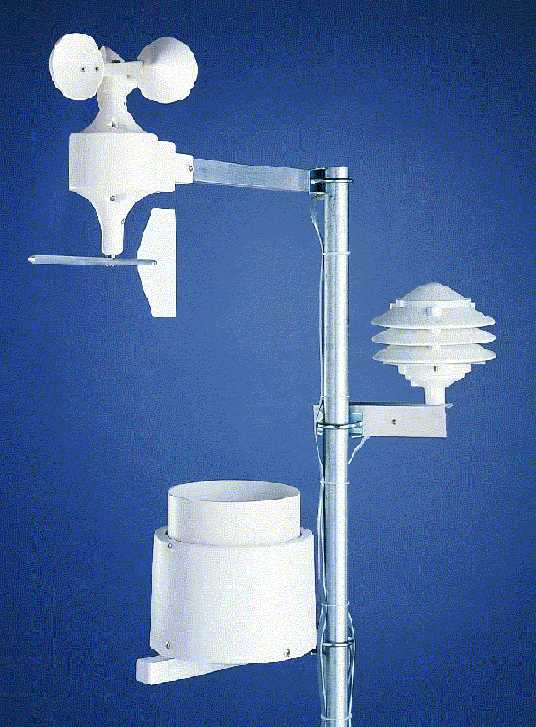
DTN Weather Services, working in conjunction with Praxis Software, has developed the capability to integrate truly real-time weather observations into a GIS, delivered directly from a network of weather sensors located at customer locations, via the Internet. This innovative use of the Internet brings essentially "live" weather directly into a GIS. Typical sources for surface weather observations (i.e. National Weather Service) have a nominal update frequency of one hour. The deployment of Praxis sensors provides real-time weather data, updated as often as every 3 seconds. Working in conjunction with the Metwork FileServer, the sensor data will be available once a minute for use with new or existing GIS systems as point shapes. Additional work is in progress to provide the streaming weather data directly into other Esri GIS formats. This new technology is akin to streaming multimedia content, albeit with weather data and into a GIS.
Figure 10. An example of a typical weather sensor that can be remotely deployed.
The weather data is streamed via the Internet and updated every 3 seconds.
The merging of GIS technology with properly formatted near real-time weather data from DTN Weather Services will make possible a new level of weather-GIS information analysis systems and will likely supplant the attention formerly given strictly to weather visualization. Bringing weather data into the world of GIS can benefit users and drive new applications. This is a new paradigm—merging high-quality, up-to-the-minute weather information with powerful GIS analysis and visualization. Quite simply it will give users the ability to do things that have never before been available.
DTN Weather Services became an Esri business partner in the 1996 and the two companies continue to work together to provide solutions to weather related problems that can benefit from GIS technology. DTN Weather Services will continually increase the amount and variety of weather information that will be available in GIS-ready formats. GIS-ready weather data from DTN Weather Services is available today via high-speed communications satellite delivery in conjunction with a properly configured DTN Weather Services Metwork FileServer. Internet access to weather information from DTN Weather Services will be available later in the year 2000. Please see www.dtnweather.com/gis for more information.