This paper presents the geospatial analysis conducted for the Little Bighorn Battlefield National Monument (LiBi), site of "Custer's Last Stand," by the Geospatial Information & Service Center (GI&SC) at the United States Air Force Academy. The LiBi GIS is intended to support a wide range of staff operations, including facility management, archaeological efforts, and visitor information. Recent effort has focused on the use of Esri's 3D and Tracking Analyst to shed light on some of the mysteries that still surround the battle and to present clearly current that understanding to visitors. This project is a research effort by the US Air Force Academy to provide senior-level cadets with a "hands-on" application of the GIS theory.
The lethality, ferocity and speed of the Battle of the Little Bighorn has burned that event into the collective American psyche in the 120-odd years since the battle. Those same elements combine to challenge historians in their attempts to accurately interpret and adequately describe the events of the conflict between Sitting Bull's combined Sioux/Cheyenne Nations and General George Armstrong Custer's 7th Cavalry, where in little more than two hours on a hot June afternoon in 1876 hundreds of warriors destroyed five companies (210 soldiers) of the 7th Cavalry. The GI&SC approached the LiBi staff to propose a combined effort to bring geospatial tools to bear in this challenge. The resulting work provides insight into the use of GIS to support historical reconstruction, as well as outlining the challenges of implementing GIS in small governmental agencies.
The GI&SC originally approached LiBi to provide a real-world GIS implementation project for cadets enrolled in an advanced GIS course. In addition, the project would allow us to further study supporting archeology with geospatial technology, providing LiBi with tools probably outside of their reach for a number of years, and confirming the viability of creating a "low-cost" GIS to a governmental agency using publicly available data.
The GI&SC effort is focused on three major areas of support to the LiBi staff - facility management, historical interpretation and LiBi visitor education. The initial work focused on facilities management. Cadets enrolled in a summer field course providing digital data layers created from the hardcopy blueprints identified as crucial by the LiBi Facility Manager, Cliff Arborgast. A fairly extensive collection of digital data was delivered to LiBi at the close of the summer of 1998, a legacy to the cadet's effort from their course work. This deliverable demonstrated the potential of GIS in facilities management at LiBi, and ended our work in this area.
The GI&SC shifted focus to the potential of ArcView 3.2 to support of LiBi's Chief Historian, John Doerner. A yearlong project focused solely on linking the 6033 artifact digital database to the digital AutoCad map of the battlefield and the artifacts. Both of these incredibly rich historical records were a result of the archaeological site investigation conducted by Dr. Doug Scott and Dr. Richard Fox in the summer of 1993. With great foresight the position of the artifacts were surveyed and captured digitally both in a database and a digital map environment. That forward thinking allows us to use the analytical power of GIS to analyze and interpret the meaning behind both the spatial and aspatial nature of the artifacts' distribution. As a first demonstration of this set of analysis tools, the GI&SC conducted a viewshed analysis of bullet locations, identifying what can and cannot be seen from those locations. The details of that analysis are included later in the paper.
Concurrently with the GIS historical analysis, the use of ArcView's Tracking Analyst was explored to support visitor education at LiBi. Using John Doerner's hand drawn notes on USGS topographic quadrangles of the battlefield a set of icons were "animated" to show the complex interaction of warriors and cavalry troops over time on the constricted terrain of the Little Bighorn River valley. Again, the details of that work are included later in the paper.
Despite our success in demonstrating the power of geospatial technology in these types of activities, albeit on a limited scale, we also witnessed the difficulty for a small agency to bring a GIS program to life. After a GI&SC technology demonstration and a user-needs assessment with the LiBi staff, the superintendent, Neil Mangum, committed time, staff and money to implement GIS at the National Monument. To date, LiBi has successfully procured the hardware, software, and data to establish their program. Much of the data supplied by the GI&SC to the LiBi GIS program comes from public sources over the Internet or purchased relatively inexpensively from the USGS, meeting our objective to establish data at "low-cost". However, LiBi's very small permanent staff suffered key personnel turnover (a problem shared throughout the geospatial technology field) causing a halt to progress in establishing the last two components of a healthy GIS - GIS staffing and organizational procedures.
The use of ArcView GIS in these projects has provided more to the GI&SC than probably to the staff of the Little Bighorn National Monument. Only through the real application of geospatial technology can educators make the classroom theory come to life for their students. Through this project, the GI&SC has demonstrated the viability of GIS to support the many responsibilities of the LiBi staff, even if the implementation of an effective LiBi GIS program may still be years away.
It is critical to define the role of the GI&SC in the support of the LiBi staff. Although extremely interested in the Battle of the Little Bighorn and the history of warfare, the GI&SC offers no opinion as to the interpretation of the battlefield events. The GI&SC limits its role to that of geospatial technicians providing a new toolset to the LiBi staff. Our collective goal was to offer new insight to the historians of the Battle of the Little Bighorn, allowing them to combine new data with traditional information about the battle. A new view of this data helps confirm or deny basic assumptions used in interpreting this brief and confusing conflict.
The most interesting GIS analysis, in our eyes, was to study the location of the bullets as found by the 1993 archaeological investigation. Our largest challenge was taking the spatial data, as stored in AutoCad, and converting it to the shapefile format. Once that transformation was completed, viewshed analysis could identify the potential firing positions based on assumptions about effective ranges of the various weapon systems, vegetation cover, and bullet trajectory.
Normally the conversion or use of an AutoCad file in ArcView is a trivial task, making use of AutoCad's direct exchange file format and ArcView's inherent ability to read those files. In this instance the identification information for each point and line feature in the AutoCad file was not included in that data layer, instead it was captured separately in an annotation layer. That kept us from linking the descriptive aspatial data, stored in a database format, to the spatial features directly, since no spatial object knew its "name."
Our solution was crude and time intensive. We had a summer hire high school student digitize a point shapefile from the AutoCad map, creating "bullet" points and entering the "ID" from the map into the shapefile table. The student's work left us with five "bullet" shapefiles: (a) .45 caliber Colt pistol bullets, (b) .50 caliber bullets, (c) bullets fired by weapons manufactured by Sharps, (d) a "miscellaneous" bullet layer, and (e) bullets fired on the battlefield well after the battle occurred. With each bullet "named" by its identification number we "joined" the database file to the shapefile, providing insights into the descriptive information about each bullet (e.g., bullet caliber, weapon).
Despite having solved the direct challenge of linking the spatial and aspatial data, we still faced one major obstacle - the transformation of the shapefile from an unknown "inch-space" coordinate system to a real world coordinate system. All other data layers created for LiBi were projected to the UTM coordinate system (UTM Zone 13 North) and a North American Datum (NAD) 1983. We were very fortunate that an NPS employee, Nikki Ernst from the Bighorn Canyon National Recreation Area, collected grave marker coordinates from the Battlefield. Using a "marker" layer from Doug Scott's AutoCad file, we created a set of corresponding tics, markers that we could clearly identify in both the GPS-surveyed data and the field-surveyed data. We copied these tics into the bullet layers and used them to transform the "inch-space" data to the UTM NAD 83 coordinate system in ARC/INFO.
Although knowledge of error propagation through the data is critical for absolute confidence in our results, the nature of data collection makes an estimate of our final accuracy out of reach. The root mean square (RMS) error from the transformation of the "inch-space" data was 1.9 meters, but data collection error for the field- and GPS-surveyed data is unavailable. In addition, the rectification of the scanned maps used to derive our terrain models lacks the RMS data for those processes. A comparison of data collected from numerous sources provides some confidence, but these comparisons are purely visual confirmation of the relationships between spatial features.
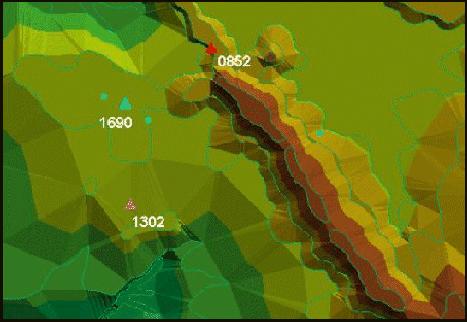
Using the Sharps bullet layer, the layer of most interest to John Doerner due to the high probability that Sioux/Cheyenne warriors used those weapons in the battle, we chose five .40 caliber bullets to analyze. Our goal was to identify common firing positions that could result in the final resting places of all five bullets.
Figure 1. Location of three .40 caliber bullets on the 1891 terrain model.
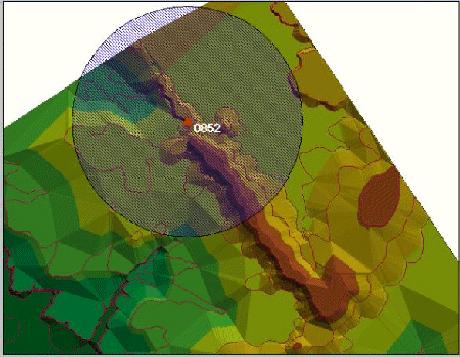
Figure 2. 300-yard buffer around bullet point.
Based on John Doerner's opinion that the effective range of a .40 caliber Sharp rifle is between 300 and 600 hundred yards (Doerner, 2000), we created a 300-yard and 600-yard buffer (the two extremes) for each bullet object, although that weapon was capable of hitting a target at 1000 yards in the right hands. The bullet points and buffers were draped on a terrain model created from the twenty-five foot contours of a digital 1891 USGS topographic map (Perry-Castańeda, 1998).
Using ArcView 3-D and Spatial Analyst modules, we computed two viewsheds for each bullet, limiting the viewshed to the extents of each buffer. We converted those viewshed grids to shapefiles, creating polygons that represent areas where the bullet might have originated, assuming no vegetative obstruction and a straight bullet trajectory.
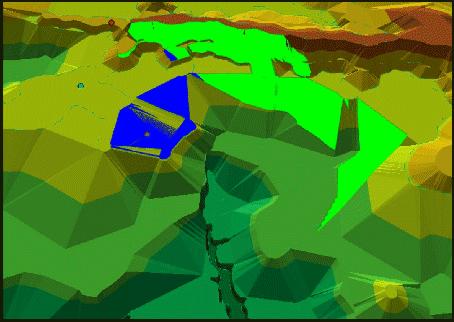
Figure 3. 300- and 600-yard viewsheds for a single bullet.
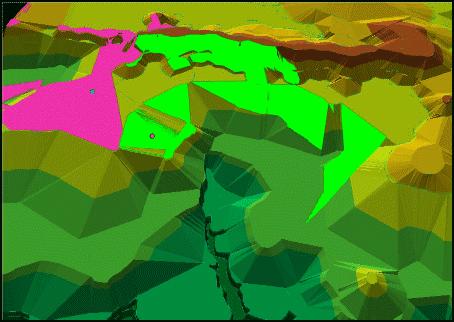
Figure 4. 600-yard viewsheds for two bullets.
We intersected the resulting viewshed shapefiles two at a time. We intersected two 300-yard viewsheds to locate common firing positions, then intersected the first result with the results of another set of bullets, and the process continued until one shapefile was created representing all common possible firing positions. For an effective range of 300-yards, no one location could have fired all five .40 caliber Sharps bullets. For an effective range of 600-yards, three areas could have fired all five bullets, as demonstrated in figure 5.
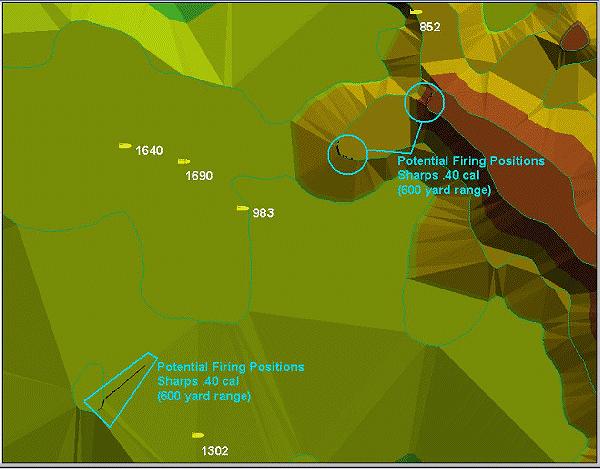
Figure 5. Results of the 600-yard weapon effective range analysis for the five .40 caliber Sharps bullets.
We feel this technique, although simple, is a powerful tool in this type of analysis - similarly powerful would be an analysis of bullet cartridges left on the battlefield. Unfortunately, since no bullet cartridge layers are available we leave this analysis for future work. These methods are very effective in identifying sites that could hold further evidence to confirm, or deny, the locations of combatants during the course of the battle.
On our trips to coordinate our GIS effort with the LiBi staff, we were struck by the powerful nature of the oral tradition used at the park by the Interpretative Rangers. In many cases, Native American rangers communicate the complex story of the battle with nothing more than an arrow in hand, as a pointer, and the battlefield behind them. It is a very effective method of educating LiBi visitors. The challenge to each visitor is to absorb the story while truly understanding the complex interaction between combatants, through time and spread over a great distance. An animated battle graphic could assist the rangers in communicating the complexity of the battle, without taking away the powerful story-telling nature of the ranger narrative.
To date we have successfully created digital animation files using ArcView's Tracking Analyst and Esri's Animation Control Extension. Surprisingly, the most difficult portion of this effort was the creation of effective icons to represent cavalry troops, Custer, and the various warriors. The icons shown below were found at various war-gaming sites on the Internet and adapted for our specific use for the LiBi GIS.

Figure 6. Animation icons used to represent "A Troop", the Sioux/Cheyenne Village, and Custer respectively.
Point coverages were created using John Doerner's hand-sketched portrayal of the battle events. Separate coverages for each known warrior party, cavalry troop, and Custer are used to animate the battlefield. The point coverages are converted to tracking themes by identifying the date/time information stored in the point layer's tabular data. We discovered that our version of Tracking Analyst cannot accept year values earlier than 1900, so all battlefield events have a 1976 year stored in their tables, although the month, date, and times are correctly described in the tables.
Figure 7. Tracking theme table for "Custer" points.
The Animation Control Extension exports JPEG format images at a sampling rate defined by the user. This allows the battlefield animation to be as smooth or coarse as the number of points and time stamps (new location every minute vice every five minutes) placed in each point theme. We encountered problems with the MPEG conversion executable that comes packaged with the Animation Control extension, but found numerous programs that can create an animation file (.avi, .mpeg) from the JPEG file set created by the Animation Control Extension.
The resulting movie file does a good job of demonstrating the confusing and complex action during this two-hour battle. The project should be expanded to demonstrate the distance and time impact of the events leading up to this battle, better communicating the relationship of events such as the Battle at the Rosebud between General Crook and the Sioux eight days earlier and 70 miles south of the Battle of the Little Bighorn. Most visitors to LiBi do not have a personal knowledge of the high plains of Wyoming, Montana and South Dakota to fully comprehend the spatial nature of the historic events, events like the Sioux/Cheyenne reaction to the gold rush in the Black Hills and the delays in U.S. Army troop movement. An extension of the battle animation could combine with, not replace, the oral tradition used at LiBi to more effectively educate the LiBi visitor.
We at the GI&SC have been very pleased with the overall demonstration of GIS in support of historical reconstruction, visitor education, and facility management for an agency such as the Little Bighorn National Monument. The potential benefits of the analyses described in this paper were not in question, but the ability for a small organization like the GI&SC or the LiBi staff to accomplish these analyses was of concern. The objective of this research was to identify prototypical steps in building a GIS for a small agency and demonstrate the potential of this tool, sparking interest in the LiBi staff, or in another similar agency, to investigate the benefits associated with the analytical power inherent to geospatial technology.
I would like to thank the USAFA GI&SC staff - Danny Portillo, Remie Williams, and "Dweebee" for their hard work in support of this paper. I would also like to thank the staff at the Little Bighorn Monument, in particular Superintendent Mangum, Chief Historian John Doerner, Chief of Facilities Cliff Arbogast, for your time, effort and patience. Also in the National Park Service, I owe a debt of gratitude to Theresa Ely and Chris Theriault of the Intermountain Region GIS Program Office, for their support and advice (it's in your hands now!). Thanks to my proofreaders - Sandy Benson, Dr. Jamie Harris, Dr. Bruce Linster and Lt Col Steve Slate, your comments have made this a much stronger paper.
Doerner, John, Chief Historian, Little Bighorn National Monument (LiBi, Montana: 8 June 2000) phone interview.
Perry-Castańeda Library Map Collection, University of Texas, http://www.lib.utexas.edu/Libs/PCL/Map_collection/Map_collection.html
Scott, Douglas, and Fox, Richard, 1987. Archaeological Insights into the Custer Battle. Norman, OK and London: University of Oklahoma Press.
Terry Shulman, "Guns of the Little Bighorn," http://nationalhistoryday.org/WildWest/articles/1998/0698_text.htm (Wild West Magazine, June 1998).
Utley, Robert M., 1994. Little Bighorn Battle. Washington D.C. : Government Printing Office, Division of Publications, National Park Service, Handbook # 132.
Major Christopher Benson, US Army
Assistant Professor
Mailing Address:
HQ USAFA/DFEG
Department of Economics & Geography
2354 Fairchild Drive, Suite 6K12
US Air Force Academy, CO 80840-6238
Office phone (719) 333-2557
Office fax (719) 333-7137
Email:
Current (through 7/7/00) Chris.Benson@usafa.af.mil
Permanent christopher.benson@us.army.mil