Abstract
One cares because federal and state governments spend millions each year trying to assure that all areas of the country, both rural and urban, have adequate primary care services. Health Resources and Services Administration funded researchers at the Dartmouth Medical School in September 1999 to create shape files for Primary Care Service Areas and to disseminate the underlying data and maps over the Internet. Sophistication of the client audience is expected to range from novices with little experience above the use of a browser to the highly sophisticated GIS professional. Experiences with ArcIMS will be described and the results to date demonstrated.
"HANOVER, NH -- An innovative national geographic information system under development at Dartmouth Medical School's Center for the Evaluative Clinical Sciences will allow health policy makers and analysts to track primary care resources and patient services."
Funded by the Bureau of Health Professions and the Bureau of Primary Health Care, the Primary Care Service Area project will develop a comprehensive and sophisticated database of primary care that could be a major planning tool for medical care. Directed by Dr. David Goodman, Associate Professor of Pediatrics and of Community and Family Medicine at Dartmouth and Stephen Mick, PhD, Professor and Chair of the Department of Health Administration at Virginia Commonwealth University, the project is developing primary care service areas (PCSAs) that represent locales of primary care clinicians and the populations they serve.
This paper describes the PCSA project, it's objectives, and the many ways in which Esri products are utilized in its implementation.
A. Introduction
The purpose of the PCSA project is to define and develop small, standardized geographic units for the entire nation that delineate the actual delivery of primary care clinical services. The need for a system that defines and describes the geographic boundaries of primary care is widely recognized among health care policy makers and analysts. To date, the United States has no such standardized method. Further, there is no primary care service area definitional system that is linked to a national database of pertinent health care resources, population descriptors, health care need measures, or utilization statistics that depicts exactly where, how, and how much in the way of primary care is delivered to the American people. A goal of the PCSA project is to produce just such a system.
Once such a system is developed, validated, and made widely accessible to interested users, it should enhance the ability of health workforce policy makers and analysts to answer a range of important questions. Which geographic locales are demonstrably underserved and to what extent? What characterizes the population of underserved geographic locales? How do such geographic locales correspond to other definitions of underservice? Public and private efforts to promote improved access to primary care should benefit by having a proven method that defines the geographic areas of actual use.
In order to achieve the goals of the PCSA project, the investigators plan to harness the latest computational capabilities, including Geographic Information Systems (GIS) and the Internet, to develop a comprehensive national database of primary care service areas that is easy to revise and update. Further, this national database will be accessible to a broad array of potential users with diverse objectives. More than a map, the system will incorporate a variety of relational databases that will permit policy and research analyses that span the gamut from the simple and straightforward to the most sophisticated and statistically advanced.
Unique features of primary care service areas (PCSAs) include:
· the empirically-based definition of service area boundaries that circumscribe the actual pattern of local primary care use between patients and providers.
· the link between each PCSA and numerous variables that describe primary care resources, especially the workforce.
· the link between each PCSA and variables that describe the population characteristics and measures of population need within each PCSA boundary.
· the link between each PCSA and primary care utilization.
· the ability of the PCSAs to be cast into a larger framework of relevant political, sociological, economic, and market characteristics at other levels required by users.
Most knowledgeable authorities have long recognized the need for the kind of database described above in order to understand primary care delivery in the U.S. health care system. The PCSA project will take a major step in producing just such a database.
B. Statement of problem
The need to improve the availability and effectiveness of primary care services in the United States was recognized as long ago as 1932 in the Final Report of the Committee on the Costs of Medical Care.1 For much of the 20th Century, numerous organizations, both public and private, have attempted to advance the insights of the CCMC when it recommended then what today is essentially called primary care: care that is first contact, longitudinal, comprehensive, and coordinated.2 These ongoing efforts are impeded without an adequate data infrastructure that reveals the relationship between primary care use, resources (especially appropriate workforce data), and the need for such care in the population.
To the extent that information about primary care delivery is available, it is often limited to specific areas and is not national in scope. In addition, it is outdated, inaccurate, and non-standardized. Databases on primary care rely on units of observation that are commonly too large. Typically, they include large geographic areas (states and counties) unrelated to the localized delivery of primary care. For many potential users, access to primary care information is also expensive, requiring specific primary care data collection, and is difficult to obtain. Others are not sure where to find data relevant to their projects, and may waste effort seeking such data without knowing what is routinely used by others in the field.
The PCSA project focuses on three classes users of primary care data. The first are federal offices that are interested in the supply and availability of primary care resources (physicians, mid-level providers, and clinics) in many different areas of the country. The data may be needed to evaluate federal programs that seek to improve the availability of primary care services or to identify populations eligible for federal funds. The second class is state offices that are primarily interested in the local population needs of the state. Data may be necessary for developing new state programs to improve primary care access or as part of applications for federal programs, such as Health Profession Shortage Area (HPSA) designation. The final user class includes the health services researcher who may work in an academic institution or a federal agency. This user may have a research interest in the clinical workforce but be investigating primarily other areas of medical care effectiveness and efficiency in which the supply of primary care resources is an important, but not a major, consideration. Other potential users will not be discussed further but should be mentioned: health care systems planning their primary care groups, municipalities that operate primary care clinics, medical schools and graduate medical education programs that are interested in the workforce requirements of their regional population, researchers who have a particular interest in identifying areas with very high primary care clinician supply, and instructors teaching health care delivery to graduate students.
All of these users face the common weakness in our current measurement of primary care workforce and delivery. The most readily available data are concerned with the physician supply in the US as a whole. Data with greater geographic specificity are often limited to state and county tabulations.3 Travel to primary care, however, is usually localized to just a few minutes and miles.4 State measures obscure the variation in the workforce and can portray a state as having a moderate supply when most localities have either a very high or very low supply. County level tabulations5 may also have substantial internal heterogeneity in the workforce. Furthermore, county-based measures are biased as patients freely travel across county boundaries seeking care. For example, a county may appear to have a very low supply of primary care clinicians while most of the population lives across the county line from a high number of providers. States and counties were not created for the purposes of measuring health care resources; when applied to this purpose they often mislead rather than inform.
Data timeliness and ease-of-use are also important. Health care planning demands information about today whereas even the best data represent the past. Some time lag in information is inevitable, but the current delays can be improved by shortening both the time for collected data to be available and the time it takes for users to conduct the actual analyses. The occasional users are at a particular disadvantage. They need to identify (or reidentify) the primary care clinician data, obtain it (sometimes from different sources), learn how to analyze it, and then finally conduct the analyses and prepare the findings. There are relatively few analysts who are experts in data related to primary care resources or the clinical workforce. Most are learning at the same time that there is a pressing need to produce the analyses. Throughout this process, the data age and become less useful with every delay.
The lack of standardization in the measurement of primary care resources is a particular issue for federal users and researchers. One of the attempts to address the weakness in geo-political boundaries for measurement defines units for only a few areas of the country e.g., rational service areas of HPSAs, the Health Profession Shortage Areas. States vary in their political interest in applying for HPSAs and in their approach to defining rational service areas. Regulations intentionally allow latitude in their definition, but this results in non-standardized measurement of underserved populations. Other states, such as Maine and California, define their own geo-population units; this creates a standard for one region, but the analyses end at the state line. Even users concerned primarily with their own state can often benefit from a national context. Currently, this is not possible without comparable measurement units for the entire Nation. The lack of standardization adds one more barrier to the already difficult use of a balkanized and inefficient data infrastructure.
C. Other Approaches to the Measurement of Health Service Areas
Traditional and conventional methods for defining and measuring geographic areas served by practitioners have revolved around three general approaches.6 First is that of geographic methods alone, notably the use of distance and area as key definitional features. Within geographically determined boundaries, characteristics of health care resources and the population are typically tabulated.7 Second, geopolitical boundaries have been widely used as proxies for medical/clinical service areas. As in the first approach, the size, composition, and nature of health care resources and populations are then determined.
In both approaches, the actual dimensions and patterns of utilization of services are not directly measured or not measured at all. Use of services is generally inferred from population characteristics or from the number of providers who end up in the defined area (or from provider/population ratios). Hence, if the provider/population ratio is low, it is assumed that use of services is low, although there is no strong justification for such a judgment.
The third approach to the measurement of health service areas, that of small area analysis, is based on actual utilization patterns, although almost all such efforts have revolved around hospital utilization.8 Small area analysis (SAA), pioneered by Wennberg and Gittelsohn,9 begins with a patient origin study to define health service areas and then measures resources and utilization by the resident population of the area. These methods have shown astonishingly high levels of variation of clinical services and procedures across geographical areas that are homogenous with respect to both population and provider characteristics. The areas defined with patient origin studies offer the three advantages of demonstrating the geography of utilization, accurately measuring the per capita supply of resources and utilization, and closely reflecting the influence of the areas providers.
D. The Primary Care Service Area approach
The PCSA Project seeks to rectify the previously discussed deficiencies in the data infrastructure by creating service areas that reflect utilization patterns for primary care, characterizing those units with the most currently available data, and then disseminating the data over the internet in conjunction with analytic tools.
The PCSAs build on the small area analysis by extending the hospital service area approach that has been successfully and extensively employed by Wennberg and his Dartmouth associates to produce the groundbreaking series of Atlases. 10-12 In particular, the PCSA Project is unique in four respects:
E. Characteristics of Project Data to be disseminated
A major goal of the PCSA project is the development of prototype systems for the dissemination of physician workforce related data in forms suitable for widely diverse users with differing computing resources.
With suitable safeguards for privacy and legal ownership, some data will be released as unrestricted into the public domain. Other data carrying license or privacy restrictions will be released only to registered users who have signed appropriate license documents.
A second goal of the PCSA project is to make the data readily available to those who may most benefit from its use. To this end, we plan to demonstrate use of the internet as a distribution medium.
Data will be provided in a variety of forms including, but not limited to:
· Tabular data that can be linked to geographical shapes or objects. An example is physician or population data.
· Spatially enabled data that has geographical elements (such as PCSA shape) imbedded within them.
F. Objectives for Information Dissemination
The capabilites and available resources of clients for the project data are expected to vary widely. We anticipate that many clients will wish to view data simply in tabular form. Others may gain greater insight when information is displayed on maps. We will demonstrate a cost-effective way to provide this diverse group with access to the Project data while incurring no costs for proprietary software. At the other extreme, some clients may have licensed GIS software and wish to manipulate the project data to conduct complex analyses or produce high quality images.
We believe that the internet may be effective for no cost distribution of data. However it does not provide a complete solution since some users may not have a reliable or fast enough connection to the internet, and security considerations may make internet distribution undesirable. We are developing our system so that it can be distributed on CD-ROM for those situations where internet distribution is impractical or undesirable. By combining an internet solution with a traditional CD-ROM distribution, it is possible to deliver our solution to a wide range of users.
Not all users have the same skills or needs for the information to be distributed by the PCSA project. To this end, we have divided the users into 3 groups: beginner, intermediate and advanced, based on computer skills. Table 1 lists the characteristics of these users and the capabilities of our proposed system with regards to each group. The beginner level allows users to access PCSA data using only a web browser and reasonably fast modem connection. At the intermediate level, users may view all of the summary data provided by the PCSA project using a browser and JAVA applets downloaded from our web site. These users are expected to have a high-speed internet connection. Advanced users may download summarized data and shape files for linking with local data and incorporation into custom reports.
Table 1. User Characteristics
|
Group |
Characteristics |
Usage Summary |
System Capabilities |
|
Beginner |
Uses computers for e-mail, Word Processing, Spreadsheets and some Web access. Has little or no GIS experience. |
Using a Web browser only, users may access PCSA level data only. |
View GIS maps of the USA with PCSAs displayed. Scroll and zoom on maps. Display selected attributes for PCSAs and corresponding population characteristics for PCSAs. Download summary information for selected PCSAs or USA into tables suitable for incorporation into documents or presentations. Print maps suitable for presentations. |
|
Intermediate |
Same as beginner plus comfortable with Web and 1 or more GIS packages. Understands and uses databases. Understands GIS concepts of layers and data display for layers. |
Using a Web browser enhanced with a JAVA applet from the PCSA Web site, users may use data from any level in the PCSA project and link with local data. |
Same as beginner plus change shape files and layers to allow access to all shape files and layers available in PCSA project (not just PCSA level data available to beginners). Create and download tables plus print maps for all data available in PCSA project. |
|
Advanced |
Same as intermediate plus comfortable with a database query language such as SQL and knowledgeable about GIS systems. Capable of linking together databases (especially local and national data) to generate reports from databases and GIS systems. |
Using a local GIS system, users may download data from the PCSA Web site for incorporation with local data in customized analyses. |
Using a local GIS system, link PCSA data with local data. Produce custom reports combining PCSA data with other data. Print appropriate summary tables and maps for reports and presentations. |
G. Use of GIS and Esri Products in the PCSA Project
1. Generation of PCSAs
PCSA generation begins with the acquisition of Medicare Part B Claims, 50 gigabytes of data for the current project. Using the techniques of small area analysis 9,13 SAS programs are used to generate a patient origin matrix. In a typical patient origin matrix, the utilization of each ZIP Code�s residents (population ZIP Code) is tabulated to the ZIP Codes with health care providers (provider ZIP Codes). In this project, the providers of interest would be those generating Medicare claims for primary care services. The utilization would be the number of visits, which equals the number of claims. Given 40,000 ZIP Codes, this matrix theoretically could be approximately 40,000 x 40,000. In practice, not every ZIP has a provider and not every population ZIP has utilization to each one of the provider ZIPs. Once the matrix is generated, population ZIP Codes then logically cluster to the provider ZIP, that provides the plurality of the utilization.
After the generation of patient origin matrix files, ArcView is used to finalize the PCSA assignments. An abbreviated flow chart of the PCSA assignment steps is found in Figure 1. ZIP Code maps are linked to a matrix and the map of "crude PCSAs" are viewed by our geographer. ZIP Codes that are not contiguous with other ZIPS in the same PCSA will be reassigned to the provider ZIP Code with the next highest sum of preference fractions (or visits depending upon the matrix). PCSAs with a total population count of less than 1,200 are also merged. 1200 has been tentatively selected as the lower limit that can support a single family practitioner. After all assignments are made, the PCSA ZIP Code boundaries are merged (with internal ZIP Code boundaries deleted) to create a PCSA map. A "cross-walk" file is also created that lists each ZIP according to PCSA assignment. These files are used to test the "performance" of the PCSAs and, when PCSA assignments are finalized, form the basis for the PCSA database.
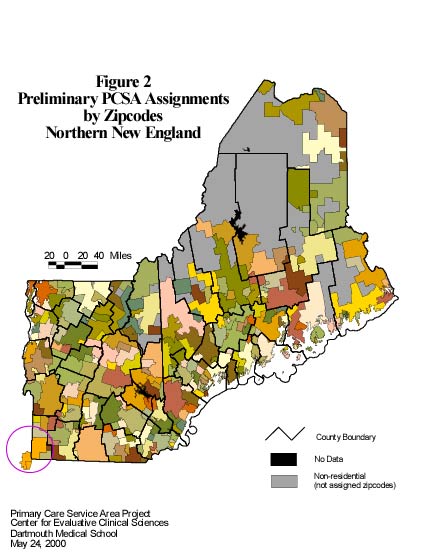
Figure 2 shows a preliminary ArcView generated PCSA map for Northern New England: Vermont, New Hampshire and Maine. Colors of the PCSA shapes are assigned randomly. County boundaries are bold black lines.
The PCSAs shown in Figure 2 are not the final assignment of zip codes to PCSAs. Our geographer has done the reassignment of zip codes using the contiguity rules. However, rules based on minimum population for zip codes and the localization of utilization have not yet been applied.
Many counties contain more that one PCSA. Grafton County, NH (the large county in the west-central part of the state) is about 80 miles from north to south and contains parts of 10 PCSAs. PCSAs that cross county boundaries and state boundaries are not uncommon. The Lebanon, NH PCSA, with it's dominant provider located in southwest Grafton county, draws patients from four counties, two in New Hampshire and two in Vermont. The PCSA located in the southwestern corner of Vermont draws patients from two zip codes in New York state. As stated earlier, state and county boundaries are unrelated to the use health care resources.
2. Distribution by CD
CDs are one method of distribution under consideration. CDs containing a copy of ArcExplorer (2?) together with a large number of shape files of selected areas and varying resolution could be provided to users. There would be about 5000-7000 features (PCSAs) included for the entire nation. Approximately 50 attributes would be included for each. With a sufficient number of shape files on the CD, a user could view and perform some analysis on national data as well as more local data.
3. Distribution via the Internet
The pre-release version of ArcIMS 3 has been under beta test by the PCSA project. Focus has been on use of the HTML viewer with an Image Service and the Java Custom viewer with a Feature Service. These two options clearly demonstrate the need for minimizing the transmission of data over the internet. Viewing an Image Service with the HTML viewer results in a very fast download over an Ethernet local area network. Viewing with a 56KB modem over a relatively congested link on the internet is tolerable. Using the Java Custom viewer where a great deal more data are transmitted to the client results in much, much slower display of the maps although the GIS tools available to the client are much better. Tests were conducted with .shp files of the order of 350KB. This level of experimentation has convinced us that Internet distribution of a high resolution map for the entire United States is impractical.
Our thinking at the moment is to thin the PCSA polygons for the entire nation and project them so they look appropriate for the lower 48 states. Such a map is still slow to download for the Java Custom viewer. We are exploring the possibility of selecting a subset of PCSAs and reprojecting the selection as a means of redrawing the map when a user zooms in to areas as small as a county. This is clearly a challenge to program and to make run fast enough as to not impact server performance.
4. Use of ArcInfo 8, ArcObjects, and ArcSDE 8 to build and maintain the database
Using ArcObjects, one can program extensions to ArcInfo 8 that, given suitable parameters, can select a subset of features from a map together with their attributes and reproject the map for storage in an ArcSDE database. The objects comprising ArcCatalog and ArcToolbox have these capabilities. Our experimentation in the near future will test whether these extensions can be adapted for use with SQLServer 7 in a way that clients can smoothly and quickly zoom into small regions when operating over the Internet.
H. Conclusion
The PCSA project is an ambitious undertaking. Huge amounts of data are involved in creating the PCSA polygons as well as the utilization data linked to those polygons. Targeted users of these data typically have limited financial resources. The project has an obligation to develop a variety of distribution strategies that appear to users as having little cost. The Esri product line has meshed well into the project. Although the project does not push the envelope on any particular Esri product it does make use of a rather complete collection of products.
References
1. Committee on Cost of Medical Care. Medical Care for the American People, Final Report. Chicago: University of Chicago Press; 1932.
2. Starfield B. Primary Care: Balancing Health Needs, Services, and Technology. New York: Oxford University Press; 1998.
3. Randolph L, Seidman B, Pasko T. Physician Characteristics and Distribution in the U.S. 1995-96 ed. Chicago, IL: American Medical Association; 1996.
4. Goodman D, Barff R, Fisher E. Geographic barriers to child health services in rural Northern New England: 1980 to 1989. J Rural Health. 1992;8:106-113.
5. Bureau of Health Professions. Area Resource File. QRS, Inc.; 1999.
6. Garnick D, Luft H, Robinson J, Tetreault J. Appropriate measures of hospital market areas. Health Services Research. 1987;22:69-89.
7. Ricketts T, Savitz L, Gesler W, Osborne D. Geographic Methods for Health Services Research. Lantham, MD: Univeristy Press of America, Inc.; 1994.
8. Griffith J. Quantitative Techniques for Hospital Planning and Control. Lexington, MA: Lexington Books; 1972.
9. Wennberg J, Gittelsohn A. Small area variations in health care delivery. Science. 1973;182:1102-1108.
10. Wennberg J, Cooper M (series editors). The Dartmouth Atlas of Health Care in the United States. Chicago, IL: American Hospital Association; 1996.
11. Wennberg J, Cooper M (series editors). The Dartmouth Atlas of Health Care - 1998. 2nd ed. Chicago, IL: American Hospital Association; 1997.
12. Wennberg J, Cooper M (series editors). The Quality of Medical Care in the United States: A Report on the Medicare Program. The Dartmouth Atlas of Health Care in the United States 1999. 3rd ed. Chicago, IL: American Hospital Association; 1999.
13. Wennberg J, Gittelsohn A. A Small Area Approach to the Analysis of Health System Performance (HRP-0102101). Washington, DC: U.S. Dept of Health and Human Services; 1980.