James Heald
Developing a National GIS Data Layer for Agriculture
One County at a Time
The
USDA Farm Service Agency (FSA), along with partner agencies Rural Development
and the Natural Resource Conservation Service (NRCS), is in the process of implementing
desktop GIS at over 2500 field service center locations nationwide. Ultimately, the GIS resources for the Agency
will be managed in a distributed database environment.
The
most critical component in the successful implementation of GIS for FSA is
development of the Common Land Unit (CLU) data layer. The Common Land Unit layer will ultimately include all farm
fields, range land, and pasture land in the United States. Data is currently maintained at the service
centers with annotations on hardcopy aerial photography. In conjunction with digital imagery and
other data, FSA will use the Common Land Unit to manage Farm Service Programs,
monitor compliance, and respond to natural disasters, among other tasks.
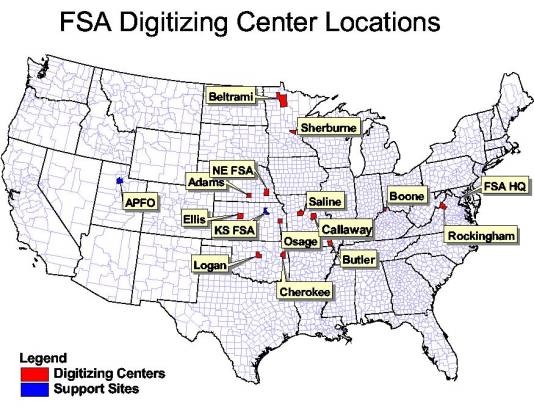
Due to funding constraints and the need to build support for GIS within FSA, we have had to start slowly, building momentum and developing data and pilot applications in parallel to show results quickly. Phase One of the data development was the creation of 12 digitizing centers at field office locations in seven states. These offices are developing the CLU data layer with on-screen digitizing using Arcview in a Windows NT environment. Customized digitizing and quality control extensions were written for the project.
Pending
budget approval, future developments will include a program of outsourcing data
production, developing new digitizing centers, upgrading the software
environment, and distributing the completed data sets to field service centers
with training and tools to maintain the data.
This presentation will discuss the current progress for this effort,
methodology, standards, lessons learned, and future directions.
Background
The
USDA Farm Service Agency (FSA), along with partner agencies Rural Development
and the Natural Resource Conservation Service, is in the process of
implementing desktop GIS at over 2500 field service center locations
nationwide. Ultimately, the GIS
resources for the Agency will be managed in a distributed database environment.
As with many public agencies, “the majority of FSA’s business data is
geo-spatial in nature, or referenced to geographic locations (i.e., land
records, field locations, soil types, etc.).
The ability to manage this data efficiently and effectively as we move
into the next century is essential.”[i] A report done in 1996 estimated that roughly
one-third of FSA’s business directly involved using and maintaining maps and
geospatial information. In those areas,
it was estimated that FSA could save approximately 42 percent of its costs by
integrating GIS into business processes.
The
most critical component in the successful implementation of GIS for FSA is
development of the Common Land Unit (CLU) data layer. The Common Land Unit layer will ultimately include all farm
fields, range land, and pasture land in the United States. Data is currently maintained at the service
centers with annotations on hardcopy aerial photography. In conjunction with digital imagery and
other data, FSA will use the Common Land Unit to manage Farm Service Programs,
monitor compliance, and respond to natural disasters, among other tasks.
Due
to funding constraints and the need to build support for GIS within FSA, we
have had to start slowly, building momentum and developing data and pilot
applications in parallel to show results quickly. Phase One of the data development was the creation of 12
digitizing centers at field office locations in seven states. These offices are developing the CLU data
layer with on-screen digitizing using Arcview in a Windows NT environment. FSA wrote customized digitizing and quality
control extensions for the project.
Additional extensions to support FSA program needs are being developed
as needed.
Challenges
FSA
faces a number of challenges in developing the Common Land Unit layer. First is the sheer size of the task. FSA needs to map all of the farm fields in
the country, or at least all the fields involved in agency programs. Second, the data is constantly
changing. Therefore, it needs to be put
in a maintenance program as soon as initial digitizing is completed. Also, FSA needs to be able to maintain
tabular and geospatial time-series information. Lastly, we have security and privacy issues. Farm and disaster payments are directly tied
to acreage and the crops reported by producers.
Mapping all the Farm Fields in the Country
The Farm Service Agency (FSA) currently maintains records for about 2 million Farms, comprised of about 16 million fields. Map data is maintained manually on hard copy aerial photographs at more than 2500 local service centers. Tabular data is currently maintained on a System 36 mini-computer at these same local offices. Some of the tabular data is uploaded to a central mainframe computer. These legacy systems employ thousands of lines of Cobol code and utilize hundreds of VSAM files.
Because map data is manually maintained at a large number of sites, the quality of source material available for transfer to GIS varies considerably. Historically, as new NAPP photography became available, new hard copy photography was prepared and printed by FSA’s Aerial Photography Field Office (APFO) in Salt Lake City and shipped to the service centers. Employees at the service center were then tasked with transferring their line work and annotations from the old maps to the new maps. Depending on the county, this has been a massive job. For example, Kings County, California has over 1150 map sheets. Given other work demands, the maps have not always been transferred to the latest photography.
Standards for maintaining the hard copy maps exist, but the standards are somewhat flexible. In part, this has probably been done to alleviate some of the burden of maintaining the maps. However, local variations in source material will make it more challenging to contract out the digitizing.
In addition, because the maps are critical to conducting business at the service centers, the staff is very reluctant to part with them, particularly for more than a couple of days. FSA is currently testing out a process for scanning the source documents at APFO. Scanning can be completed within several days and the original source materials can be returned to the service center. Scans would be made available to contractors or digitizing centers in either hard copy or digital format.
Dynamic Data
Farm and field boundaries change
constantly. Tree stands are cleared to
create new common land units. Farmland
is sold and subdivided for development and common land units disappear. Ownership and producer relationships
change. Depending on the growing
season, crop data and planting patterns change one or more times a year.
The
Minnesota State office has estimated that, in a typical county, there are
between 1200 and 2400 map changes per year.
Workload for these changes is not spread out conveniently throughout the
year, but is tied to program signup deadlines, annual acreage reporting, and
compliance verification cycles.
As a result, FSA cannot simply digitize the
field information for the County and let the data sit on a shelf somewhere
until computer hardware, GIS software, and applications are delivered to the
counties. Maintenance is crucial and
development of the data layer must coincide with delivery of hardware, software
and applications.
In order to properly administer farm
programs, FSA is required to maintain time-series information on both attribute
and geospatial data. Eligibility for
certain farm programs and disaster payments is dependent upon the historical
use of land parcels. For example, land
is not eligible to be enrolled in the Conservation Reserve Program unless it
has been farmed in 2 of the 5 most recent crop seasons. Disaster programs are sometimes initiated
for past years.
Security
FSA is responsible for billions of dollars
in loans, farm payments, and disaster assistance. In 1999, Market Loss Assistance Payments totaled over $5.4
billion to over 1 million producers. In
1998, Crop Loss Disaster Assistance totaled over $1.9 billion. These payments
are directly tied to what happens on the land and acreage reported by
producers. Therefore, the GIS data
layer needs to have an acceptable level of accuracy. For many years, FSA has determined field acreage and producers
have accepted these measurements. There
is some discomfort within the agency that GIS acreages will deviate too much
from the historical acreage and cause problems with producers. One way to ease this problem is to work with
producers to make sure that they agree with where boundary lines are drawn. Currently, digitizing specifications require
all boundary lines to be within 3 pixels of a feature on the DOQ. In addition, any changes to the data need
to meet strict auditing requirements.
When the system is fully implemented, FSA needs to be able to track who
made changes, when they were made, and why they were made. FSA also needs to protect the
confidentiality of any sensitive tabular data joined to the GIS data layer.
Budget
Creating and maintaining a farm field layer
for the entire country is an expensive proposition. Estimates have ranged from $16 million to $45 million just to
create the initial data layer, excluding preparation and distribution costs for
managing DOQ imagery. Because this
particular data layer becomes obsolete quickly, software and tools need to be
deployed to a large number of sites to ensure maintenance. While there appears to be broad agreement
that this layer is critical to redesigning farm program delivery, very little
of this has been included in the FSA budget up to this point.
Creating the Common Land Unit Layer
FSA
and its partner agency NRCS have been struggling with implementing the Common
Land Unit layer for almost a decade.
The first pilot program to integrate GIS in the service center workflow
began in 1991. This and subsequent
pilot programs verified that implementing GIS in local service centers would
dramatically reduce workload and improve the quality and consistency of
delivered services. Finally, in 1998
nine pilot sites were equipped as part of a Service Center Implementation
program and Common Land Unit layers were developed for these sites. FSA contracted out most of the digitizing
for the nine sites to private contractors.
At the
end of FY 1998, funding was obtained to establish 12 digitizing centers in
seven states. The State Directors from
Kansas, Minnesota, Nebraska, and Missouri lobbied the Farm Program
Administrator to get GIS implemented in their states and proposed setting up
two digitizing centers in each state.
The Farm Program Administrator agreed to implement the program, but
added an eastern state, Virginia, and a tobacco state, Kentucky. Oklahoma was later added to the program
because of issues involving the Cherokee nation. The State offices selected the digitizing sites and most were
established in local service centers.
These
sites were equipped with Windows NT servers and between one and four additional
workstations. The GIS software chosen
for use at the centers was Arcview.
Hardware and software were ordered in December 1998. Hardware and software were installed starting in March 1999. Training began in March and the first site
was operational in April. Deployment
and training continued through May. A
thirteenth site (Callaway County, Missouri) was added in January 2000. Callaway County had been part of an earlier
GIS pilot program and had been doing digitizing and other GIS projects using
Arc/Info in a Unix environment.
The initial proposal to develop the Common
Land Unit data layer outlined a process to transfer data from the hard copy
maps using heads-up (on screen) digitizing on a Digital Orthophoto Quad
base. FSA’s Aerial Photography Field
Office is responsible for delivering the DOQ to the digitizing centers. FSA made a policy decision to mosaic the DOQ
to create seamless County images, because image quality and edge matching
problems made the raw DOQ unacceptable as a base map for this project. As a result, APFO checks every single DOQQ
(USGS only checks 10 percent). APFO has found that approximately 8 percent of
the quarter quads have problems: for example, they don’t meet National Map
Accuracy Standards, they are projected in the wrong UTM zone, or they contain
the wrong photograph. The mosaics are
tone balanced and most common DOQ edge-matching problems are eliminated. Seam lines are also adjusted so seams do not
divide farm fields. Currently, APFO is
delivering full resolution TIF files tiled by quad boundary and a County Mosaic
in MrSid compressed format. Digitizing
is only done using the full resolution images.
The MrSid files are used mostly for quick viewing of data.
With current staffing levels and hardware,
APFO is only able to mosaic about 200-250 counties per year. In order to meet development targets, this
production level will need to be at least doubled over the next couple of
years.
With over 2500 county offices nationwide,
FSA has had to establish data development priorities for each state. Each State Office, in cooperation with our
partner agency NRCS, developed a priority list. Factors considered by FSA in developing the list were; 1)
workload, 2) availability of DOQ, 3) agricultural land and crop production
levels, 4) expertise and adaptability of the county office staff, and 5)
availability of Digital Soil data. The
digitizing centers began by working on data for their own states. The next phase of the project, starting this
summer, will be to begin digitizing top priority counties from other states.
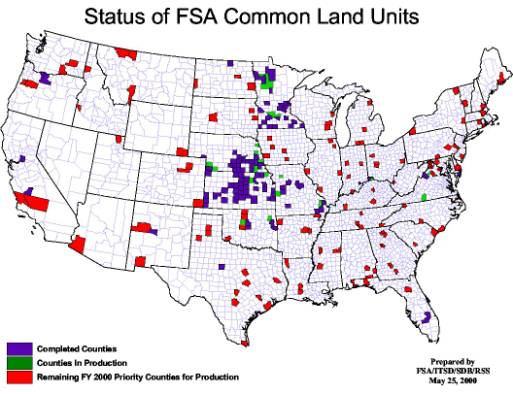
As of May 1, 2000, initial digitizing has
been completed for 106 counties. We
estimate the digitizing centers will complete another 8-10 counties every
month. At the present time, only about
20 counties, in addition to the digitizing centers, have the hardware and
software to maintain their land units.
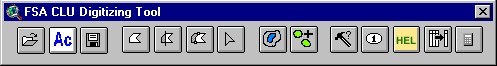
Tools
Arcview,
out of the box, includes most of the functions needed for creating data. However, it was necessary to extend and
customize the interface to reduce manual setup time and ensure data and procedural
consistency between the sites. The
funding obtained for this project did not include a budget for software
development. FSA staff did the original
Avenue programming to customize tools for the digitizing project.
Features of the original digitizing
extension included the following features:
q
Floating tool bar
q
File creation with defined attributes
q
Scale limitation on editing (1:4800 or
smaller)
q
Feature editing with some topological
checking
q
Automatic acreage calculation when features
are edited
q
Tools for creating inclusions (polygon
subtraction) and to streamline the process of combining polygons
q
Attribute editing through dialog boxes
Subsequent updates to the digitizing tools
corrected problems, particularly to reduce problems with segmentation
violations and file corruption, and added new functionality, including:
q
Integrated Quality Control tools
q
Checks Overlaps, Voids, Slivers, Multi-part
polygons
q
Automated Map Layout creation
q
Multi-attribute polygon labeling
q
A simplified search routine
q
Farm, Tract, and Field number search
q
Public Land Survey Township, Range, Section
search
Again, most of this functionality was developed in-house. However, some of the functionality was
adapted from user scripts downloaded from the Esri site. In particular, the shape check and
correction program developed by Andrew Williamson has been a lifesaver on
numerous occasions.
Where the files are being maintained, most
sites are currently using FSA’s standard digitizing extension. A more user-friendly maintenance tool has
been developed and is undergoing final testing. This tool is very similar to the digitizing extension, but
includes stronger data validation and some additional tools. The maintenance tool also forces attribute
data entry when polygons are added or edited.
Ensuring the Transition to GIS
Over the last several months, it has become
increasingly apparent that the only way to ensure a successful transition to
GIS is to eliminate any need for the hard copy maps. Among several problems with initial data modeling efforts was the
failure to include all of the data elements in the CLU table that are currently
being captured on the hard copy maps.
Tools are currently in development to allow service centers to capture these
additional data items and link them to the basic CLU data file. The bottom line is that no matter how
inherently useful the data, applications for making use of the data are
necessary to ensure use.
One of the major hurdles to eliminating the
hard copy maps involves the farm program compliance process. Every growing season, producers report their
growing intentions (crops and acreage) to FSA at the field and sub-field
level. At the peak of the growing
season, most county offices have 35mm aerial color photography flown. They receive this photography as
slides. Computer programs on the System
36 legacy system generate a random sample of farms, which are to be checked for
compliance. The appropriate slides are
inserted into a projector attached to a planimeter and manually rectified to
the hard copy maps. Field and sub-field
boundaries are measured and compared to the reported acreage.
We have distributed Arcview Image Analysis
software to four of the digitizing centers and they are rectifying digital
copies of the slides to the DOQ. One
county in Minnesota did a test by redoing their compliance from 1999 using
rectified 35mm slides and the digitizing tools to measure compliance with farm
programs. Measurement differences
between GIS and the planimeter were within an acceptable tolerance (generally
less than 5 percent) and the Compliance process took about 15 days (including
slide rectification) instead of 30 days using current manual methods.
Minnesota is aggressively pursuing a
strategy of doing digital compliance in all counties where hardware, software
and data are available. That could be
as many as 20-30 counties in FY 2000, although funding delays may significantly
reduce that number. We are also
planning to pilot a program of contracting out the rectification and mosaicking
of 35mm slides to create countywide seamless images that match the county DOQ
mosaics created by APFO.
FSA is currently developing a more automated
process for compliance, which will include sharing data with the System 36 to
eliminate as much data entry as possible.
This process will take the Farm Sample list generated by the System 36
and automatically select Common Land Units, based on the farm number, and copy
them to a compliance layer. Where
necessary, sub-fields will be added to the layer based on the 35mm
photography. The acreage will be
generated for each field and sub-field automatically by the tools.
Another data set from the System 36 legacy
system, containing the reported acreage and crop information will be linked to
this compliance layer, allowing comparison of reported and actual acreage. Visual interpretation will be needed to
verify that the reported and actual crop types are the same. The generated acreage will then be fed back
into the System 36. Where farms are out
of compliance, a map will be generated using a predefined template and a
notification letter will be generated using existing software. FSA is also planning to cut out countywide
sections of Landsat TM data to send to our compliance sites during the growing
season to see how this might aid them.
Use of these new tools and digital datasets should further reduce the
amount of time taken by the compliance process, while improving consistency,
and creating a permanent digital record of compliance activities.
It is important to note here that the System
36 is a legacy environment and that any applications developed to tap into its
data resources are interim applications.
Recently, the manufacturer withdrew its maintenance support for the
platform, making it essential for FSA to move more quickly towards a permanent
solution. However, it is our belief
that it will take at least several years to replace these applications with
fully re-engineered database products.
Moving forward with interim solutions, which have the potential to
significantly reduce manual workload and improve customer service, appears to
be well worth the effort.
Lessons Learned
In addition to the data that has been
created, digitizing centers have been very valuable for increasing the GIS
literacy within FSA. The centers have
become a fertile laboratory for generating ideas on how to transfer FSA program
functions from manual and outdated automated technology to GIS. Staff from the centers also have developed
the capacity to train employees at nearby counties and can fulfill a “help
desk” function for common problems.
These side benefits could be a major factor in recommending expansion
for the program.
Larger digitizing centers appear to work
better than smaller ones. Sites with
four workstations are significantly more productive than sites with only two
digitizing stations. They also seem to
place fewer trouble calls and have less staffing turnover problems.
Support from the State office is also very
important. Sites with strong State
office involvement are more successful.
The four states that originally proposed the project have been more
successful than the other three states.
They were up and running faster and have had fewer overall problems.
Access to other sources of local support,
such as universities, also enhances the success of the digitizing centers. Universities can help as both GIS resources
and sources of temporary staff for the digitizing centers. At least half of the digitizing centers
have some kind of relationship with local universities and community
colleges. FSA is currently talking with
a number of universities and, if funding becomes available, will actively
pursue formal partnerships.
However, in-house digitizing centers are, at
best, only a part of the solution to developing the Common Land Unit. The job is too big and FSA is not really
interested in being in the digitizing business. Even if FSA doubles the number of digitizing centers it will not
finish the CLU layer for the entire country for about 10 years at the current
rate of production. It would be advantageous to accelerate the program by
contracting out digitizing for at least 500 counties over the next two
years. If we can get budget
commitments, we will be contracting out as much digitizing as we can manage
over the next several years.
On a regular basis, we become aware of other
groups – federal, state, and local – who are digitizing farm field boundaries
for their own purposes. FSA needs to
find ways to develop partnerships with these other groups to effectively pool
our resources to ensure the sharing of data and applications.
We are also aware of projects going on
within FSA and our partner Agencies to digitize field boundaries outside the
umbrella of this project. Our biggest
concern about these projects is that they will not meet the standards developed
for the national program. It would be a
shame if they could not take advantage of tools that we are developing, but I
can certainly understand their frustration with how slowly the wheels seem to
be turning at the national level.
As indicated previously, maintenance is
critical to the CLU development process.
By the end of FY 2000, FSA will need to deploy Arcview, maintenance tools,
and hardware upgrades (additional disk space is crucial for the imagery) to as
many as 160 sites to keep the data from becoming obsolete. If we increase production, either with
additional digitizing centers or by outsourcing, we increase the need to deploy
maintenance hardware and software. We
also put pressure on our operations at APFO to mosaic and distribute DOQ.
In order to keep up with production, FSA
will need to find a cheaper and easier way to deliver maintenance tools and
other related functionality. One way we
have looked at and will look at more closely in the coming months is using
ArcIMS to deliver applications. Limited
bandwidth probably precludes delivering data over the web to some of our
service centers, at least in the short-term, but we might be able to use the
Internet as a software delivery mechanism.
Maintaining this data as shape files also
presents challenges, but appears to be unavoidable in the short term. One problem that we have already had at
numerous sites is getting staff to understand that more than one person cannot
edit a shape file at the same time.
Another problem is that current data for the counties will not be
readily accessible at either the State or National level. One way that FSA can solve these problems is
by managing the CLU in a distributed database environment.
FSA and the partner agencies are currently
evaluating database software and hardware systems to replace the System 36 and
our other legacy systems. Using SDE and
an Enterprise Database System will allow us to develop seamless, integrated
applications utilizing GIS as the front-end.
Database versioning may be a solution to the problem of managing
time-series information such as our annual compliance layer. But this may be a very costly solution
implemented nationwide.
Future Developments
Obviously, FSA has a long way to go before all farm fields in the country are digitized and GIS is fully deployed at all of our Service centers nationwide. Without additional funding, we will have completed the digital layer for 180-200 counties by the end of the year. But FSA currently does not have the budget to deploy Arcview in all of those counties. If we do not find additional funds soon, the data will not be maintained and will eventually become obsolete.
For the current fiscal year, FSA has
requested a supplemental budget appropriation for a number of projects,
including the Common Land Unit project.
With regard to CLU, the following areas are covered in this budget
request:
q
Contract digitizing for about 200 additional
counties
q
Hardware and Software for Maintenance sites
q
Hardware and Software for 10 new Digitizing
Centers
q
Hardware and Software for Image Processing
at APFO
q
Software development and Research and Development
Future funding for a project of this
magnitude is always in jeopardy and FSA needs to develop a more coherent
strategy for meeting the funding needs of this project. As GIS practitioners, our first priority has
been getting GIS software and tools to those counties where we have completed
the basic data layer. Our second
priority, in concert with departmental reengineering efforts, has been
prototyping software to meet FSA program needs in the field. Both of these will allow us to better
showcase the benefits of GIS on field operations and highlight the time and
budget savings that GIS can generate.