The Integration of GIS with 3D / Animation Software for Presentations to Local Government
Scott E. Dickison
Louie T. Greenwell
Abstract
Recently, FMSM Engineers has been involved in the development of presentations for local governments and other municipal organizations using large quantities of spatial data. A three-dimensional approach was used to illustrate several of the spatial issues rather than the traditional two-dimensional (map) approach. It was found that in presentations to local governments a greater understanding of the spatial issues was achieved when 3D/animations were used. Through the integration of GIS technology with 3D/animation software, a more effective presentation can be prepared. This paper addresses that preparation and illustrates the smooth integration of GIS with 3D/animation Software.
Introduction
FMSM Engineers has been tasked by various government agencies with the preparation of three-dimensional (3D) animations for use in their internal presentations and their presentations to local governments. The United States Army Corps of Engineers, Huntington District, is developing a flood protection plan for the city of Marlinton, West Virginia. Marlinton lies at the confluence of the Greenbrier River and Knapp Creek and has a history of severe flooding. The Corps asked FMSM to produce two flyby animations. One animation details the existing conditions at Marlinton and the other details the proposed flood protection measures.
This paper addresses the preparation of the existing conditions flyby animation and shows the integration of GIS with 3D/animation software. The 3D/Animation software packages used in the creation of these flybys are the World Construction Set (WCS) by 3D Nature and 3D Studio Max (3DSMax) by Kinetix. The GIS software used was ARC/INFO 7.2.1 and ArcView 3.2 by Environmental Research Systems Institute.
Steps of Preparation for the Marlinton Existing Conditions Flyby
There are several steps involved in the creation of a three dimensional animation. The Digital Elevation Model (DEM) must be prepared for import into WCS. In the case of the Marlinton existing conditions flyby the DEM, was developed from an ARC/INFO GRID. This GRID was a combination of data provided by the Corps of Engineers for the detailed study area and two USGS 7.5 minute DEM�s. A Triangulated Irregular Network (TIN) of the detailed study area was generated with contours and spot elevations. The, the TIN was then converted to a GRID within ARC/INFO and merged with two USGS 7.5 minute DEM�s to provide terrain outside of the detailed study area. The GRID was converted into an ASCII GRID using ARC/INFO for import into WCS.
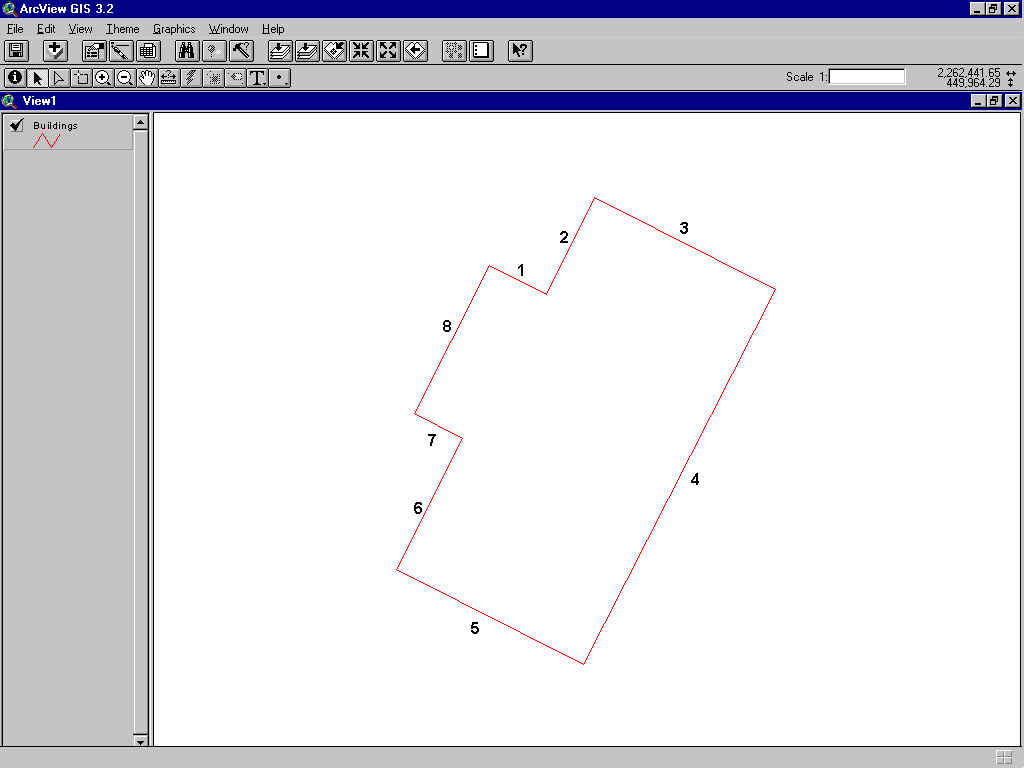
The 3D objects were created using WCS and 3DSMax. The building footprints were first separated into individual polygon shapefiles using ArcView 3.2. During this process each building footprint polygon was assigned an unique identifier. Next, using an ARC/INFO 7.2.1. AML, the building footprint polygons were imported as lines and were densified. These resulted in the arcs being assigned an ID and sequenced as shown in Figure 1.
Figure 1: Arc ID sequencing
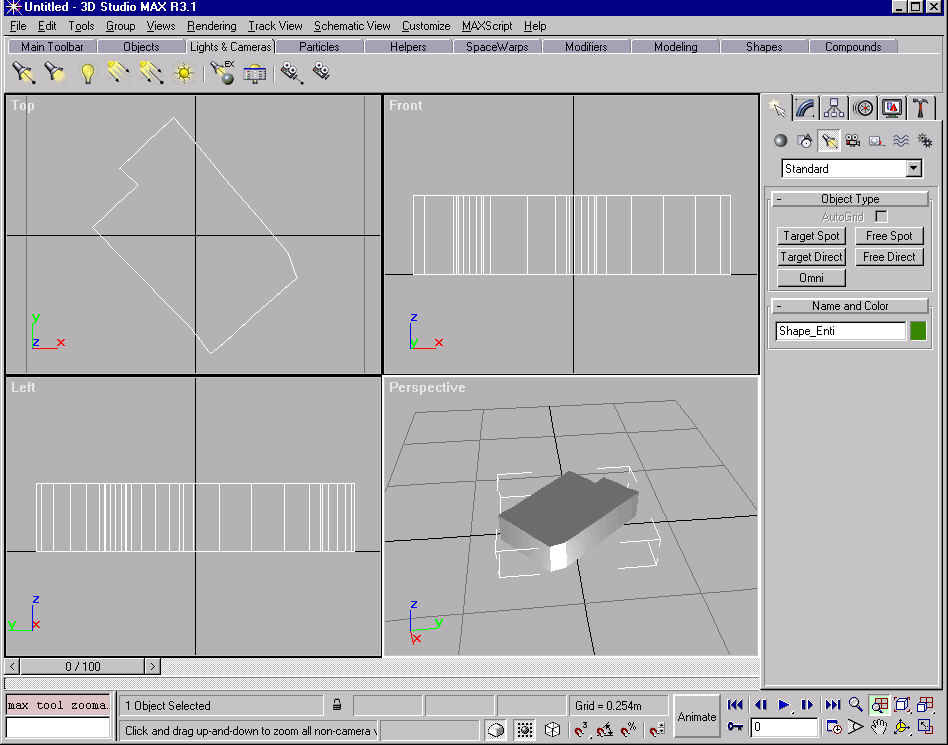
The resulting arc coverage was then projected so that its polygon label had coordinates of 0,0. This new, projected coverage was converted into a DXF file that was then imported into 3DSMax. Once in 3DSMax a script extruded the building footprint and exported this as a 3Dmax, three-dimensional object. For an example of an extruded building footprint see Figure 2. For more information on the AML or the script used to extrude the building footprints see Appendix A.
Figure 2: 3D Studio Max extruding building footprint
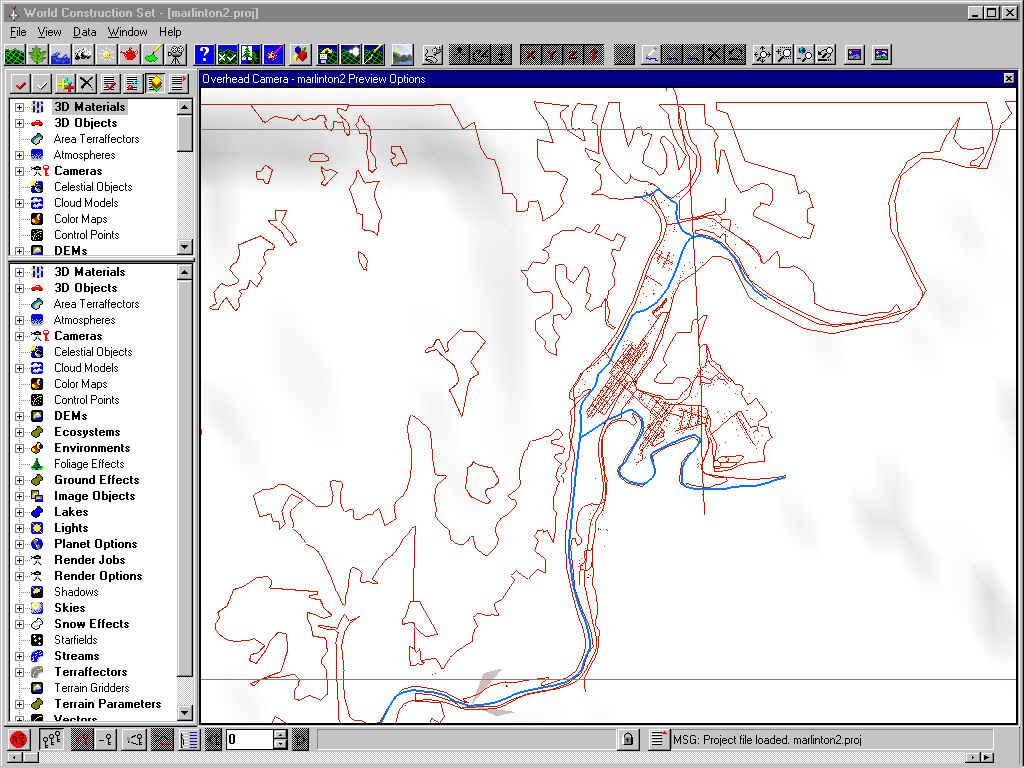
Vector data was imported into WCS. This vector data represented the points that the buildings were associated with and also the roads, streams, and foliage.
Figure 3: Vector import into World Construction Set
The fourth step is was to set up path that the camera traveled along. This was accompished by digitizing a vector over the digtial elevation model within WCS. After this arc was digitized the camera�s orientation was locked so that it was aligned to the path of travel.
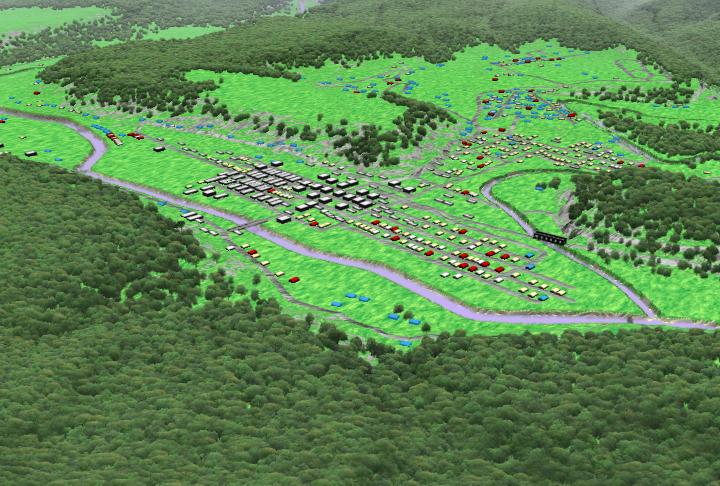
The final step is to render the animation. Render times vary based on desired level of reality and the number of three-dimensonal objects. It was noted that on a computer with an Intel Celeron 400mhz processor running Windows NT that it took two hours to render a frame that contained 880 individual 3D objects and twelve minutes to render a frame that contained only four 3D objects.
Figure 4: Example of a completed frame.
Data Issues
GIS Data Integration
There were two types of GIS data used in the development of the existing conditions flyby. The first data type was vector data. Vector data, in the form of points and lines, was used to place features on the digital elevation model. The vector data for the detailed study area came from the data provided to FMSM Engineers by the Corps of Engineers. This data was in Microstation DGN format and was converted to ARC/INFO coverages using ARC/INFO 7.2.1 Points were used to place the individual 3D objects. In the case of the Marlinton existing conditions flyby the 3D objects were the buildings and the bridges. Lines were used to define and place linear features such as roads and streams. Lines were also used to form polygons that defined areas of foliage on the DEM. To facilitate ease of integration it was necessary to insure that the vector data was projected into the Geographic projection and that the correct attributes were assigned. It was necessary in the attributing to make sure that the name of the 3d-object that was to be assigned to the individual point was present to insure association. This can be a critical point in WCS when dealing with a large number of objects. Attributes were assigned in ArcView 3.2 with an Avenue script.
Vector Data Import Formats
|
World Construction Set |
3D Studio Max |
AutoCad DXF |
AutoCad DWG |
|
Esri Shapefiles |
AutoCad DXF |
|
USGS ASCII DLG |
|
The second data type was a digital elevation model (DEM). WCS is able to handle several different formats of DEM but requires that the DEM be in the geographic projection. The other important issue is grid resolution. Smaller cell sizes generally result in better appearing DEM�s but often result in longer rendering times.
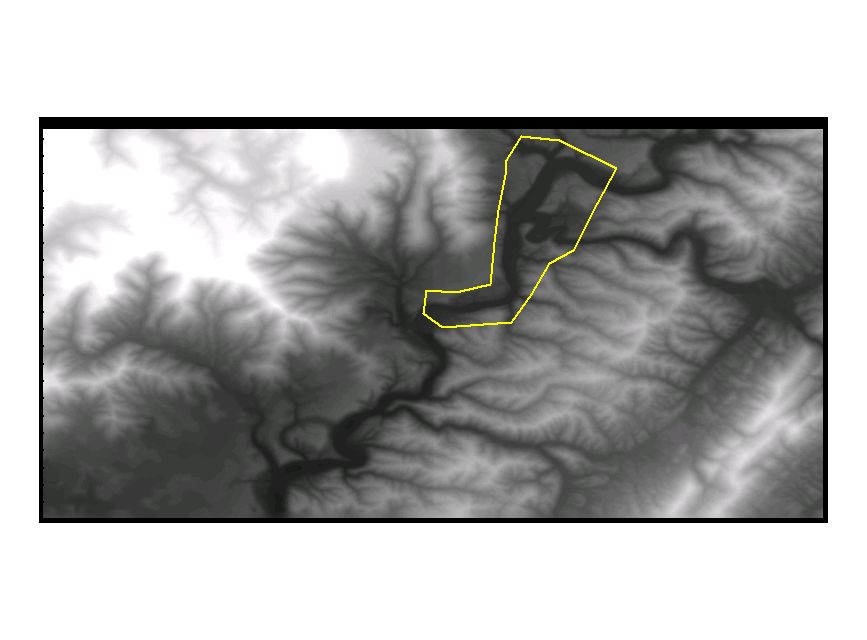
Figure 5: Digital Elevation Model for Marlinton, WV. Study area outlined in yellow.
Three Dimensional Objects
A three dimensional object is most often used to provide a realistic representation of a man-made feature but is not limited to that. In the case of the Marlinton existing conditions flyby, he building footprints were extruded to create realistically shaped buildings that were in their correct locations and had the correct orientation. The 3D objects were centered at coordinates 0,0 in "object space." Their source vectors were stored in UTM projection and had meters as the unit of measurement. The vectors were first projected so that the centers of the building footprints, represented by the polygon labels in ARC/INFO, were centered on 0,0 in UTM coordinates. This was done so that when the vectors were imported into 3DSMax they centered on 0,0 in "object space." After the objects were created it was exported back to WCS and was attached to it�s corresponding point.
Appendix A
This is the dxfbuilder.aml used to convert the shapefiles to DXF files with their arcs properly sequenced.
/***********************************************************
/* DXFBUILDER.AML
/*
/* Author(s): Scott Dickison
/*
/* Fuller, Mossbarger, Scott and May Engineers, Inc.
/* 1901 Nelson Miller Parkway
/* Louisville, KY 40223
/***********************************************************
/*
/* Program: dxfbuilder.aml
/*
/* Description: Takes a list of shapefiles supplied by an info file calld bldgslist
/* (bldgslist has a single field (name,16,16,C)) densifies the arcs so
/* they get resquenced in order, projects them so they center around
/* 0,0 and then converts them to a DXF.
/*
/* Output: A single DXF file, centered on 0,0, for every building footprint
/* in the bldgslist info file.
/*
/* Usage: &r dxfbuilder.aml
/*
/* Variables:
/*
/* Routines Called:
/*
/* Author/Revisions: Scott Dickison / 5-14-00 (original coding)
/**********************************************************
&severity &error &ignore
cursor bldgs declare bldglist info ro
cursor bldgs open
cursor bldgs first
&do &while %:bldgs.AML$NEXT%
display 0
/* Convert shapefile to line coverage
shapearc %:bldgs.name% [before %:bldgs.name% .] line
/* Densify arcs so they are resequenced in order from a start node
densifyarc [before %:bldgs.name% .] # 50 arc
copy [before %:bldgs.name% .] temp
build temp poly
createlabels temp
centroidlabels temp
&s covername = temp
arcedit
ec %covername%
ef labels
sel all
put temp2
quit
build temp2 point
arcplot
&s coords = [show select temp2 point 1 XY]
quit
&describe [before %:bldgs.name% .]
[unquote '']
/* Get coordinates of polygon label
&s xval [extract 1 %coords%]
&s yval [extract 2 %coords%]
/*
/* Projection information may change depending upon the projection of your
/* source data. This sets center of polygon to 0,0
project cover [before %:bldgs.name% .] dxfbld
input
projection utm
units meters
zone 17
datum nad83
parameters
output
projection utm
units meters
zone 17
datum nad83
xshift -%xval%
yshift -%yval%
parameters
end
/* Convert coverage to DXF file.
arcdxf [before %:bldgs.name% .].dxf dxfbld dxfbld
kill [before %:bldgs.name% .] all
kill dxfbld all
kill temp all
kill temp2 all
cursor bldgs next
&end
/**************************************************************************
This is the 3D Studio Max script that extruded the building footprints and exported them out as 3D-objects.
files = getFiles "x:\\marlinton\\covers\\dxf\\*.dxf"
for f in files do
(
resetmaxfile #noprompt
importfile f
theShapes=shapes as array
for i = 2 to theShapes.count do (addAndWeld theShapes[1] theShapes[i] .1)
max modify mode
modPanel.SetCurrentObject $
modPanel.addModToSelection (Extrude ())
$.modifiers[#Extrude].amount = 3
exportFile ("x:\\marlinton\\covers\\bldgs-3d\\"+ (getFileNameFile f) +".3ds") #noprompt
)
Author Information
Scott E. Dickison
GIS Programmer
FMSM Engineers, Inc.
1901 Nelson Miller Parkway
Louisville, KY 40223
Phone: (502)212-5030
FAX: (502)212-5055
e-mail: sdickison@fmsmengineers.com
Louie T. Greenwell
GIS Manager
FMSM Engineers, Inc.
1901 Nelson Miller Parkway
Louisville, KY 40223
Phone: (502)212-5000
FAX: (502)212-5055
e-mail: lgreenwell@fmsmengineers.com