GIS Conversion Project from Vision to Esri
Stewart Dary, GIS Manager
Orange County Property Appraisers Office
Orlando, Florida
David van Blankenstein
Safe Software Inc
Surrey, BC, Canada
June 2, 2000
Abstract
A major component of the Orange County Property Appraiser’s (OCPA’s) long-term re-engineering plan involved the conversion of its property appraisal land base from Vision to ArcInfo. This was performed in a joint venture between OCPA and Safe Software using the Feature Manipulation Engine (FME). The task was accomplished by side stepping the Vision GIS structures and hitting the underlying relational table structures directly with the FME to convert the over 4 million geometric objects cleanly into ArcInfo. Among the challenges of converting this data set was the sheer volume of data, dealing with a data set that could not be easily spatially partitioned, and cleaning and transferring the county’s critical parcel-related information. In addition, the Property Appraisers Office applied rigorous quality control and assurance procedures to ensure that all information was transferred correctly and to identify data problems on the Vision side for correction before final conversion. This paper will discuss the life cycle of the conversion and the many challenges and successes met along the way.
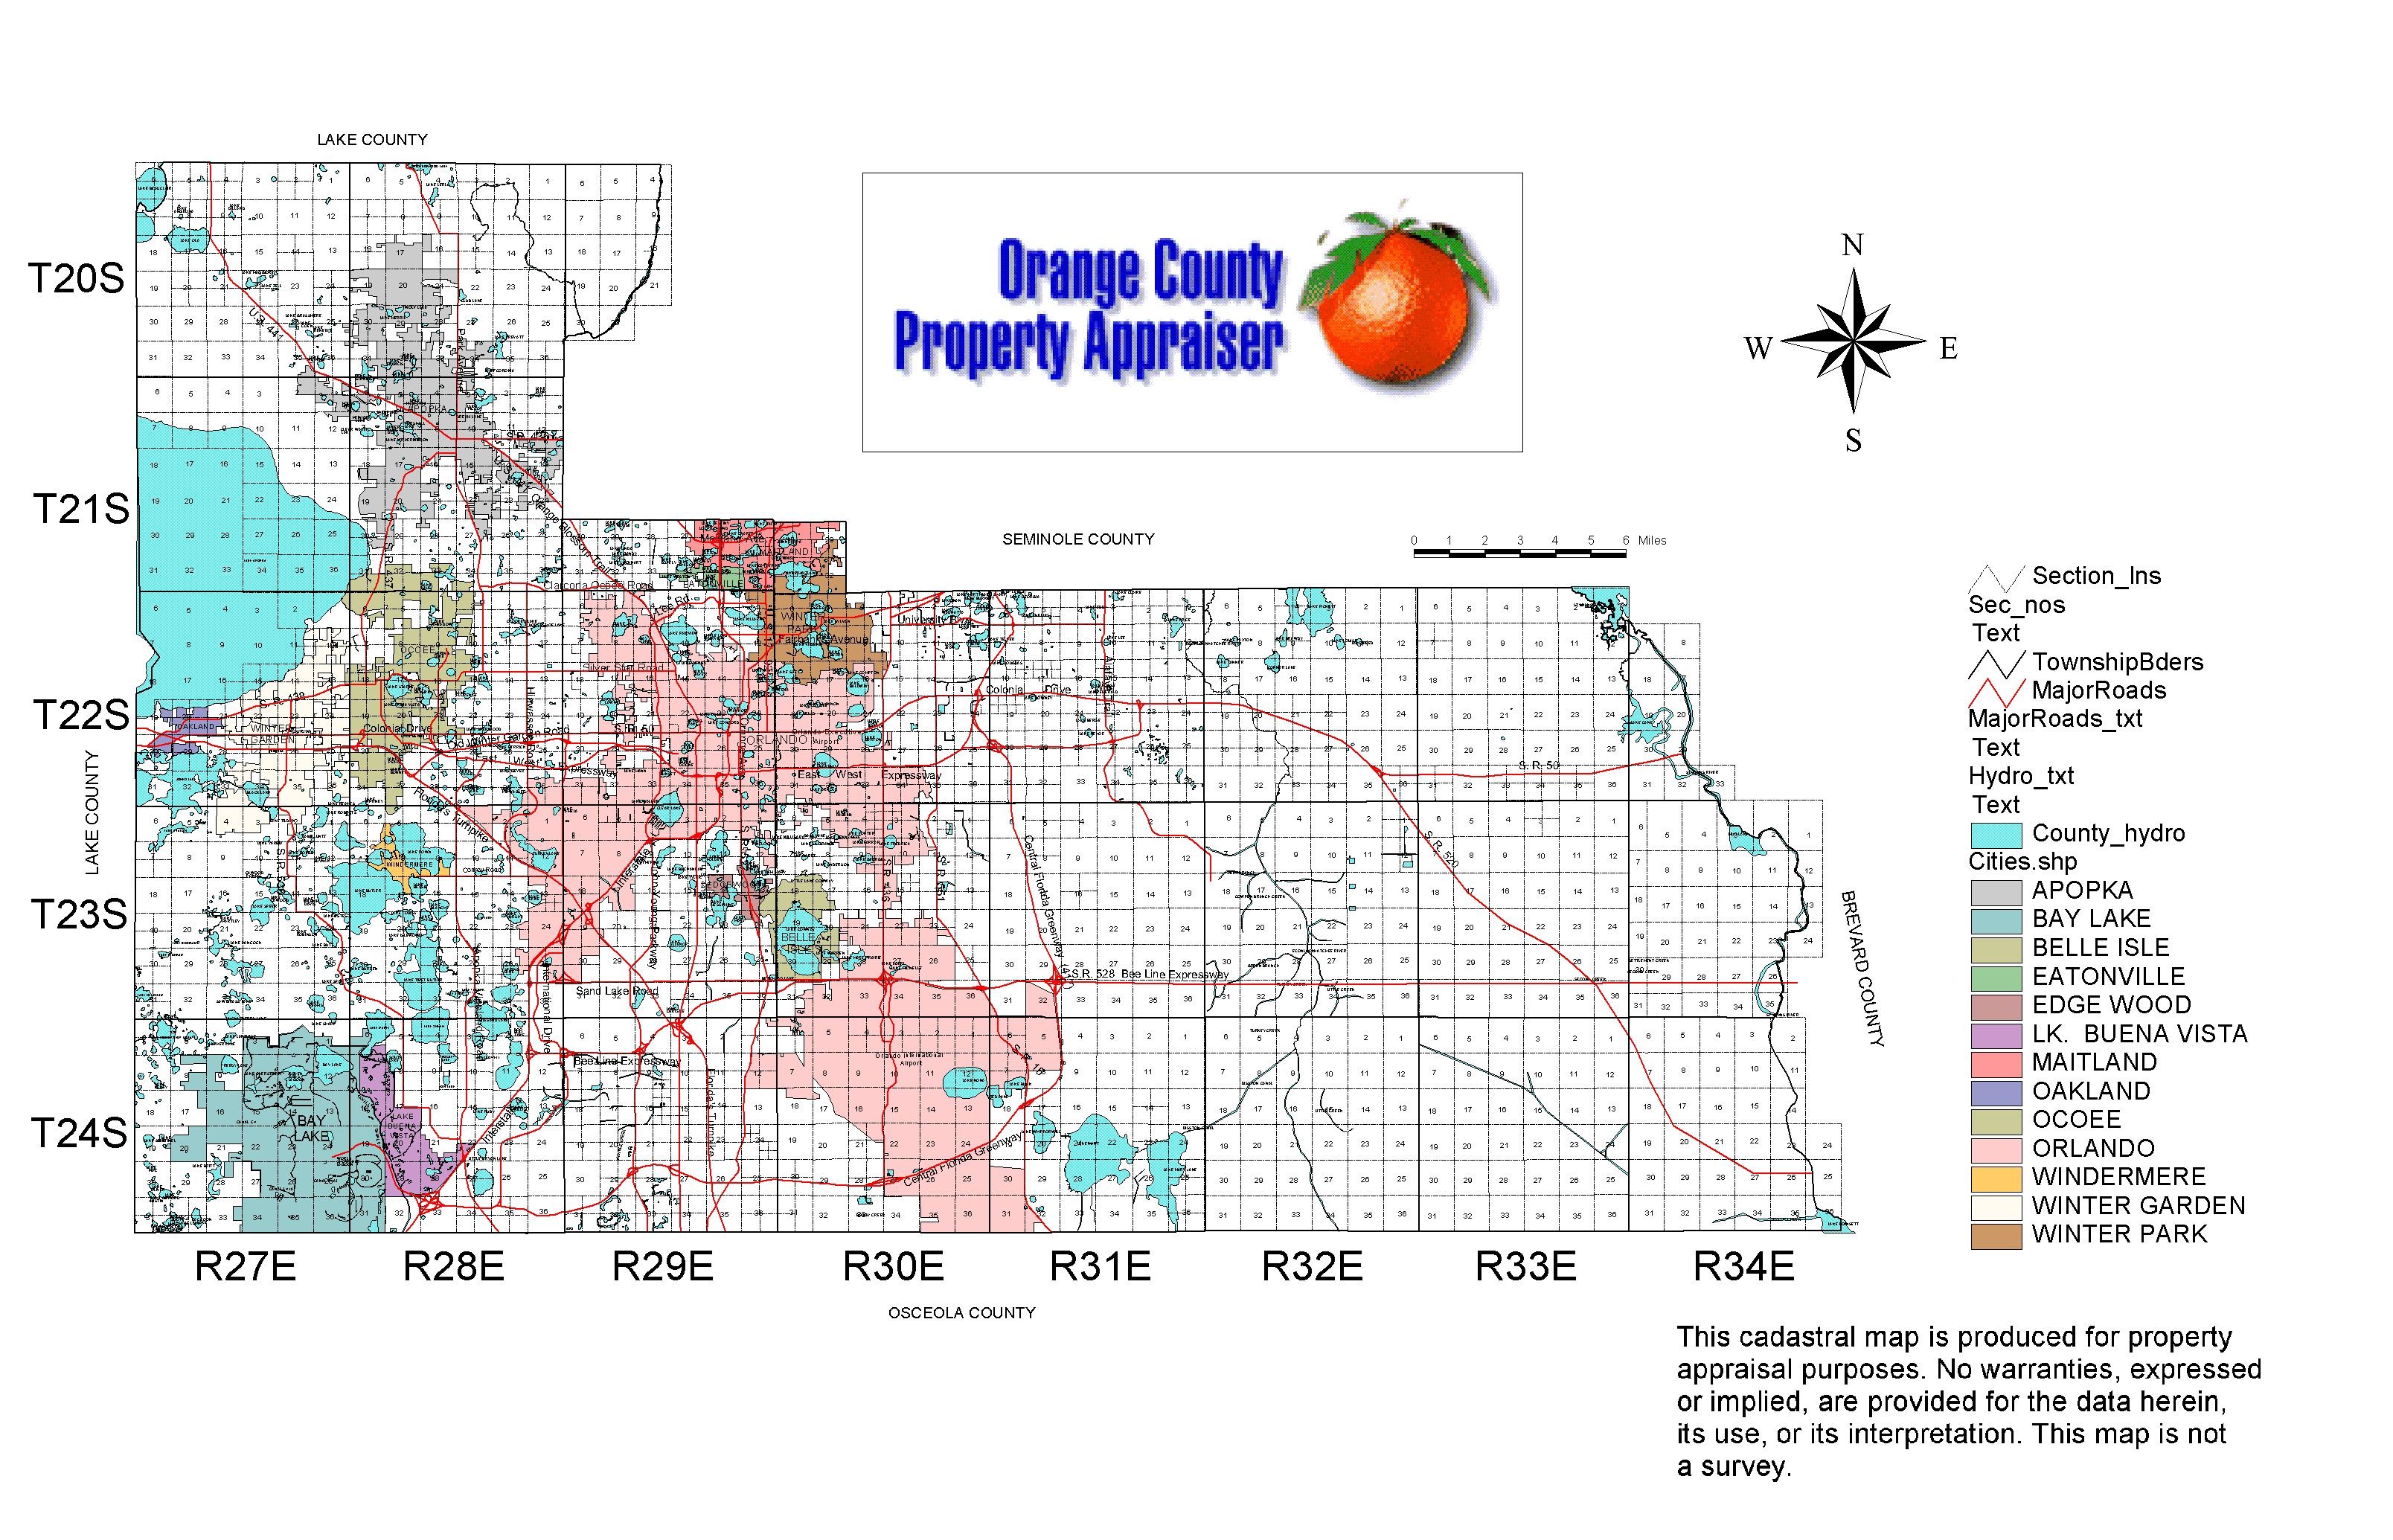
Figure 1. Orange County, Florida
Table of Contents
1.0 Introduction *
1.1 Business Case
*1.2 Implementation Plan
*1.3 Technical and Process Overview
*1.4 System Environment
*2.0 Translation from Vision to E00 *
2.1 Vision Database
*2.2 Translation by FME
*2.1 Polygon Construction
*3.0 Quality Assurance and Error Resolution 12
5.0 Conclusion 16
The Orange County Property Appraiser's (OCPA) Office resolved to convert its Geographic Information System (GIS) from Vision to the Esri data model and software products largely for two reasons:
The OCPA staff required proper tools to rapidly develop software applications to access the knowledge held in the GIS. Meanwhile, the labor market offered few candidates with Vision programming experience. Moreover, Vision did not have an "out-of-the-box," user-friendly software package for the desktop PC, an item deemed critical by the Property Appraiser. The Property Appraiser's Office determined that an easy-to-use desktop package was essential to the rapid development and distribution of sophisticated spatial analysis tools to non-programmers in the organization, one that required minimal training. Prior to the conversion, OCPA GIS users were constrained to a customized Vision application that displayed raster tax maps generated the previous evening. Access to "live" GIS data was not available. Changes to Vision map templates involved lengthy programming efforts and the Vision software provided limited topological rules, leading to data integrity issues (for example, the database contained open parcel polygons, duplicate arcs, and road centerlines that at times failed to intersect).
OCPA needed a software package from a market leader that offered an advanced data model for use with a commercial relational database management system (RDBMS) and had a full range of GIS products that could serve the spectrum of "power," "moderate," and "casual" GIS users in the organization. This point was particularly important as OCPA prepared to re-engineer its entire GIS parcel database. The database that existed in 1998 was developed in the late 1980s through a process of scanning, digitizing, and rubber sheeting. Limited survey data was available with ground control. The plan for 1999 was twofold: coordinate with Orange County and cities in the county to densify the county’s rectangular survey network to a half-mile grid, and employ coordinate geometry (COGO) procedures to enter property boundaries into the GIS using original source documents (i.e., plats and deeds). Esri offered the best software solution to accomplish these goals.
To translate the information from Vision into the Esri GIS solution, OCPA required a software tool with the following properties:
The application selected was the Feature Manipulation Engine (FMEÒ ) developed by Safe Software Inc. The FME is capable of reading directly from the source Oracle database which contained the Vision database, assembling the extracted features into consistent geometry and topology, and writing this directly into all of the Esri supported formats. This provided OCPA with an application that not only supported the translation of the source data, but also provided a powerful toolbox for identifying and resolving problems in the source database. A translation process could be defined and the conversion automated. Further, the FME currently provides a versatile data translation portal, allowing information from the new GIS database to the outside world in a range of industry standard GIS formats, such as AutoCAD DWG/DXF, MicroStation DGN, and MapInfo to name but a few.
The plan to re-engineer the parcel database required a four-step process:
Before the conversion began, OCPA staff analyzed the existing Vision data schema. Little documentation had been collected since the late 1980s. In addition, the Vision layers and "networks" had to be mapped into the desired ArcInfo coverage and feature class schema. This process was accomplished as a first step and involved both individual research and collaborative team meetings.
1.3 Technical and Process Overview
The process of translating the information out of the Vision database, into E00 files and finally into the SDE products involved three data stores and three automated and one manual process. This is shown in Figure 2.
Figure 2: Process Diagram
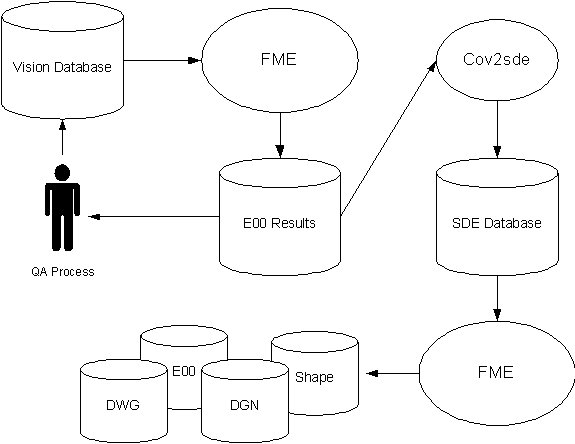
The Vision database and GIS system ran in a Solaris environment, with translations by FME being performed on both Solaris and NT. The Vision GIS processing environment consisted of application software, proprietary data stored such as symbology and annotation placement information, and an application database in Oracle. The Oracle database formed against the Vision schema contained the geometry, topology and links to business data for the county. Vision uses a network-based topology, with data distinguished and grouped by layers and networks. This is discussed in greater detail in section 2.0
After evaluating different hardware options, OCPA elected to implement a three-tiered solution. This consisted of an enterprise UNIX server supporting SDE 3.0.2 running on top of Oracle 8.0.4 to centrally store the spatial and property attribute information. An NT server functioned as a workgroup ArcInfo license manager, while NT workstation clients had ArcInfo 7.2 for data maintenance. ArcView 3.2 was used for data display and analysis. The data conversion was accomplished using FME on both the NT and UNIX servers. This two-pronged approach enabled the Office to take advantage of multiple CPUs, disk resources. This was important in consideration of the magnitude of the database.
2.0 Translation from Vision to E00
The Vision database was translated using FME for Esri, version 2.3a in both Solaris and NT environments.
There were two options for recovering this data from Vision with the FME; via GINA files (the Vision export format) or by directly accessing the Oracle schema and reconstructing the topology directly from the geometry. The latter was chosen primarily because the approach was required that would remove the need for Vision in the future (the schema can be accessed even after the Vision software has expired), and for quality assurance productivity (more robust and interactive tools where available in Esri suite of products).
A simplified version of the schema for a Vision database is shown in Figure 3. The g_master table contains a row for every feature in the database, uniquely identified by a combination of feature number, type, layer and network. This table identifies a single feature within the Vision database. Collections of features of common theme are grouped by their layer and network number from the g_master table. This query can be sub-grouped by geometry type. The types supported are point, line, polygon and node. The rows returned from the g_master (master or primary) tables are joined to the g_coord (coordinate) table by feature number. Depending on the geometric type, the join to the g_coord table is either one to one (points or nodes), or one to many (lines and polygons). The join from the g_master to the business table is always one to one, and the join to the g_label, (annotation or labeling) is one to many.
The Vision Oracle schema uses a central feature table that is classified by layers and networks. Simple and complex geometries are retrieved by selecting all coordinates for a given feature (identified by a unique integer) for a given layer-network combination using an SQL select statement against a coordinate table. Given the type of geometry (point, line, polygon or annotation) the correct FME features were constructed. Depending on the type of geometry being constructed, various topological constructions were performed by the FME. No construction was required on the point data. For linear features the detection of intersections was detected and inserted. For polygonal and donut features, intersections where detected and inserted, and invalid polygons where identified and stored separately from the valid polygons. Finally, all point, line or polygon annotation was re-constructed and placed into a text subclass. In some cases the annotation placement tools of the FME were used when the detailed placement information could not be recovered from Vision (some cases existed where annotation placement was stored by Vision in non-schema tables that were not accessible). In addition business attributes for the given feature where joined to the geometry.
Figure 3: Vision Data Model
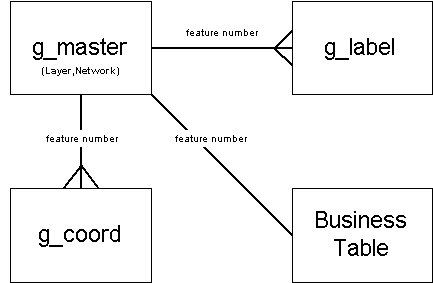
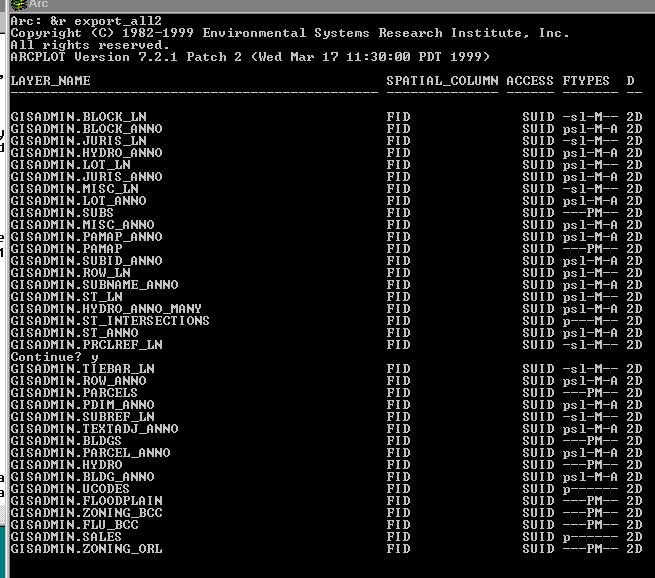
Figure 4. List Showing Separate SDE Tables for Each Major Feature Class
2.2 Translation by FME
The translation exercise for FME became a query, interpret, validate and write loop. The iteration on the loop was against each layer, network, and feature type combination. All of the data would be selected from Oracle using a multi-join SQL query. The returned data was converted into its geometric type and transformed into the correct coordinate system (a shift and scale was required to bring the Vision coordinate system into alignment with the state plane). If the geometric type had a linear component, then group and self intersection tests where performed on the lines. If the geometry type was polygonal (including donuts) then tests where performed to detect open polygons, polygons without labels and polygons with multiple labels. For the layers converted, the polygon sets either formed partitions or partitions with holes (in all cases overlapping areas where detected and resolved).
The FME drives all translations with either system generated or custom mapping files. Mapping files are ASCII text files that are interpreted by the FME at run time. Depending on the process to be custom developed, a good architecture can greatly help in development and data problem resolution.
The mapping files contains five primary components:
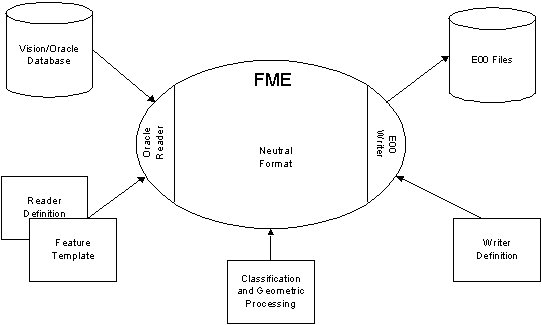
Architecturally both the reader and writer and their definitions can be replaced with other source and target formats. The real work is done in step 3, which is essentially format neutral. Figure 5 shows the flow of information through the FME as it is transformed from Vision into E00 features.
Figure 5: Data Flow through FME
For the OCPA implementation the reader definition for each table was formed from a template which applied a SQL query to the extraction of features from the database. This template was altered to fit each query for features and provided a clean and generic way of modeling the source data.
The amount of erroneous data found in linear and polygonal features in Vision was in the order of 0.01 percent. However, when in consideration of the volume of data in the set (more than 2 million) this resolves to over 20,000 features. Most of these errors were easily located and resolved. However, inconsistencies in the network based topology of the source data meant that line intersection coupled with polygon formation was required.
The largest polygonal data set is the lot layers, which is comprised of over 1,000,000 arcs and 200,000 centroids. The processing that the FME performed to insure topologically integrity prior to writing to E00 was:
The first and third operations are global, in that to correctly perform line to line intersection and polygon construction, all information on the geometry is required. You cannot divide and conquer either problem. When the entire data set was loaded and being processed, the memory consumption of both real and virtual memory was high, and the result was a disk I/O bound process. To speed up the processing the data had to be partitioned. The Vision database was seamless, so it provided no direct partition. However, there were business attributes that provided the foundation for a partition. The following steps where taken:
This approach allowed for all polygons to be recovered from the Vision database. In addition this approach allows for multiple processors to be employed to solve the polygon formation problem in parallel. A side effect of this approach was that lots that were incorrectly assigned to the wrong township/range were easily identified. In conclusion this performance issue was resolved by breaking the County down into a collection of puzzle pieces which were reassembled into the greater County.
3.0 Quality Assurance and Error Resolution
The OCPA quality control consisted of a set of topological rules and review procedures designed to ensure proper data integrity for use with the Esri products. Staff decided to first convert the Vision data into ArcInfo export files before ultimately storing the features in SDE/Oracle. The data was converted into coverages so the diagnostic capabilities of ArcInfo could be capitalized during quality assurance. Once imported, ArcInfo coverages were created using commonly used themes (e.g., parcels, lots, subdivisions, etc.). OCPA adhered to comprehensive quality assurance procedures using ArcInfo (ArcEdit, ArcPlot, and INFO) and ArcView software to assure the long-term viability of the spatial and attribute data in an Esri environment. ArcView was employed to qualitatively check the converted data (e.g., search for proper location of parcels and correct parcel attributes) while ArcInfo was used to check topological integrity (e.g., Do the polygons close? Do the arcs intersect? Are the internal IDs consistent and stable?, etc.), a critical test for use later on. The quality assurance procedures were as follows:
- Note: polygon area values should not change after a "build"
Once these rules were satisfied, the data was loaded into SDE using SDE administration scripts. The parcels and lots coverages for the dense urban areas first had to be joined into township-level coverages before the loading could begin.
It is important to note that a number of iterative test conversions were performed over the course of the summer and early fall of 1999 in order to tune the conversion software, record the processing times, refine our quality assurance procedures, and review the Vision data for errors. This approach uncovered a number of problems with the Vision data. Data deficiencies ranged from duplicate arcs, disconnected street centerlines, and broken hydrography arcs to open parcel polygons and miscoded parcels and subdivisions. We thus were able to clean up much of the data before loading coverages into SDE.
The converted ArcInfo coverages were loaded into SDE after all QA was completed. There were several valuable observations/lessons learned during the data loads and subsequent tuning and use of the data. Above all, SDE offered rapid access to a seamless countywide database consisting of over 300,000 parcel records and 27 SDE tables. Spatial data and attributes could be retrieved within seconds anywhere in the county. Tuning the database and separating the data layers into separate feature class tables was necessary to optimize this performance. OCPA staff also developed custom AMLs to import and export the data for parcel maintenance. FME was extended to support mapping that would export the data out of SDE into several formats: E00, Shape, DXF, DGN, and MIF (for data requests and GIS partner data updates). ArcInfo had commands to export data out of SDE as shape and coverage, even DXF files. However, converting to DGN and MIF posed more of a challenge. FME provided a powerful tool to accomplish all of these tasks using one software product.
Among the lessons learned, we noted that:
Figure 6. Sample of OCPA Internet Mapping Application Using Data Converted with FME Software
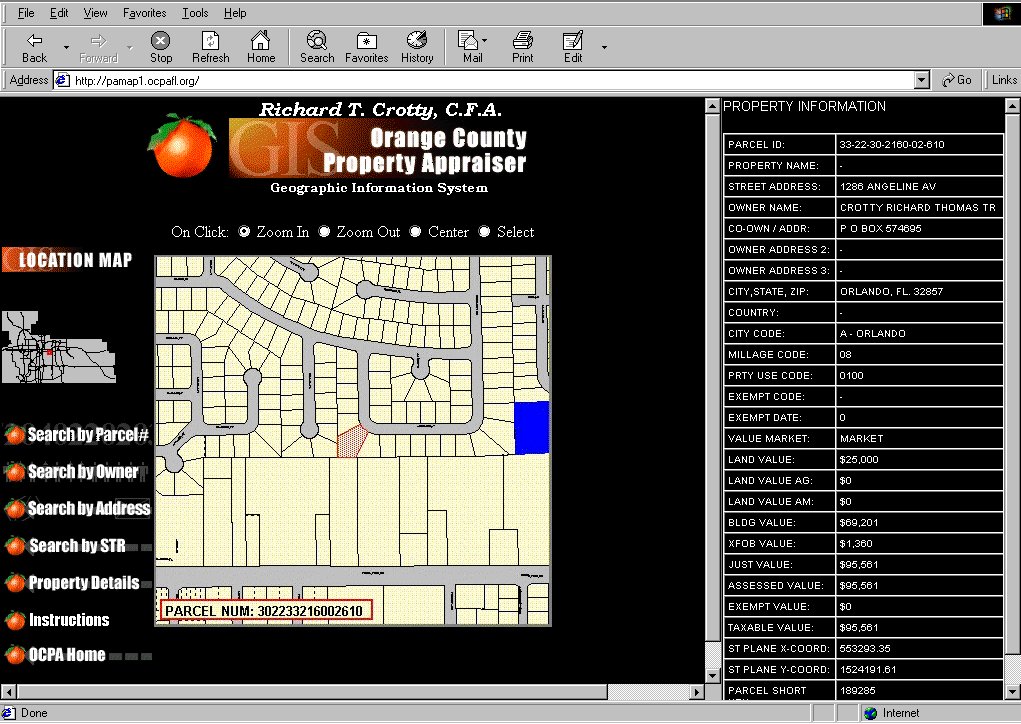
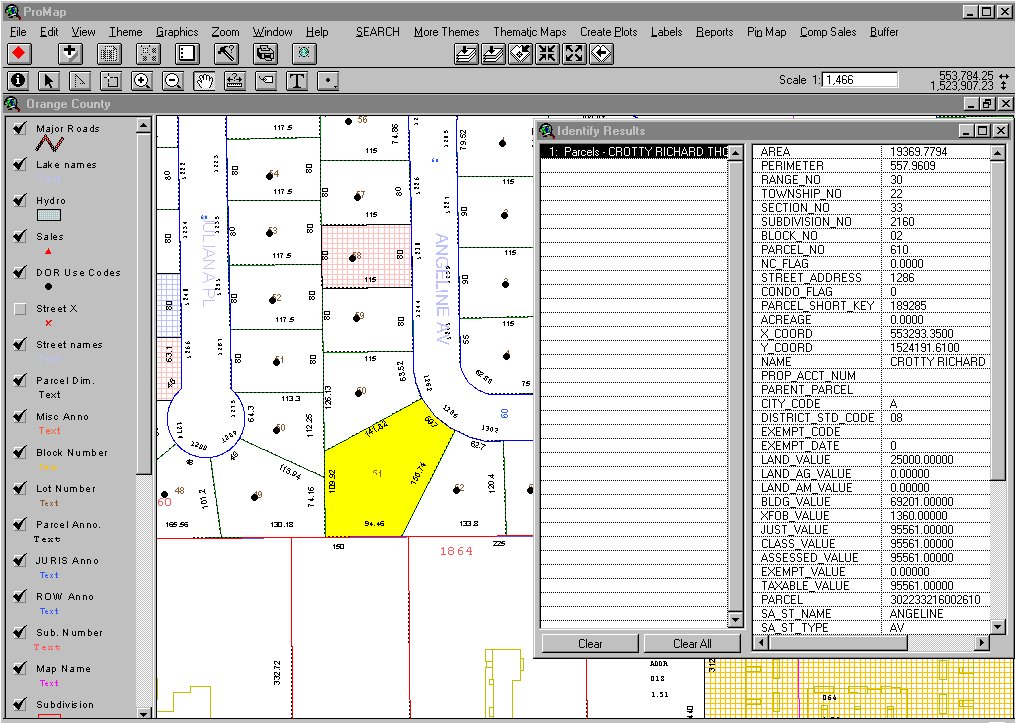
Figure 7. Screen Showing a Converted GIS Data Using ProMap, OCPA’s Custom ArcView Application
Above all, sound project planning, a trained staff supplemented by consultants for specific tasks, a team effort, lots of communication and coordination between the vendors, client and staff, and hard work enabled us to convert the entire county-wide parcel database and GIS applications within an eight month period. By December 1999, the Orange County Property Appraiser's Office could boast a variety of successful GIS applications, a clean transfer of legacy data from Vision to a seamless parcel database in SDE using the FME, a custom ArcView application called "ProMap" for data display, plotting, and analysis, a custom Visual Basic/ArcODE parcel maintenance application, and an Internet Map Server using a VB/MapObjects 2.0 program (Figures 6 and 7). [Be sure to visit the Property Appraiser's Office web site at www.ocpafl.org to see some of the results, and www.safe.com to view the FME]. Of course, this is only the beginning. We plan to enhance the functionality of our web server and custom ArcView programs and expect to develop a more sophisticated Intranet map server for the Office and for wireless GIS access to the field appraisers’ laptop computers.
Our collaboration with Safe Software, Esri, and Panda Consulting, Inc. helped make this possible.