Rakesh Malhotra, Paul Johns,
Marguerite Madden, and Gary Wein
Deer-Vehicle Collisions: Is There a Pattern?
Deer-vehicle collisions are a common occurrence on highways of Eastern
United States. This study uses aerial photographs and GIS to analyze deer-vehicle
collisions at the Savannah River Site (SRS), South Carolina. Vegetation,
topography, presence of water bodies, and road conditions are analyzed
to better understand their impact on such collisions. The spatial correlation
between these factors, within 1000m buffered zones around collision sites,
are compared to the correlation at random points along roads. The results
are then used to create a spatial model to identify conditions conducive
to deer-vehicle collisions. It is hoped that by understanding these factors,
management practices can be used to reduce such incidents.
INTRODUCTION
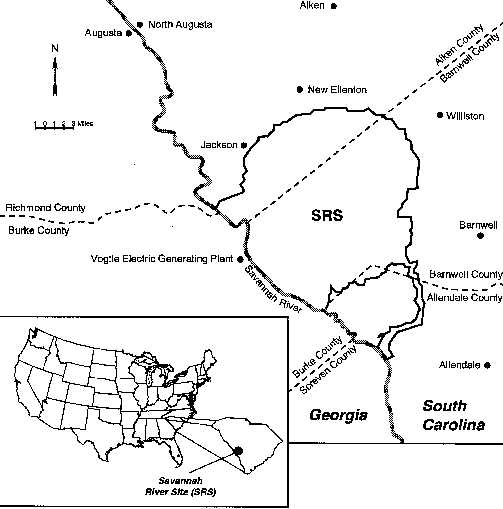
The Savannah River Site (SRS) is a nuclear production
facility of the U.S. Department of Energy and occupies approximately 80,000
hectares of land in west central South Carolina (Figure
1). In 1951, Dr. Eugene P. Odom and other researchers from The University
of Georgia were invited by the Atomic Energy Commission (AEC) to conduct
a census of plants and animals in this area. This research led to the Savannah
River Ecology Laboratory (SREL) being established at SRS in 1961.
When land was acquired from the public by AEC in
1950, most existing agricultural fields were converted to pine plantations
and public hunting of deer was suspended. This led to a dramatic increase
in the deer population and by 1965, deer-vehicle collisions problem had
become so widespread that public hunting was re-introduced on the property.
During the annual public hunts, 1,000 to 1,200 deer out of a total estimated
population of 7,000 deer are harvested. This problem was not studied further
until 1990 when SREL personnel started collecting information about deer-vehicle
collisions. Since then, data have been collected on over 900 collisions
that have taken place on the SRS. The restricted access to SRS makes it
unique as most deer-vehicle collisions are reported and recorded.
The study uses geographic information system (GIS)
and remote sensing techniques to collect data on and analyze deer-vehicle
collisions to evaluate the impact of vegetation, elevation, and water bodies
on this phenomenon. Based on the analysis, a risk model will be created
that can be used by the managers at SRS to warn drivers of potential high
risk sites or modify land management policies to reduce the propensity
of such accidents. Such management practices may help in reducing the attraction
that the deer might have for roadways.
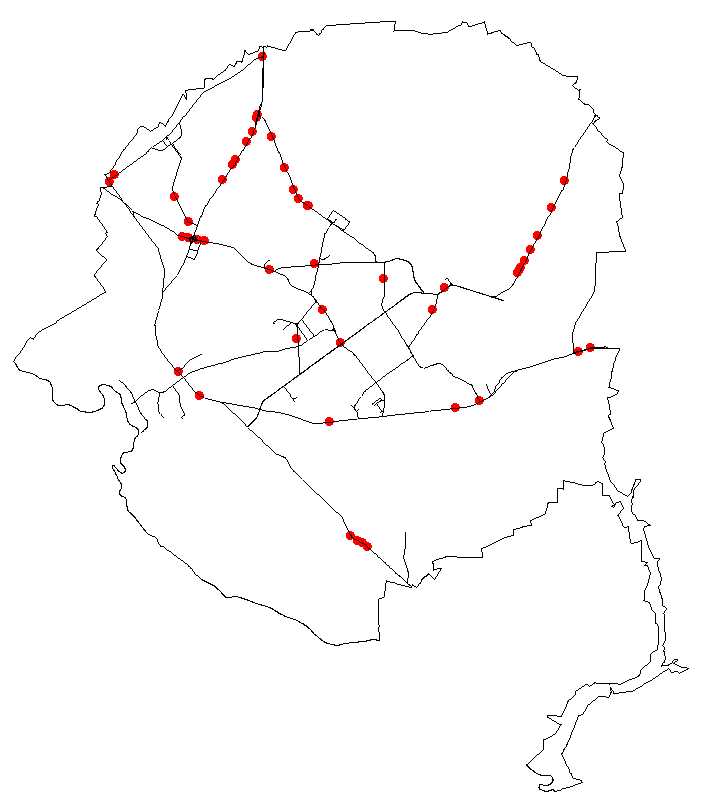
Figure 1. Savannah River Site Figure
2. Deer-Vehicle Collisions at SRS in Fall, 1995
HYPOTHESIS
Since the 1970s, yearly deer-vehicle collisions in the
United States have increased from approximately 200,000 to an estimated
500,000 in 1995. The National Safety Council Report estimated that in 1995
such collisions cost over $125 million in medical expenses, over $940 million
in vehicle repairs and over $350 million in wildlife loss. Apart from being
economically costly, deer-vehicle collisions are also a threat to humans
traveling on roads (Huges et al., 1996). Various solutions offered to this
problem such as the construction of underpasses, reflectors, chemical repellents,
and noise creating devices are either very expensive or have not been conclusively
shown to reduce collisions. However, data on deer-vehicle collisions at
SRS offer a unique opportunity to study the interactions between deer movement
and vegetation.
The two hypotheses that are tested as part of this
study are:
Hypothesis I : Deer-vehicle collisions are not random
occurrences in space but are clustered in areas which can be identified
using spatial analyses.
Hypothesis II : The occurrence of deer-vehicle collisions
can be related to physical attributes such as vegetation and slope of the
areas where collisions occur and these attributes can be used to predict
future collisions
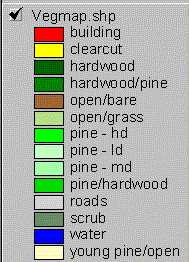
Figure 3. Vegetation along the roads at SRS Figure
4. A 500m (radius) buffer around a collision
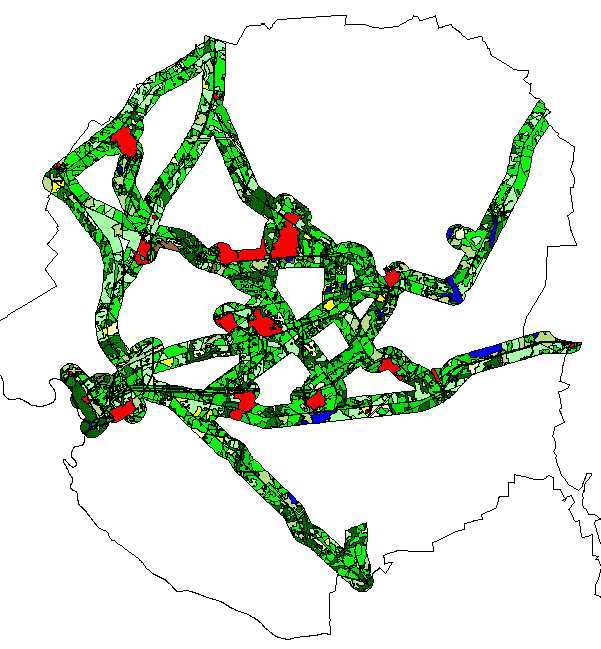
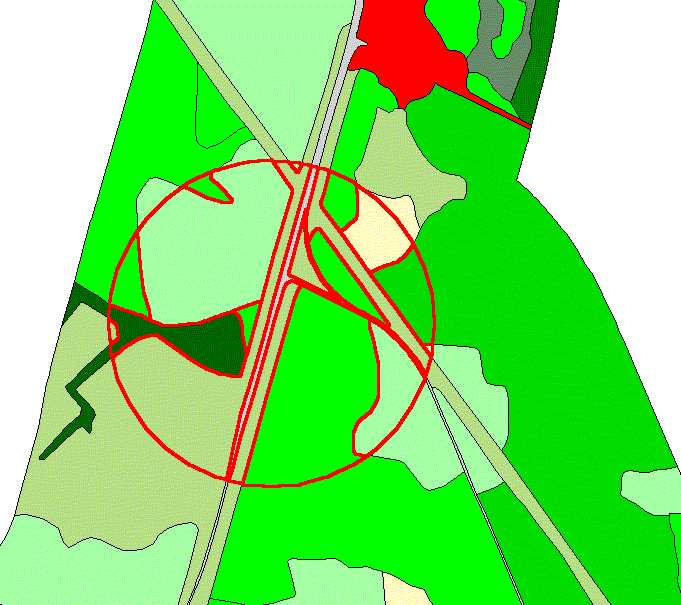
Figure 5. Legend
METHODS
SREL personnel, who are called to deer-vehicle
collision sites, collect data on the animal (age, sex) and the location
(date, time, and position) of the accident. This information was entered
into a GIS database to create a point coverage of the deer-vehicle collisions.
Each collision was identified by the year and given a unique identification
number. This process was started in 1990 and continues till date.Figure
2 shows a map of deer vehicle collisions that occurred on SRS in Fall
1995. The next step was to use ArcView to extract paved roads traversing
the site from an existing roads coverage and buffer them 500 meters on
both sides. We then used ArcView Image Analysis extension to display true
color orthophotos (1:16,000), that are available for March 1996 at SREL,
to interpret and delineate vegetation within this buffer zone (Figure
3). The deer accidents were chosen for Fall 1995 because this was the
closest date to air-photo acquisition date of Spring 1996. The various
vegetation categories created for this study are listed in Table
1. Two factors that helped determine the vegetation classification
were - classification schemes used for previous vegetation studies at SRS
and habitat suitability of each category for deer.
In order to test our hypotheses we
carried out the analysis for fifty-one collisions that occurred in Fall,
1995. We took each collision point and buffered it 500 m (1000 m diameter)
and then used this buffer to clip the vegetation cover and extract the
amount of vegetation (of each type) that was present within this area (Figure
4). As this process had to be repeated several times, we automated
the process by creating an Avenue script. For each collision, we also selected
4 random points along the roads and extracted the same information. Fifty-one
deer-car collisions and 204 random points were buffered and vegetation
information was extracted. We then created an average buffer area by summing
up the area for each vegetation type and dividing this number by the number
of points used for collisions and random locations respectively. The
data collected on vegetation and water bodies was then tabulated and analyzed.
This entire process was also repeated for a 250m (500 m diameter), and
125m (250 m diameter) buffer around the points. This was done in order
to find out whether the vegetative characteristics around the points varied
with the buffer size.
RESULTS
The results shown in Table 2
summarize the average total area (in square meters) of each vegetation
category contained within a buffer around each point. The comparison between
collision points and random points shows that collisions tend to be spatially
associated with fewer buildings, water bodies, and clear-cuts but are more
commonly associated with open-grass and hardwood areas. This relationship
was also observed for the smaller 250m and 125m buffer radii. For all the
three radii, the amount of vegetation in collision points is 1.35 times
and 1.5 times for hardwood areas and open-grass areas respectively when
compared to random points (i.e. there is approximately 50% more open-grass
area around collisions than around random points). Similarly, the amount
of area covered by buildings around collision points is about a third of
the area around random points. The relationship for water bodies is more
complex. At the 500m radius buffer, the area covered by water around collisions
is half the area covered by them around random points but this figure falls
to a fourth at the 250m radius and then rises back to a third for the 125m
radius. Although there appears to be less water around collisions, the
ratio of water around collision points and random points does not remain
constant as we reduce the buffer radius.
Most collisions probably occur away from buildings
because deer avoid built-up areas and also because motorists tend to slow
down when approaching buildings. Fewer water bodies around collisions may
be explained by the observation that as roads approach water bodies, the
embankment gets steep and it is harder for deer to cross the roads at such
points. However, it is harder to intuitively explain why there are fewer
collisions near clear-cuts.
Relative to random points, collision points were
surrounded by more hardwood areas. This may be explained by the fact that
as most of SRS is covered with planted pine without any understory growth,
deer might find forage in hardwood patches. Collision points also were
associated with open-grass areas than random points. This may counter the
prevalent belief that wide patches of open grass along roads reduce
the possibility of accidents by giving drivers ample visibility along the
road shoulders. In fact, as the animals stay hidden in the pine forests
during the day, they may be utilizing the open-grass areas along roadsides
more during dusk, dawn, and night thereby increasing the risk of deer-vehicle
collisions.
FUTURE STUDIES
This is a preliminary report and we plan to expand the
study to incorporate collision data from other years (e.g. collisions from
1994 and 1996). This longer term study will include the analysis of two
other important factors; edge and elevation. It is important to consider
the impact of these two characteristics may have on deer-vehicle collisions
because they are closely associated with vegetation. The analysis presented
above uses only area as a measure of the presence or absence of a vegetation
type. Further analysis will be carried out that compares the number of
polygons of each vegetation type in collision and random points. Vegetation
maps for SRS are being created using small scale (1:48,000) aerial photographs
and satellite (Landsat TM) images. These maps will be used to determine
if image resolution plays a role in identifying potentially dangerous sites.
Finally, we intend to carry out categorical modeling and non-parametric
statistical analysis to build a model that can help predict the probability
of deer-vehicle collisions.
CONCLUSIONS
Deer-vehicle collision analysis is important because
the increasing number of cars and deer will result in more damage in the
coming years. The problem has been exacerbated by the desire of several
city residents to move into the suburbs. This not only leads to more travel
time but also enhances the chances of a dangerous encounter between cars
and deer by bringing the people in close proximity to deer habitat. From
the above study preliminary results demonstrate that deer-vehicle collisions
do not occur at random but may be influenced by the surrounding vegetation.
The study also helps in identifying open-grass and hardwood areas as vegetation
cover that may be contributing to such accidents. As the analysis of a
single year of data only provides preliminary spatial patterns, this study
will be extended to other years. As the results show the influence of surrounding
vegetation, it may be surmised that other factors such as edge, and elevation
also play a role in such collisions and hence they should be further investigated.
ACKNOWLEDGMENTS
We wish to acknowledge the assistance provided by Savannah River Ecology
Laboratory, operated by the University of Georgia and supported by Financial
Assistance Award Number DE-FC09-96SR18546 from the U.S. Department of Energy
to the University of Georgia Research Foundation and the Center for Remote
Sensing and Mapping Science (CRMS), Department of Geography, University
of Georgia.
Table 1. Vegetation classification
| Vegetation |
Description |
| Buildings |
Buildings and built up area |
| Roads |
All paved roads |
| Water Bodies |
Lakes, ponds, and rivers wider than 20 meters |
| Open Bare |
Open ground with no vegetative cover |
| Open Grass |
Open ground covered with grass (minimum width 15 meters) |
| Clear-cut |
Clear-cut pine stands with characteristic signature with
trees harvested within a year |
| Pine Hardwood |
Mixed forest where pines and hardwoods cannot be separated
but there are more pines than hardwoods |
| Hardwood Pine |
Mixed forest where pines and hardwoods cannot be separated but there
are more hardwoods than pines |
| Pine - high density |
Dense pine forest where no vegetation is visible below the canopy |
| Pine - medium density |
Pine forest where some vegetation is visible below the canopy |
| Pine - low density |
Pine savannah with 2-5 trees in a 20x20 m area |
| Young pine / Open |
Pine tress planted within the previous 2-4 years and they have open
spaces between them |
| Hardwood |
Hardwood forest |
| Scrub/shrub |
bushes, shrubs, etc. |
| Edge |
The boundary between two vegetation types |
Table 2. Percentage of vegetation type in a circular
area around collisions and random points.
| Vegetation Type |
Area (sq. meters) of vegetation in a 500m radius buffer
around points |
Area (sq. meters) of vegetation in a 250m radius buffer
around points |
Area (sq. meters) of vegetation in a 125m radius buffer
around points |
| Collision |
Random |
Collision |
Random |
Collision |
Random |
| Buildings |
18491.8 |
55688.4 |
3973.7 |
11237.8 |
882.7 |
2842.1 |
| Water Bodies |
5128.3 |
10907.8 |
533.0 |
2184.1 |
104.2 |
382.3 |
| Open Grass |
119595.1 |
80460.9 |
34685.4 |
23382.7 |
10733.7 |
6897.3 |
| Open Bare |
1942.3 |
2076.8 |
0.0 |
353.4 |
0.0 |
72.3 |
| Clear-cut |
6320.0 |
10764.8 |
438.2 |
2216.8 |
0.0 |
335.1 |
| Pine Hardwood |
59706.1 |
83341.9 |
18464.0 |
23481.8 |
5074.7 |
5792.4 |
| Hardwood Pine |
37449.2 |
39857.2 |
9475.1 |
10562.7 |
2401.1 |
2590.2 |
| Pine-high density |
259706.8 |
263349.1 |
59696.1 |
66266.2 |
13068.8 |
15935.7 |
| Pine-med density |
130447.5 |
119543.6 |
31249.1 |
26938.7 |
6780.2 |
6256.3 |
| Pine-low density |
7011.9 |
6927.0 |
1503.8 |
1358.5 |
332.9 |
287.6 |
| Young pine / Open |
14303.5 |
12010.6 |
4262.7 |
3724.7 |
1298.7 |
1018.9 |
| Hardwood |
103946.1 |
79978.1 |
23362.7 |
17332.2 |
5068.1 |
3658.9 |
| Scrub/shrub |
3297.2 |
5371.6 |
1446.3 |
1209.1 |
229.2 |
325.1 |
| Roads |
14071.0 |
11139.1 |
6264.2 |
5105.4 |
2864.2 |
2444.2 |
REFERENCES
Huges, W.E., A.R. Saremi, and J.F. Paniati, 1996. Vehicle-Animal Crashes:
An Increasing Safety Problem, ITE Journal, August:24-28.
Rakesh Malhotra
Graduate Student
204 GGS Building
Department of Geography
University of Georgia
Athens, GA 30602
(706)-542-2856
rakesh@uga.edu
Mr. Paul E. Johns
Savannah River Ecology Laboratory
University of Georgia
Drawer E,
Aiken, SC 29802
johns@srel.edu
Dr. Marguerite Madden
Associate Director for Environmental Studies
Center for Remote Sensing and Mapping Science
Department of Geography
University of Georgia
Athens, GA 30602
mmadden@crms.uga.edu
Dr. Gary Wein
Savannah River Ecology Laboratory
University of Georgia
Drawer E,
Aiken, SC 29802
wein@srel.edu