The application of GIS in transport planning is growth rapidly in recent years. However, most of these applications tend to confine to simple street mapping, shortest path analysis, and vehicle routing studies. For transport planning and policy evaluation, planners require process information which is beyond the functionality of current off-the-shelf GIS. This paper presents an innovative approach to integrate accessibility potential models in ArcView GIS environment using Avenue. Using the Light Rail Transit (LRT) project of Singapore, the design principles and implementation of the application are discussed and illustrated.
LIU Suxia and KAM Tin Seong
1. Introduction
The application of GIS in transport planning is growth rapidly in recent years. However, most of these applications tend to confine to simple street mapping, shortest path analysis, and vehicle routing studies. For transport planning and policy evaluation, planners require process information which is beyond the functionality of current off-the-shelf GIS. For example, the contemporary generation of GIS provides several ways to deal with absolute or relative distance, such as buffer commands and shortest-route algorithms. Neither of these can provide a general overview of accessibility in a given area, however. Since the early 1990s, there is a general consensus within the GIS community that the future success of GIS will dependent to a large extent on incorporating more powerful analytical and modeling functions (Goodchild et al. 1992), and several current research initiatives in North America and Europe focus on the improvement of spatial analytical and modeling capabilities of GIS technology. The integration of GIS with urban modeling was part of these broad research efforts to link spatial analysis and modeling with GIS (Sui, D. Z., 1998).
The objective of this paper is threefold: (1) to develop the distance (travel time) algorithm, which attempts to overcome the limitations in the existing measurements of the current generation of GIS; (2) to design and develop modified potential model within the ArcView GIS environment by making use of Avenue Scripts in full integration way; (3) to evaluate the applicability of the GIS module using LRT system of Singapore.
Some of the previous work on accessibility and potential models are
briefly reviewed in the next section. We conclude that there is a lack
of full integration of potential models within GIS environment although
the potential models have been extensively used by accessibility-based
measures. So the general idea of this paper is to design and develop the
potential model whole within ArcView GIS environment (which named ACCESS
Extension) using Avenue Program. The fundamental design decisions and methods
underlying the ACCESS Extension are described then. In a case study, the
ACCESS Extension is tested. Some conclusions are offered in the end.
2. Accessibility and Potential Models
There are a number of accessibility variables defined in the literature (Vickerman 1974; Pirie 1979; Weibull 1980; Jones 1981), and there is no universal agreement about the exact meaning on the word accessibility. The concept of accessibility is concerned with the opportunity that an individual or type of person at a given location possesses to take part in a particular activity or set of activities. It related to the individual or type of person, the spatial location of the opportunities, the starting point of the individual, the ease of reaching each destination, and the magnitude, quality, and character of the activities found there, the times and travel cost at which the individual is able to participate in the activity and the times at which the activity is available, as well as travel choice. Accessibility is thus associated with an appreciation for the type and quality of the transportation system and patterns of land-use as well as the availability of satisfactory potentials in destinations.
Most practical attempts to measure relative peripherality as well as infrastructure investment have involved the long-established approach of using models of economic or market potential. It is clearly optimistic to expect two simple terms of population and distance to be able to capture these complexities. In response, in some recent applications of accessibility-based measures, researchers have experimented by adapting the basic potential approach (Frost and Spence 1995; Geertman et al. 1995). A general version of potential model is:
Pi being the potential at point i,
Mj being the mass (attraction) of centre j,
dij being the distance/travel time/transport costs between i and j,
a is a parameter, usually between 1 and 2, reflecting the rate of increase of the friction
of distance.
The potential model may be viewed in a number of ways. It is an index of the nearness of people to one another or a measure of the influence of people at a distance. Slightly more concretely, it indicates the intensity of possible contact between people at i and those at all other locations. But most commonly, it is regarded as an indicator of relative position, or accessibility. Thus, the potential model gives a measure of the accessibility of people in i to people in all parts of the area being examined. The closer the opportunity, the more it contributes to accessibility; the larger the opportunity, the more it contributes to accessibility. Later, the impedance function takes on many forms, and the negative exponential form has been used more often (Bröcker 1989; Handy and Niemeier 1997).
Although the potential models have been extensively used in geographical
research, especially adapted by accessibility-based measures, and the last
decade has seen an upsurge in the use of geographic information system
(GIS)-based accessibility analysis, there is a lack of full integration
of potential models within GIS environment. Most applications built the
potential models as a separate modelling program outside the GIS package
such as Geertman and Ritsema van Eck (1995). The disadvantages are clear.
The reformatting of files to and from the GIS can become a major obstacle
if the modelling process is to be repeated with different input data. The
interactive character of GIS analysis is lost. Moreover, although pre-
and post-processing is improved, the modelling program itself is not changed,
so the internal representation of space is the same. To overcome these
problems, we designed and developed the potential model whole within ArcView
environment by making use of Avenue program. In this way, user can operate
this procedure directly under ArcView environment and produce general picture
of accessibility; meanwhile, we can make use of its special function such
as Shortest Path Analysis, Network Analyst Extension and Patch Analyst
Extension as well as Avenue program under ArcView environment. The other
issues concerning potential models, such as interpretation, self-potential,
and travel impedance are also resolved or avoided respectively as below.
3. Design Fundamentals
The general idea is to design and develop the potential model whole within ArcView GIS environment using Avenue Program. For this purpose, we designed and developed the ACCESS Extension in ArcView environment using Avenue Program. In this way, accessibility can be calculated completely under ACCESS Extension. This section specifies the fundamental design decisions and methods underlying this work, before the fuller description of the ACCESS Extension.
3.1 Modified Potential Models
Being relative values, potential values as such have no meaning and are difficult to interpret. Geertman and Ritsema van Eck (1995) solved this problem by calculating two sets of potential values and dividing the outcome of the one by the other. The 'modified potential model' is:
The dimension of the model is the same as that of the travel time dij. The results are measured in the same unit as dij, in this case, in minutes. Providing the only difference between the two sets is the distance decay parameter that should be exactly a factor +1 larger in the second set, the result will be potential values expressed as a weighted average travel time from location i to all surrounding centers. We will calculate accessibility using this modified potential model in the ACCESS Extension.
3.2 Methods for Related Problems and Representation
The a is a parameter reflecting the rate of increase of the friction of distance. It is not clear how the value should be determined. The analogy to physical gravitation and potentials suggests subtracting 1 from this value. Others have recommended taking an a priori value like 1 or 2. In this study, we made an interactive operation prompting the user to specify the value of parameter a. A series of results can be calculated by different value of parameter a, and will be compared in case study, and also can be calibrated in the future research.
Another problem of potential models is due to the fact that the self-potential, which is the component when index i=j is not defined. Typically, accessibility is measured by zones such as administrative areas, transport analysis zones (TAZ), etc. For the calculation, the total weight of each zone is assumed to be concentrated at its centroid, so that the distance between two zones can be estimated as the distance between the centroids. It is not at all clear, however, how to calculate the 'auto-potential' for a given zone, that is: the contribution of the weight of a zone to its own potential value. This is because it is not clear what value should be used for the intrazonal distances. Zero distances result in bogus potential values. It has been suggested that a small value (e.g., 1km) could be arbitrarily chosen for the intrazonal distance, or that a value could be derived from the size and/or shape of each area. Frost and Spence (1995) suggested using the smallest zonal scheme possible.
Generally, TAZs are very suitable zone system to used in accessibility analysis (Q.Shen, 1998). However, there is often lack of TAZ in some country including Singapore. We considered another approaches instead of TAZ. Traditionally, circle pattern is very common and easy, but the space will be either overlapped or not continuous. In order to avoid these problems, we use hexagon that close to a circle pattern and can be tessellated into a general and continuous surface. This was performed using Patch Analyst 2.0, an extension to ArcView.
As discussed above, there is a problem of the intrazonal distance. We avoided these problems by choosing a series of different size of hexagon, until there is very small intrazonal distance exist and the results will be compared in case study. Thus, a balance will be found between the need for very small zones to represent best a continuous surface and the need for swift results as this is inversely related to the number of zones. In this way, the problem that related to the degree and type of disaggregation also can be resolved. The smaller the zone, the greater the disaggregation. In this study, the hexagon zones are defined as origins, and the locations of opportunities are defined as destinations. Then using Avenue Program to get their centroids and make a new point theme respectively.
3.3 Basic Algorithm for Travel Distance
The measurement of travel impedance is yet another problem. Distance or time, common measures of impedance, can be estimated by: straight-line distance or some modification of it. In this paper, we develop an algorithm to estimate the distance and travel time according to the actual situation. The general idea is the total distance from the origin to destination includes three parts:
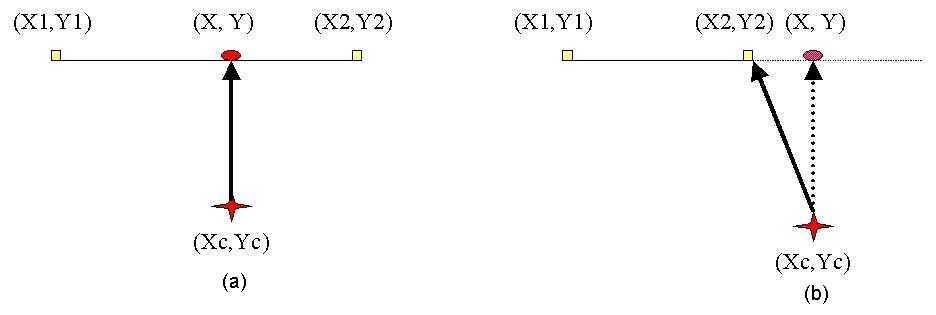
Figure 1. Algorithm for snapping the nearest point
If the origin and destination locations are exactly on the network, the distance of part 1 and 3 equals zero. If not, using Avenue Program to find the nearest point on the network and make a new point theme. The algorithm for snapping the nearest point on the network as below:
4. ACCESS Extension
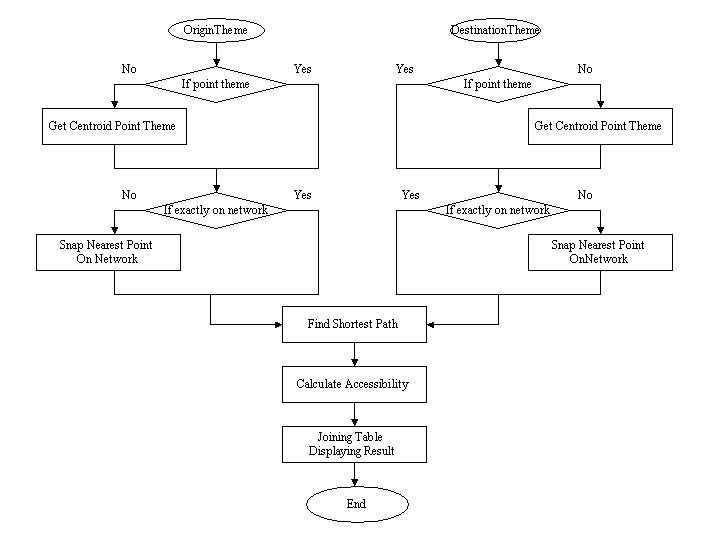
Figure 2. Flow chart for calculating accessibility
The ACCESS Extension included below option items:
5. A Case Study
Major changes have been taken place recently in the public transport services in Bukit Panjang and Choa Chu Kang in Singapore. The first new Light Rail Transit (LRT) system opened in November 1999, which links Bukit Panjang new town with the rest of the island by acting as a feeder service to the MRT system at Choa Chu Kang station. There has been a major reorganization of the bus services to integrate them with the LRT system. This paper looks at these changes in terms of the effects they had on accessibility by public transport in the area. The study area is around the LRT system and covers part of Choa Chu Kang, Bukit Panjang, as well as Bukit Batok planning area in the west region of Singapore. The total area is about 1080ha. The planning vision of this area is to create an attractive residential area, so what around the residential are commercial centers and institutional facilities. The LRT system has 7.8km guideway, 14 stations and a depot. The Choa Chu Kang LRT station is integrated with the Choa Chu Kang MRT station.
In order to test the utility of this model for the planning of transport infrastructure, we calculate accessibility conditions of the school in the situations 'before' and 'after' the construction of LRT in the level of public transport. To make the results approach the actual situation of public transport, only the roads traveled by bus were taken into account, and LRT lines were linked with bus roads at each LRT station.
First, we get hexagonal tessellation pattern in the study area using Patch Analyst 2.0, an extension to ArcView. In this analysis, we chose the area of each hexagonal zone as 5 hectare. We will use the hexagonal zones as the origin and to present the outcome of the analysis. After this, we get centroid of hexagon using Get Centroid Point Theme in ACCESS Extension. Then, we select and weight primary school that will be used as destination. If they are not point theme, get centroid using Get Centroid Point Theme first. Furthermore, we use Snap Nearest Point On Network to snap the nearest point on network for origin and destination respectively. After this, we use Find Shortest Path to find the shortest path in network from origin to destination. In addition, we use Calculate Accessibility to calculate modified potential accessibility of each origin to the whole destination and output Access Table. Then, we use Joining Access Table To Origin Attribute Table to join Access Table to origin attribute table and display the results (Figure 3).
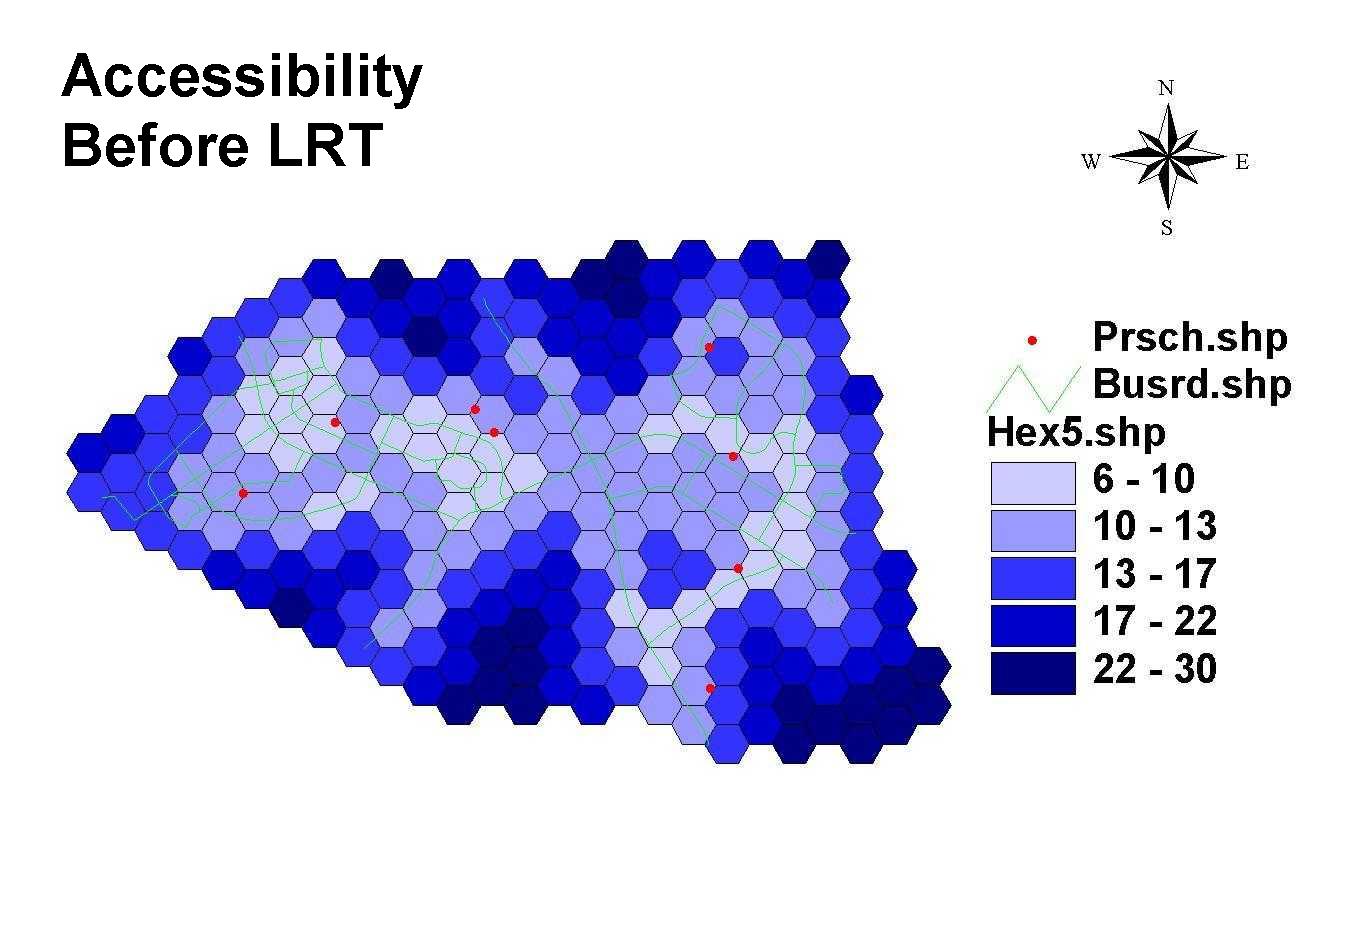
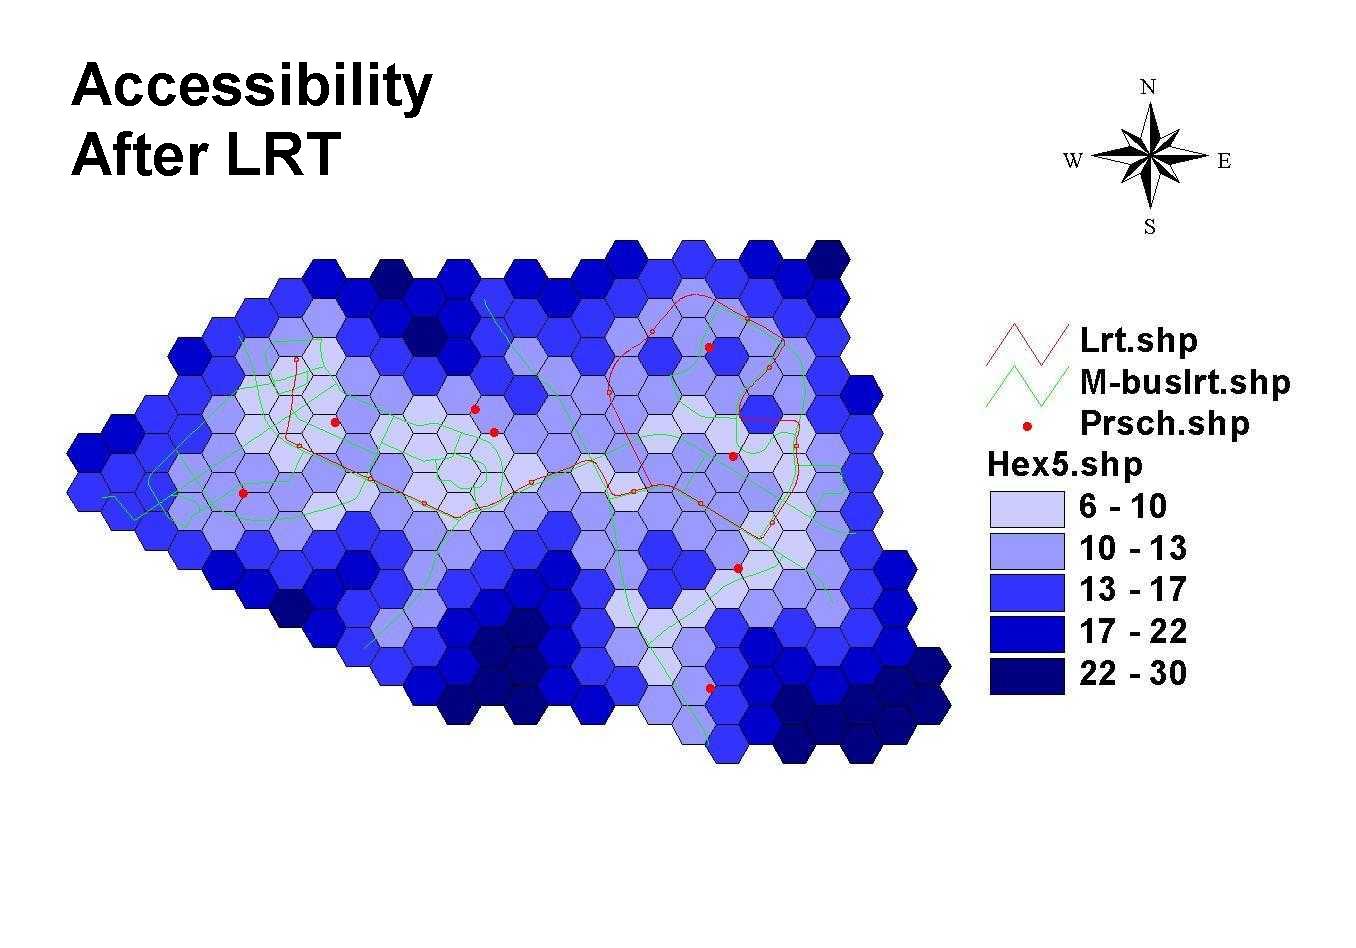
Figure 3. Accessibility before and after LRT system
Comparing the situation 'before' and 'after' scenarios, the general patterns are quite similar, but the effects of LRT are clearly perceptible: the area near LRT line meanwhile less roads before now becomes much more accessible. Above 15 hexagonal zones has been improved one to two classes there, that means above 100 hectare areas have been improved. Certain differences are hidden under these general trends.
Obviously, the biggest changes are in Bukit Panjang new town because there were fewer roads before. In this area, there are above 10 hexagonal zones about 50 hectares areas have been improved after launching LRT. Some zones have been improved from 22-30 minutes to 17-22 minutes, and moreover to 13-17 minutes. Another main beneficiary is the area between Choa Chu Kang and Bukit Panjang along the LRT line. There are two zones have been improved from the second class to first class. The third area is in Choa Chu Kang area. There is three zone has been improved improved one class.
Overlaying the map of residential building with the map of accessibility distribution, we can find that most of government houses and half of private flats are well suited with public transportation, because most of government houses and half of private flats fall within the area of the first and the second classes of accessibility. The other half of private flats is not convenient by public transport, because they locate in inaccessible areas.
We also can find that there are some areas such as the area along Bukit
Timah Road in the south of study area have good accessibility, well-suited
with public transport, but still not used. Such area should be the potential
area for the future planning.
6. Conclusions
The potential models have been extensively used by accessibility-based
measures, but there is a lack of full integration of potential models within
GIS environment. This paper presents ACCESS Extension which designed and
developed potential models whole within ArcView GIS environment using Avenue
program. We also developed the algorithm to estimate the distance and travel
time from the origin to destination. The above ten page long script is
not included due to page limits of this publication. With ACCESS Extension,
user can easily get an overall view of accessibility of an area. This greatly
simplifies the task of indicating good potential building sites, for instance,
areas well suited with reference to public transport or easy to access
by public transport. Meanwhile, user also can calibrate the parameter by
testing different parameter value (such as travel speed, parameter a,
and the size of hexagon) and comparing the results during the procedure
since the ACCESS Extension provides an interactive operation for user.
Further research will be focus on the space-time framework.
References
Bröcker, J., 1989, How to eliminate certain defects of the potential formula. Environment and Planning A, 21, 817-830.
Frost, M. E. and Spence, N. A., 1995, The rediscovery of accessibility and economic potential: the critical issue of self-potential. Environment and Planning A, 27, 1833-1848.
Geertman, S. C. M. and Ritsema, van Eck, J. R., 1995, GIS and models of accessibility potential: an application in planning. International Journal of geographical Information Systems, 9, 67-80.
Goodchild, M. F., Haining, R. and Wise, S., 1992, Integrating GIS and spatial data analysis: Problems and possibilities. International Journal of geographical Information Systems, 6, 407-23.
Handy, S. L. and Niemeier, D. A., 1997, Measuring accessibility: an exploration of issues and alternatives. Environment and Planning A, 29, 1175-1194.
Jones, S. R., 1981, Accessibility measures: a literature review. TRRL Report 967: Transport and Road Research Laboratory, Crowthorne.
Pirie, G. H., 1979, Measuring accessibility: a review and proposal. Environment and Planning A, 11, 299-312.
Shen, Q., 1998, Spatial technologies, accessibility, and the social construction of urban space. Computer, Environment and Urban Systems, 22, 447-464.
Sui, D. Z., 1998, GIS-based urban modelling: practices, problems, and prospects. International Journal of geographical Information Science, 12, 651-671.
Vickerman, R. W., 1974, Accessibility, attraction, and potential: a review of some concepts and their use in determining mobility. Environment and Planning A, 6, 675-691.
Weibull, J. w., 1980, On the numerical measurement of accessibility. Environment and Planning A, 12, 53-67.
LIU Suxia
Ph.D. candidate, Division of Geography, School of Arts
Nanyang Technological University
469, Bukit Timah Road, Singapore 259756
Tel: 65-4605926
Fax: 65-4692427
Email: ezsun@ntu.edu.sg
KAM Tin Seong
Assistant Professor, Division of Geography, School of Arts
Nanyang Technological University
469, Bukit Timah Road, Singapore 259756
Tel: 65-4605187
Fax: 65-4692427
Email: tskam@nievax.nie.ac.sg