J. I. Rodale established the Soil and Health Foundation in 1947 after he had an insight into the relation between soil health and human well-being and how that relationship was being damaged by �modern� farming methods. He founded the Rodale Press in order to share this insight through newsletters and magazines, including Compost Science; Prevention; and Organic Gardening and Farming.
In 1971, Robert Rodale (J. I.�s son) purchased a 330-acre property near Kutztown, PA (now the Rodale Institute Experimental Farm) in order to further the farming and health- related research begun by his father on a smaller homestead in Emmaus, PA. The agricultural research and applied demonstration here has had a significant impact on public policy at the state and national level. Many techniques and philosophies of modern organic farming, of solar design, and even of environmentally conscious lifestyles, now familiar, were developed and demonstrated right here.
In 1982, Robert Rodale established the Regenerative Agriculture Association to advance the work of the Soil and Health Foundation. A new emphasis was given to helping developing countries adopt farming systems that renew local resources. Today the Institute has important exchanges with farmers in Africa, Japan, and Latin America helping them provide local food needs while preserving their own natural resource base. For example, since 1991, the Rodale Institute has proved and encouraged successful alternatives to slash-and-burn agriculture in Guatemala.
Since Robert Rodale�s death in 1990, his wife Ardath has assumed leadership of the publishing business founded by J. I. His son Anthony now heads the Rodale Institute.
�The Rodale Institute works with people worldwide to achieve a regenerative food system that renews environmental and human health.�
Farm manager Jeff Moyer, speaking recently to a meeting of farmers in Mexico, described the Institute�s work today as follows:
"We are a nonprofit research and educational institution based in Pennsylvania in the USA, with a mission of furthering a regenerative food production system based on sound organic practices. We operate a 150 hectares farm that houses our staff, our educational programs, our research projects and something that makes us unique for a nonprofit, a production unit. We grow mainly grains but also produce apples, fresh market vegetables, herbs, flowers, compost, and bedding plants. We obviously believe in diversity. We also believe that agriculture and the food industry must be shown how they can adopt more healthful methods and still prosper."
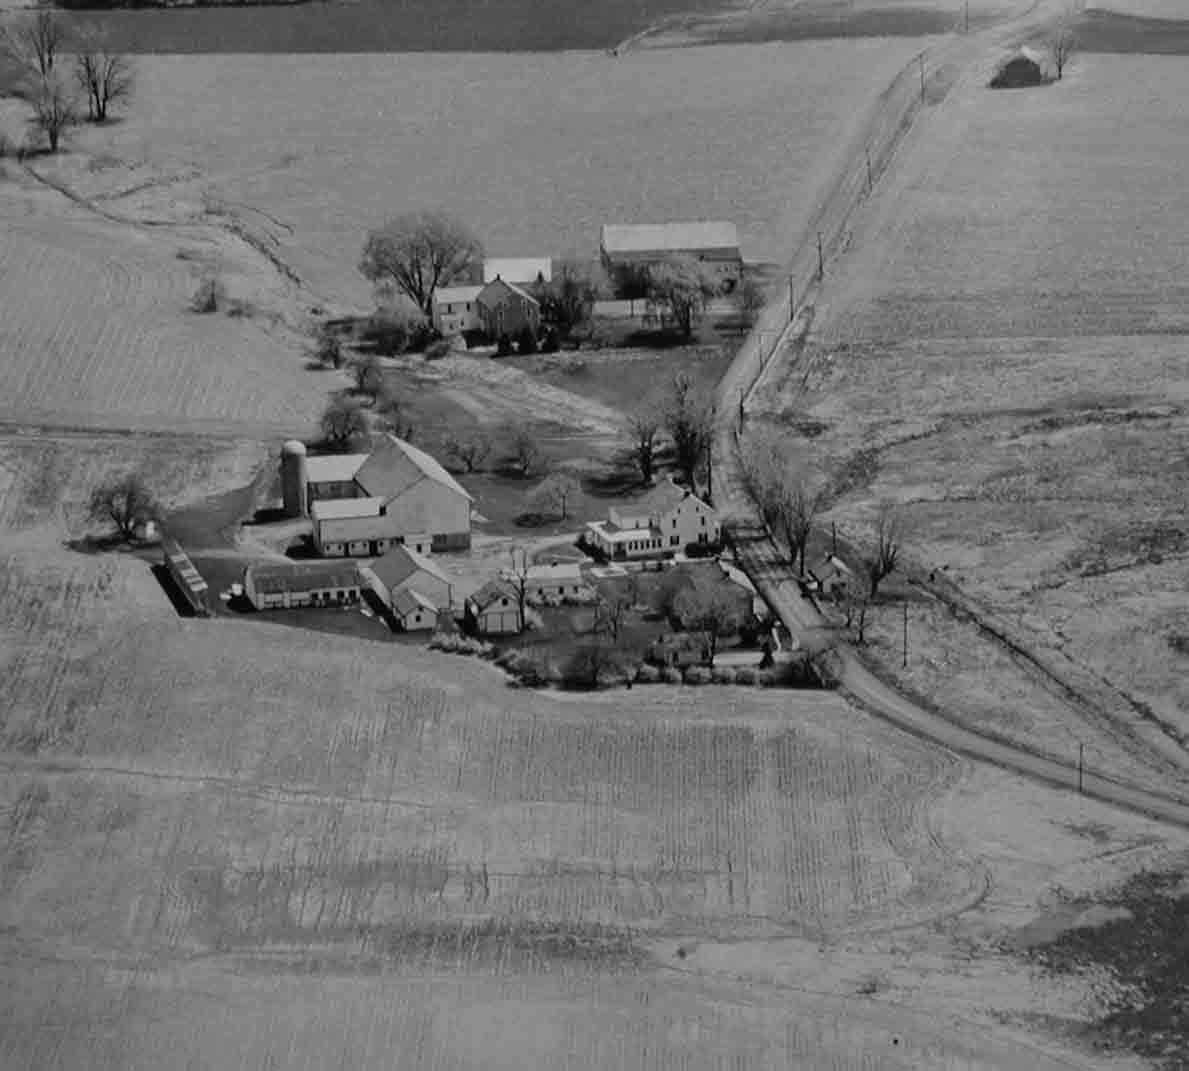
Before the Rodales acquired it, it had been managed for some time as a typical 20th century monoculture crop farm. A picture (Fig. 1) taken in 1971, shows a barren looking landscape with some deteriorating building and bare ground prepared for planting to �fencerow to fencerow� corn. Now, after nearly 30 years of benevolent management, it is vibrates with green and birdsong and attracts many visitors who draw inspiration and spiritual renewal from the landscape (Fig.2).
Fig. 1 (1971 View from West)
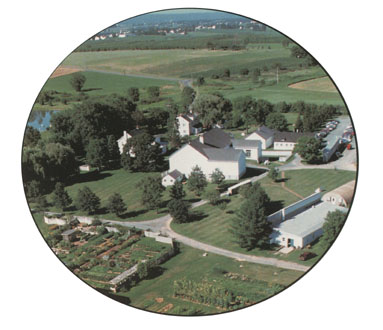
Fig. 2 (mid 1990�s view from East)
The earlier history of the land reflects the pattern of settlement and economic development of our nation. We know that the heirs of William Penn deeded this land a speculator who sold it to the Siegfrieds in the early 17 hundreds. They formed a self-sustaining community (Siegfried�s Dale) and lived here for over two centuries. As was the custom and convenience of the time, they also participated in evicting the original inhabitants � the Lenni Lenape Indians�and removed most of the oak, hickory, and chestnut forest. Land and resources were unbounded, and there was a spirit of �manifest destiny.�
The Siegfrieds mainly prospered, but their fortunes rose and fell in relation to the demand for commodities and the development of the transportation network. They had sold all of the original holding by the 1960�s. Siegfrieds with farms are now as scarce in these parts as Lenni Lenape or American Chestnut trees.
In early 1998, a group gathered to assess the farm as it is today, and to think about new ways of planning the farm that it might continue its evolution. Our group assembled individuals of diverse experience, bias, and background. At the end of two year�s work, we made little progress in master planning, but gained a better understanding of the nature of the land and the value of what is contained here presently. We have attracted attention to our mapping efforts, and are beginning to receive requests for further extensions of our work.
Philosophically, we accept that we inhabit a disturbed piece of earth. The history cited above tells us that. But even before European settlement, there have been dramatic changes that have shaped the present landscape. The great Taconic orogeny formed our hills and valleys, folding them from ancient seabeds laid down before dinosaurs existed, and eons of weathering have smoothed them and covered them with soil. The species comprising the great forests have migrated to the north and south as the global climate has cycled warmer and cooler. We observe that Nature never had a static plan for this place.
Disturbance continues as we find ourselves adjacent to the path of development along a major highway nearby. Without constant maintenance and vigilance, we know that we will be invaded by introduced aggressive species (e.g. tree of heaven, Canada thistle) that are becoming great threats to biodiversity here. We have recently experienced unusually extreme weather, and we fear hastening global climate change. Efficiency gains by agribusiness and the associated lower commodity prices make it difficult for small farms to recover even the cost of production. Young people with ambition, energy, and intelligence see diminished opportunities for security, sustenance, satisfaction, and prestige in agricultural work. This farm is being tested by many of the challenges to human agriculture on the planet at this time -- the dynamics are similar although the specifics vary locally.
Were we simply to abandon the farm while locking out developers, natural processes would reclaim the land over time. However, it would be a long time indeed before the land produced much excess food, fiber, or fuel. Even in the face of great difficulties, we believe it possible to work with nature in creating a design for this farm so that it can regenerate itself and still produce an abundance to supply the ever-growing human population. We also believe it is possible to inspire and educate people to rediscover and treasure their own connection with the soil that supports them.
Quoting farm manager Jeff Moyer again:
"I would have to say we've made great progress since 1942. But now it is time to be visionary once again. I ask the question: Is it enough to be organic? At Rodale we have said ...NO! We need to look at the whole system, a system of regeneration. Regenerative agriculture forces us to look beyond a list of farm practices to view the entire system. Just as soil can regenerate itself, so can people and communities. A system that includes not only the soil, but also the distribution system, community and the health of the people. Why are we farmers? Why do we produce food? Why do we eat food? To be healthy. If that is true, and I think it is, then we need to think of farmers as health professionals."
The best design is specific to the particular circumstances and context. This quality of �fit� is what a competent architect or planner adds to a building or village, bettering designs that have become recent standards or locally fashionable. A good designer must have thorough understanding of the environment in which the design will live and of the problems that the design is intended to solve.
The first task of design is to accurately depict current conditions. The particular landscape and history may be quite familiar, but it is perceived and known in fragments. Maps, illustrations, tables and written descriptions can unify and make objective these bits. At a time when important decisions are being made, it is important to organize a set of clear, universally understandable descriptions of the site�documents that will help to crystallize the opportunities and constraints. These instruments also are invaluable in communicating with others who have important information or ideas relating to the effort. Also, these planning tools can serve as a base upon which the design may be drawn and described.
The Rodale Institute is an information rich environment. Over 20 years of teaching, writing, research and demonstration have yielded a confusing harvest of many hundreds of boxes full of information in different forms. Research reports, computer media, photographs, notebooks, files and other incarnations of data abound (Fig 3). Part of our challenge is to organize and summarize as well as to archive the essence of this information. Using the ability of GIS to give spatial reference to any or all of the bits and pieces and to depict them graphically begins to unlock the knowledge contained in the data and, in some cases, give it a second life.
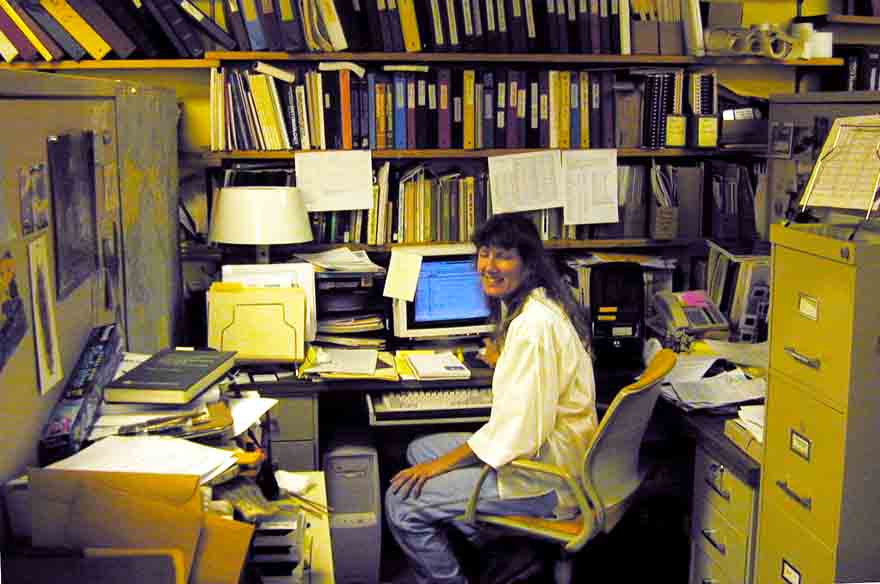
Fig. 3 (Peggy Waggoner�18 years of Farming Systems Trials)
We began our efforts using a 2� contour map and survey prepared by a local consultant (Figs. 4 and 5). Although we felt blessed to possess a map of such detail and accuracy, we found it lacking in several respects:
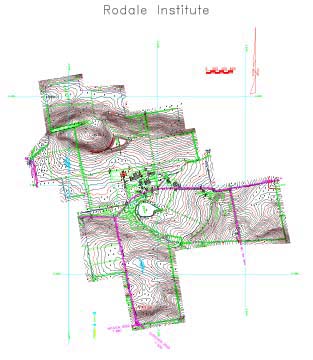
Fig. 4 (AutoCad map with 2� contours and detailed topographic information)
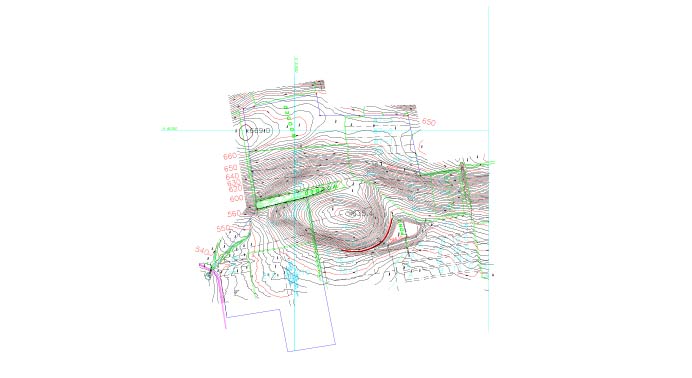
Fig. 5 (Better JPEG of North half of AutoCad map)
The grant received from the Esri Conservation Program (ArcView and DAK software together with the Spatial Analyst, 3D-Analyst, and ArcPress extensions) allowed us to begin developing a better base map.
To build the TIN for the elevation model, we digitized the 10� contours off the USGS quadrangle for our area and overlaid the topographic map furnished by the consultant (Fig 6). Registration of the boundary survey over the topographic map was done by judging the best fit of ground features shown on both maps. Using this kind of judgment to resolve differences between various kinds of maps was used throughout the project since the original intention to resolve all maps to one precisely georegistered standard proved futile.
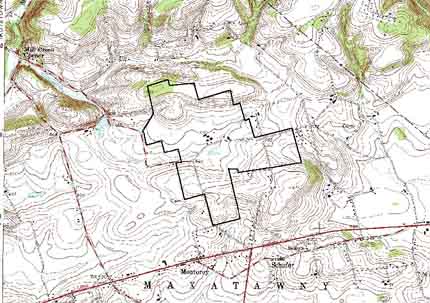
Fig 6 (Best fit of boundary survey and detailed topography to USGS quadrangle)
What we learned from our work with maps of varying accuracy is that the greatest payoff from time invested comes by superimposing a large amount of approximately mapped information (building lots of layers) rather than attempting to resolve locations of individual features precisely. We did not use any �rubber sheeting� techniques, but made frequent use of affine transformations to adjust scale and azimuth. In cases where a map layer contradicted reality as we can witness it (e.g. for contour or stream locations), we simply drew the line as we know it to be on the ground and ignored the inaccurate information on the source map. In cases where we had to guess at locations, we were willing to make educated guesses. We saw our work as an effort to reveal general patterns in the landscape rather than to create perfectly accurate documents.
The resulting TIN model shows the finer detail of the 2� elevation interval on the landforms interior to the farm boundaries. The 10� contour interval on the surrounding areas resulted in a chunkier model for those areas, but still shows the topographic relief of the farms geographic context quite well.
The first efforts with the GIS maps (Fig. 7) were not much better received than the AutoCad maps, and we continued to receive glassy-eyed stares when referring to them. One problem was allowing the GIS software to attach a default legend to the elevation information. The legend we first chose went �from the green valleys to the snow capped mountains��with a lot of dark brown in between. Although colorful, this legend is not intuitive for our gently rolling area (Fig 8).
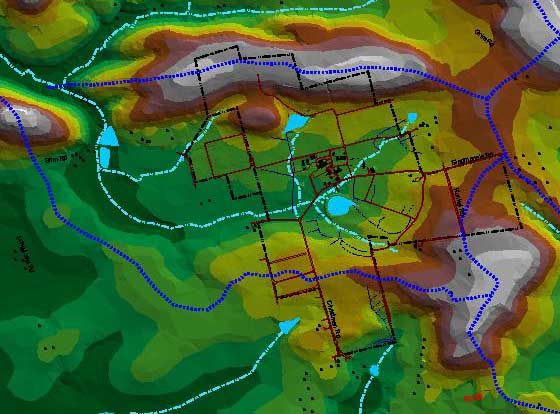
Fig. 7 (Original attempt to make shaded relief map)
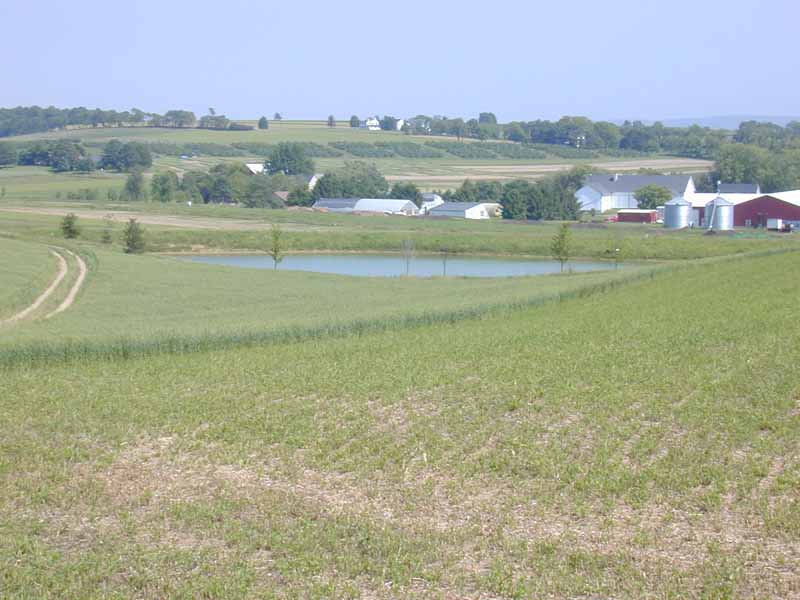
Fig. 8 (Looking from central knob SE across pond)
We were able to make a greatly improved map (Fig. 9 and 10) by working with the legend editor in ArcView. We intentionally selected a range of colors that better represent the shades of green and gold in our terrain and made finely graduated steps to eliminate banding. We added lightly drawn and labeled contour lines for elevation reference. This map uses the colors of the shaded relief to convey the feel of the topography, letting the contour lines convey the actual elevations.
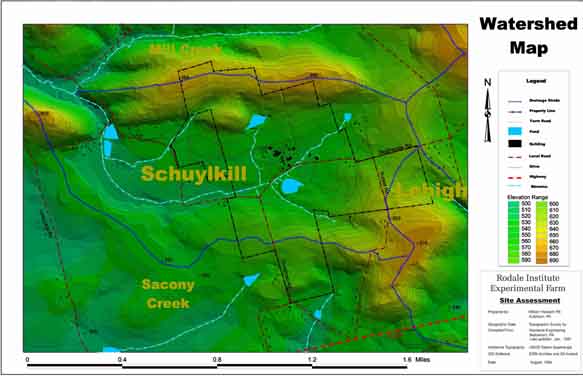
Fig. 9 (Evolved shaded relief map)
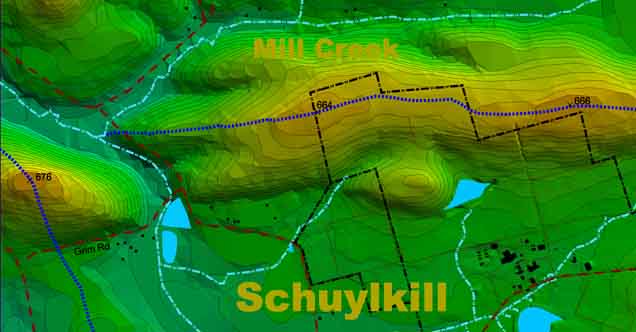
Fig. 10 (JPEG showing more detail)
Two additions to our toolkit made a tremendous difference in our progress. First, we changed the operating system on our computer from Win98 to WinNT. It was like stepping from a leaky boat to dry land�crashes and ruined projects, once commonplace, became rare events. We also began using ArcPress to render the maps, with the fine-tuning of the graphics done in Photoshop. We now use the layout tool in ArcView as an intermediate step to a finished map assembled mainly in Photoshop. We export the view, the scale bar and the legend by way of ArcPress and then adjust the layout and the colors with the better tools in Photoshop. These were rather expensive additions to our setup, but speeded our progress to a better result and greatly reduced our level of frustration.
The watershed map shown above was the first exhibit created that people seemed to really like, and it was very helpful in drawing out memories of observations and bringing clarity and organization to our assessment. We could now see that the farm occupies most of a bowl at the upper reach of the Schuylkill watershed. Even people who have walked these lands for years were somewhat surprised to realize how this familiar ground really sits in the watershed and how the hydrology must work. In short order, we had located the seven interior springs and the other hydrologic features shown in Fig. 11.
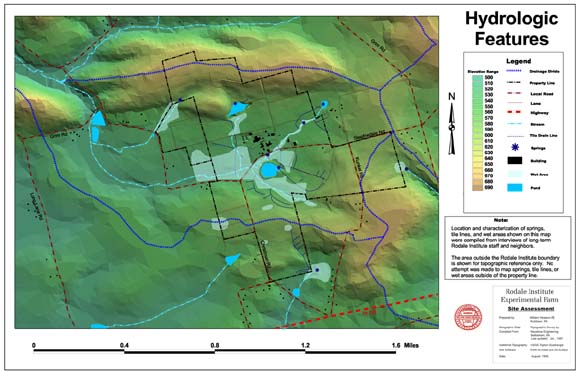
Fig. 11 (Shaded relief map emphasizing water movement)
With the experience and confidence gained by refining the above two maps, we set about creating a series of maps to reveal the story of this place from a number of angles. We are drawing many maps of larger scale to show the greater context of the geography and geology of the east coast. We are also drawing a number of maps at this scale and smaller to further explore the detail of the flora, fauna, soils, geology, etc. of the farm. A few representative examples follow:
We want to map our place within the greater Delaware River basin and show how our small springs and streams connect with the Atlantic Ocean. Some of these maps serve an immediate function as educational materials for the many school tours that visit the Rodale Institute Experimental Farm.
Since most Pennsylvanians are familiar with counties and often describe places by describing the position within a particular county, we thought it useful to show the farm in relation to the Berks county DEM (Fig. 12), the entire Delaware watershed with the counties and the state boundary (Fig. 13), and the entire Delaware watershed with the major streams and rivers (Fig. 14).
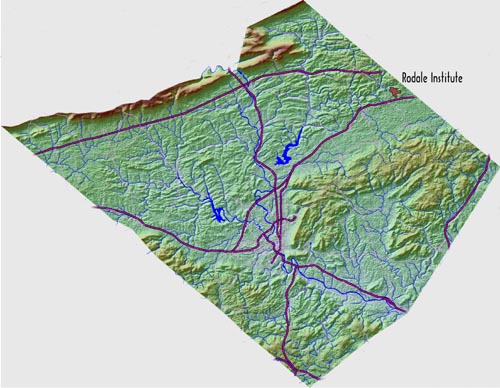
Fig. 12 (DEM of Berks County, Pennsylvania)
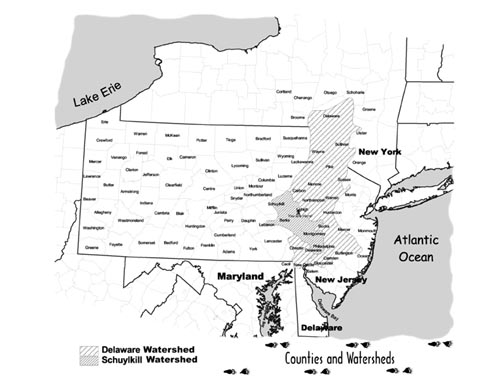
Fig. 13 (Delaware River Basin and County names)
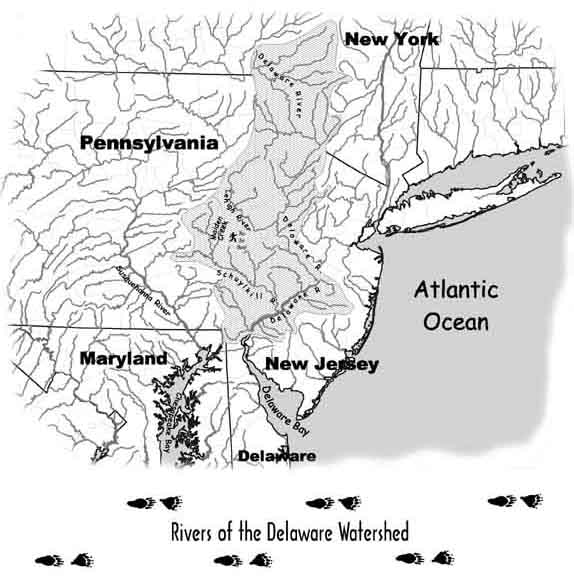
Fig. 14 (Major Rivers of the Delaware Basin)
To tie the local, often unnamed, streams to the river system of the basin, we prepared a map connecting the two (Fig. 15). This map strengthens the point that the farm lies in the upper reaches of two watersheds. One implication of this fact is that we are able to have great control over the quality of water leaving our system and are not encumbered with receiving or passing water of unknown quality. Even geographically enlightened individuals who are familiar with this area for many years are often not aware of this fact, although they grasp it quickly when they see it mapped.
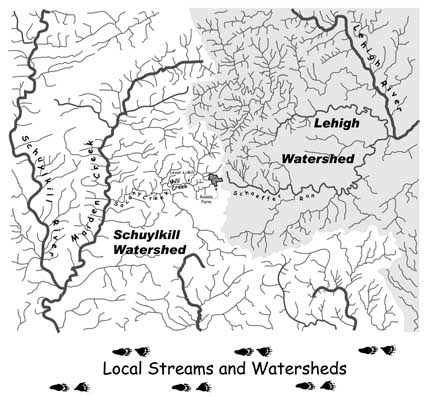
Fig. 15 (Showing the branching connection between the local streams and the basin)
Another element in this series of large scale maps is the physiographic features map (Fig. 16). All the maps in this series were assembled fairly easily using various layers collected from different sources over the course of the first two years of the site assessment project. Of course, many of the data sources were scanned images or were received in different projections. We are learning to invest the time to keep good metadata records. We have also developed a procedure of converting and storing all of our basic data sets unprojected--bringing them into themes with a projection appropriate to the exhibit being prepared.
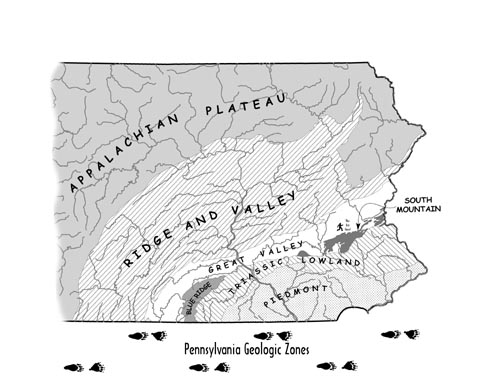
Fig. 16 (Physiographic features overview)
We have found value in plotting the boundary of our farm as accurately as possible on any map we encounter that may be of interest for our research. It is not necessary to wait for the latest computerized dataset to discover geographic relationships and map them in the GIS. Plotting a series of acetate sheets with common geographic elements (the property boundary, rivers, political boundaries, roads, etc.) at different scales makes a useful set of tools to overlay maps in libraries. We are beginning to use this technique to uncover the history of the transportation network in our area.
We are fortunate to have a very detailed and carefully drawn geology map (Fig. 17) for our area with a section taken through the farm showing the underlying rock. The GIS approach allowed us to locate the property boundary on the geology map and also locate where the cross section was taken. Additionally, we combined some fracture traces shown on a map of wells in our county in order to look for evidence of them on the ground (the result has been inconclusive). The composed display is a useful introduction and teaching tool for staff, visitors, and interns who wish to understand the underlying geology here. This composition is enlightening to people who are familiar with and interested in the geology of our area. They may know the maps that I have combined, but they have often not realized exactly how the faults and formations relate to obvious landmarks. This map is also an important part of our effort to understand the nature and potential of all of the soils on the farm.
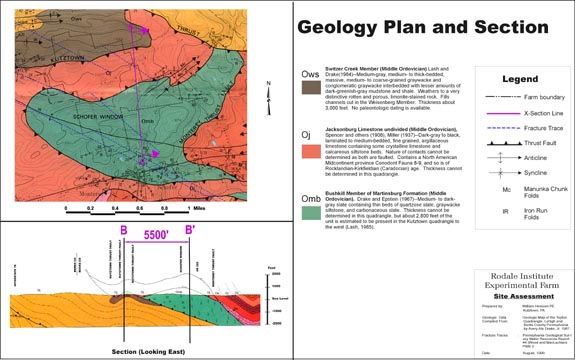
Fig. 17 (Geology Map)
The slope and aspect series (Figs. 18 � 21) are derived from the basic TIN produced for the elevation model used in the Watershed Map (Fig. 9), but are restricted to the property boundaries. Although the coarser elevation data outside our property boundary yields a good topographic map, the slope and aspect maps are confused where we don�t have the finer 2� elevation model to work with. The breaks in the slope map (Fig. 18) are chosen to correspond to the USDA soil classification system. We have learned that making too small the intervals (e.g. 0-2%, 2-4%, etc.) of slope symbolized in the legend results in a map that is hard to read and thus conveys less information when the intention was to give more.
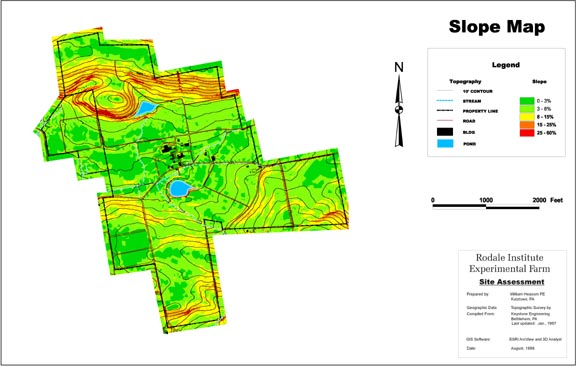
Fig. 18 (Slope Map)
The solar aspect map (Fig. 19) is derived from the TIN mentioned above. Extra steps were required to give a map that is easily interpreted in an intuitive way. Three different aspect maps were created using the same color values for each azimuth, but different saturations. Using the previously created slope map and exporting it in raster form using ArcPress, a set of masks related to three degrees of slope (0-3 percent, 3-8 percent, and greater than eight percent) was created inside Photoshop. These mask were used to cut out areas from the differently saturated solar aspect maps. The composite shows both aspect (hue) and slope (saturation). The less saturated colors indicate that the gound is tilted at a smaller slope and so aspect has less influence on solar influx.
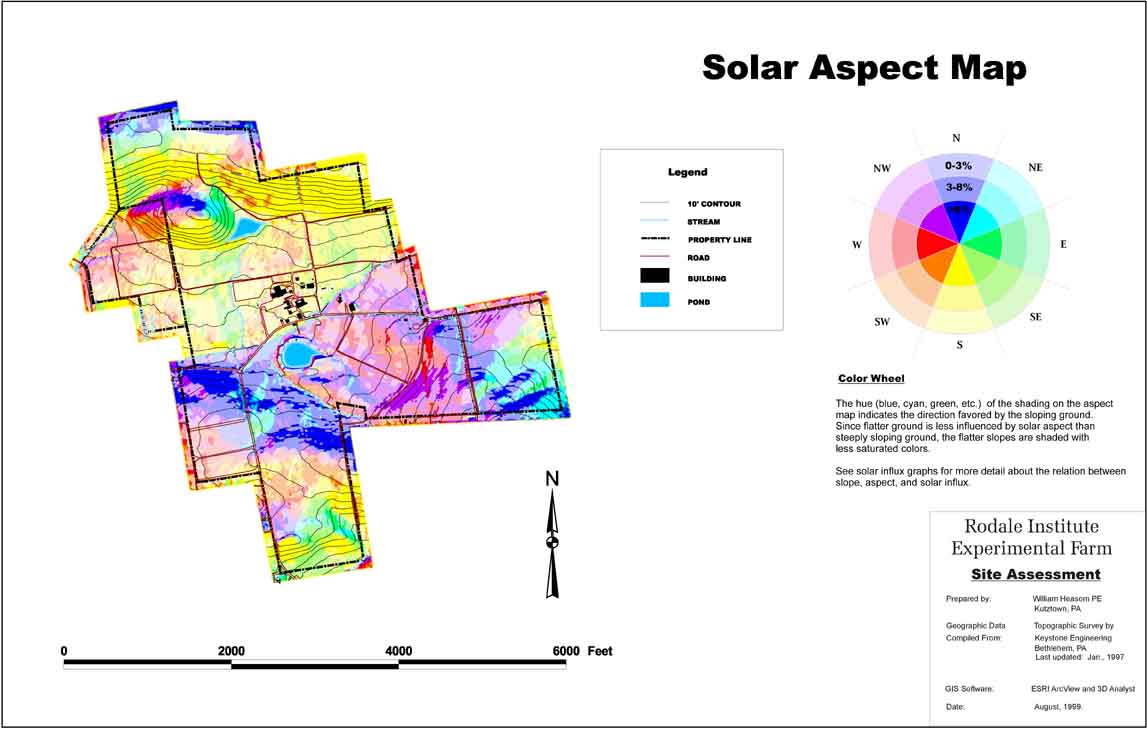
Fig. 19 (Solar Aspect Map)
The solar arc map (Fig. 20) and the solar influx graph (Fig. 21) are companions to the slope and aspect maps. The amount of solar energy available depends on the slope and aspect of the ground, the time of day and the date as well as the weather conditions. These exhibits taken together are meant to challenge those who believe that south facing slopes receive more energy than north facing at all times�possibly forgetting degree of slope, time of day, and season.
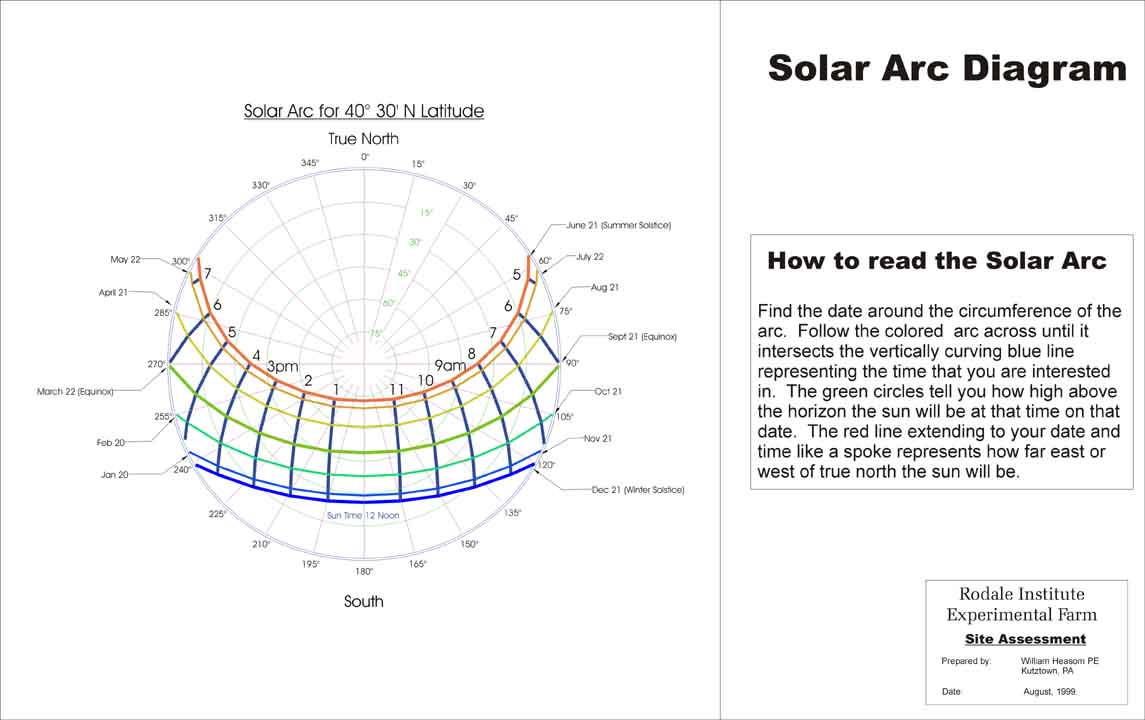
Fig. 20 (Solar Arc Diagram)
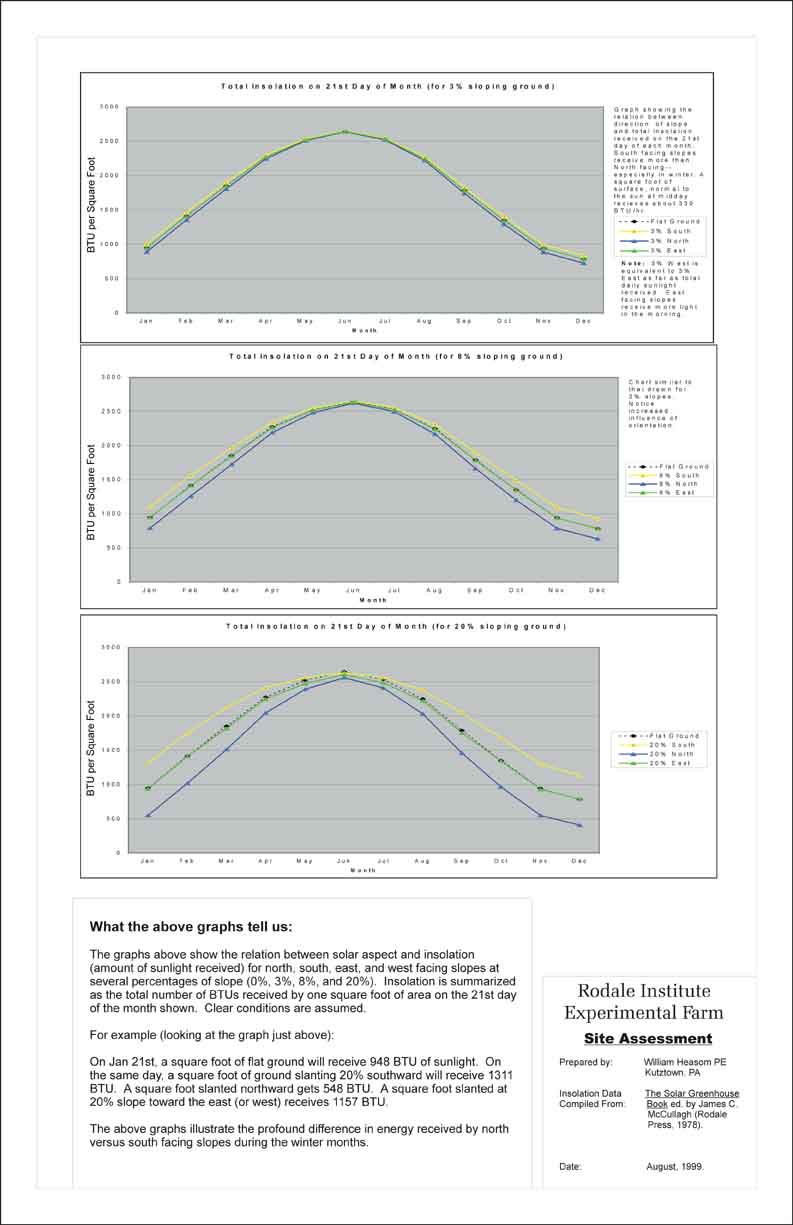
Fig. 21 (Solar Influx Graphs)
The population of all living things on our earth is now threatened in a multitude of ways. Today�s burgeoning population of human beings is racing toward distruction at a dizzying pace. There is a lot of sickness and madness about.
We are trying to foster health � of all living things, of human beings, and of the very soil of which we are temporary stewards. A healthy person is able to think and see clearly and less likely to destroy nature out of ignorance. By growing healthy food in cooperation with nature rather than laying nature to waste in the mass production unwholesome food, we are encouraging a revitalized connection with the very soil that sustains our lives.
Many conservation battles are now being lost due to the agriculture of exploitation. We acknowledge the reality that people will feed themselves and attempt to survive a grinding poverty at any cost to their local environment. By bringing care to every aspect of how we plan for our production of food and by sharing that planning process, we hope to encourage and support others to find local solutions to our common challenges.
In understanding our land and planning for an uncertain future, we want to invoke the most powerful techniques available. Our experiments with GIS to date have convinced us of its power and potential to understand the earth and to make good plans. Our experience in sharing the information made clear with the help of the GIS have persuaded us of its educational potential. We are looking forward to expanding our knowledge about and use of these tools.
Many individuals, organizations, publications and other media have flowed into and through this work. The following list is somewhat random and less than thorough. Unless otherwise noted, all can be located C/O the author or C/O Rodale Institute Experimental Farm.
GIS:			Charles Convis of Esri Conservation Program
			Dr. Robert Martin, Geography Dept., Kutztown University

Esri Software:	  	ArcView; Spatial Analyst and 3D Analyst extensions; ArcPress;
			Data Automation Kit

GIS Data:		ArcUSA 1:2M; USGS; PASDA; others
			Keystone Engineering Co., Bethlehem, PA

Archaeology &		Peter Miller, Kutztown University
Anthropology:		Philip Parazzio

Geology &		Dr. Ed Simpson, Kutztown University
Soil Science:		Ed White, Chief Soil Scientist, NRCS
			John Chibirka, Soil Scientist, USDA
			Dr. Laurie Drinkwater, Cornell University
			Geoffrey Mason
			Lou Sapparito

Rodale Institute	Anthony Rodale, Vice Chairman
History:		John Haberern, President
			Jeff Moyer, Farm Manager
			Jake Collani
			Owen Maguire
			Carolyn Reider
			Don Jantzi
			April Painter

Meteorology,		Cyane Gresham
Agronomy,		Rebecca Hartman
Flora and Fauna &	Peggy Waggoner
Misc.:			Wendy Herdman
			Rita Koch
			Eileen Weinsteiger
			Pat Michalak
			John Brubaker
			Beattie Adams
"Design With Nature" by Ian L. McHarg.  American
       	Museum of Natural History Press, 1969.