3D-tracker: ArcView 3D application for real-time subsea pipelaying
Margaret Giffen and Joachim Juell, GEODATA AS
Steinar Vasshus, Statoil
Abstract
While pipelayers previously had to rely on two-dimensional paper maps, they can now follow vessels and pipeline movements in the terrain real-time on a monitor. Because of the difficult terrain on the western coast of Norway, Statoil saw the need for a tool that could cut accidents and save time and resources. An application was developed, which visualizes the ROV and the other vessels along with the pipeline being laid, in both 2D and 3D, based on real-time data from the navigation system. The application was developed using ArcView with the 3D- and Tracking Analyst extensions.
1. Need for 3D Tracker
During the spring of 1999, Statoil was planning the laying operations for the Vestprosess pipeline, a 43 km long 12" subsea pipeline which was to go from Sture to Mongstad off the west coast of Norway. The seabed in these coastal waters presents a large challenge for pipelayers since it is characterized by:
Pipelayers have previously had to rely on two-dimensional paper charts during the pipelaying operation. This has not been been much of a problem in areas further out in the North Sea where the seabed is relatively flat, but an accident while laying another pipeline through the same fjord where the Vestprosess pipeline was to be laid, made Statoil realise the need for a 3D visualisation tool.
2. Requirements
The main requirements for the development of the 3D-tracker were:
Statoil contacted GEODATA, Esri Norwegian distributor, in April 1999 to see if they could provide an application by July 1999 when the pipelaying operations were to start.
Statoil have been users of Esri software for many years, and hoped therefore to use as much standard functionality in the software as possible. Since the delivery time for the application was so short, there was little time to spend on application development.
Statoil already had digital terrain models of the seabed in ArcInfo formats, as well as base data such as coastline and other pipelines. Statoil did not want to spend time reformating or converting data which was to be used in the 3D-Tracker application.
The 3D-Tracker application was to be used by pipelaying operators who did not have much computing experience, so it was important that the application was easy to use.
If accidents were to be avoided, then the 3D representation of the seabed had to be as clear as possible so that the operators could easily identify where it is safest to lay the pipeline. It was important to give ROV- and pipelaying operators a tool for on-line visualisation of the pipeline together with positions of the laying vessel, survey vessel and 3 ROVs relative to the seabed. (ROV = subsea Remote Operated Vehicle).
3. How the 3D tracker works
The 3D Tracker works in the following way:
4. User Interface
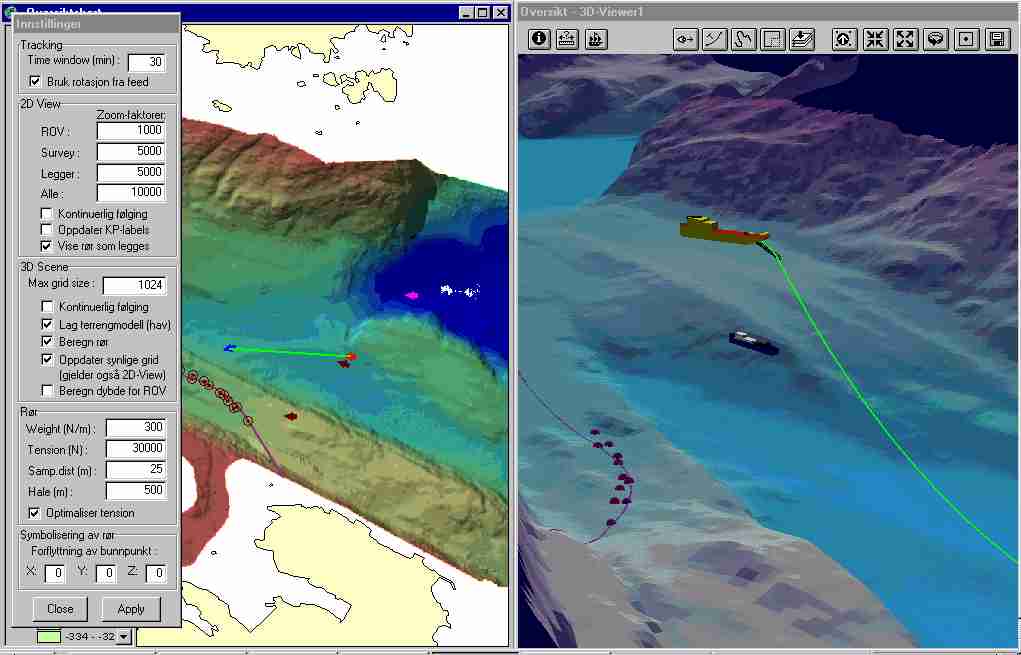
The figure below shows the 3D-Tracker’s user interface.
The digital terrain model has a resolution of 5 x 5m, which gives a good representation of the topography of the seabed.
A 2D representation of the seabed, the positions of the survey and laying vessels are shown in the View window, on the left. The 3D representation is shown in the 3D Viewer window to the right.
In both the 2D and 3D windows there are functions for setting the viewing position. In the 2D window it is possible to center the map on the survey vessel, the laying vessel or the ROV. In the 3D window the scene can be set to show the whole grid, the pipeline, the touchdown point of the pipeline on the seabed or the ROV.
The dialog window which is shown in the figure below is used for setting a number of parameters. These include
. Sample time for reading in new positions
. 2D view settings (zoom factors, update KP labels, show pipeline, etc.)
. 3D scene settings (max grid size, compute terrain model for the sea surface, updating of visible grid and depth of ROV)
. Parameters for computing the pipeline position (weight, tension, sampling distance, etc.)
It is also possible to turn the tracking function on and off.
5. System configuration
The system was set up with the following hardware and software:
|
|
Approx. Cost (US$) |
|
Dell Precision 410 Workstation - 450 MHz - 512 Mbyte memory - SCSI harddisk - 3D-LABS Oxygen GMX 2000 videocard - 96 MB video memory |
4000 |
|
Tandberg Ergos can 500, 21" monitor |
1000 |
|
Software (NT4.0) - ArcView 3.1 - Tracking Analyst - 3D Analyst - 3D Tracker application |
50000 |
|
SUM |
$55000 |
An important requirement is that there is a high-quality graphics card on the PC which runs the system in order to achieve a satisfactory quality on the 3D scene.
It is also interesting to note that the total cost of the 3D Tracker is considerably less than the cost of one day’s pipelaying operation. Given that the main aim of the 3D Tracker is to avoid accidents during pipelaying operations, the 3D Tracking is a tool which can save Statoil considerable sums of money if they can ensure that the pipelines are laid on safe places on the seabed.
6. Results
There were very positive reactions to the 3D Tracker after it was used during the laying of Vestprosess. The operators on board both the survey and pipelaying vessels were satisfied with the system, and found that the 3D Tracker was of invaluable assistance in laying the pipeline.
"We’ve found this an invaluable source of assistance", says Ove Sembsmoen, project manager for Vestprosess pipelaying. "I don’t think we could have completed the job with such good results without its help."
7. Other uses
Other potential application areas for the 3D Tracker are:
Planning: The 3D-Tracker can save a great deal of work in the planning phase of pipelaying operations, by providing a better basis for choosing pipeline routes. This is turn cuts the need for vessels during laying.
Other application areas: The 3D-Tracker has many other application areas such as cable laying, trenching, dredging, ROV intervention, etc.
Author information
Margaret Giffen (E-mail: margaret.giffen@geodata.no)
GEODATA AS
P.O. Box 6874 Rodelokka
0504Oslo
Norway
Tel: +47 23 24 90 00
Fax: + 47 23 24 90 90