
GIS in the Trenches: DelDOT's Corridor Capacity Preservation Program
Timothy P. Ledet
Alicia Cignatta
ABDSTRACT
The Delaware Department of Transportation (DelDOT) is currently studying ways to increase the carrying capacity of their highways, without initiating new construction. Gannett Fleming has been supporting DelDOT's efforts by using GIS as a decision support tool. This has included the creation of large format hard copy maps, the initiation of complex spatial analyses, and the development of critical GIS data. This paper will look at the variety of ways GIS can help transportation officials inform, educate and build consensus among concerned citizens, private businesses, and government agencies.
INTRODUCTION
The Delaware Department of Transportation (DelDOT) initiated a study back in 1992 on ways to increase the carrying capacity of their major highways while limiting the amount of new construction. The program, named the Corridor Capacity Preservation Program (CCPP), became law in 1996 (Section 145 of Title 17 of the Delaware Code) and is focused on four major corridors in the State. Gannett Fleming, Inc. has been supporting DelDOT's efforts with two of the corridors: US 13 from Route 10 in Camden south to the Maryland State line and US 113 from Milford south to the Maryland State line (see Figure 1).
Figure 1 Corridor Study Areas
The goals of the program, as stated by the DelDOT Division of Planning, are to:
GIS is playing a major role in this program. Gannett Fleming is providing DelDOT with a variety of services and data to assist transportation officials to educate concerned citizens and local governments of the object of the program. Working with Senior transportation engineers and planners, GIS personnel have been involved in the conversion of raw data, complex spatial analysis and the production of several different kinds of thematic and reference mapping. Some of the projects undertaken include:
As in most GIS endeavors, converting base data is one of central tasks that must be completed before any meaningful analysis can proceed. In the CCPP, properties along each corridor are the subject of most of the planning discussions.
DATA DEVELOPMENT TASKS
The first major task for GIS personnel was the conversion of parcel data in Sussex County. The parcel maps existed only in AutoCad drawings that were not projected. These maps were delivered on disk without reference material or index maps. A large-scale conversion began with the importation of drawings into Arcview and the creation shapefiles of all relevant tax maps using the layers that comprised parcel boundaries. These shapefiles were brought into Arc/Info and merged together and the resulting coverage was then brought back into Arcview for attribution. The ultimate goal was to have a shapefile that could be joined to the Computer Aided Mass Appraisal (CAMA) database from the County containing all the relevant information about the parcels, such as owner name or names, zoning classification, acreage, primary landuse, etc.
Another task was the compilation of land use data for Sussex and Kent Counties to show changes along the corridors from the early 1980s to present day. This began with Arc/Info data from other state agencies on land use studies conducted in 1984, 1992 and 1997. The idea was to show how residential and commercial land development had increased in the last decade along each corridor.
A similar task was to create zoning classes for all properties along the corridor. This information was derived from attributes within the CAMA databases for both Sussex and Kent Counties.
For all parcels along the corridor, two broad classifications where developed by DelDOT: "A" Areas, describing land mostly in rural areas and "B" Areas, consisting of those parcels in and around municipalities that are residential or commercial in nature. For parcels in each area statistics were desired such as how many parcels in all "A" areas currently have access to the highway or how many parcels in "B" areas have multiple access points. These were some of the numbers derived using spatial analyses in Arcview.
Parcel Conversion
Data received from the Kent County planning office for those parcels along Route 13 south of Camden to the Sussex County line was in a projected GIS format. Very little work was required in order to prepare spatial analyses on these parcels, since each came with a unique identifier that joined with the CAMA database received from the County. Unfortunately, these parcels comprised only a small portion of the total corridor study area.
Sussex County tax maps were delivered as unprojected AutoCad drawings. These drawings did not include an index grid or reference map showing the entire layout of the County. The first step in this process was to develop a plan of attack in order to piece together a work flow to convert all parcels along Route 13 and 113 outwards about a mile and all parcels in municipalities along these routes (see Figure 2).

Figure 2 Parcel Conversion Plan
Beginning with software created by the Sussex County mapping office, each AutoCad drawing was reprojected to fit in a coordinate space. Arcview was used to as the initial filter for pulling out the parcel lines from the AutoCAD drawings because it has a relatively easy customization interface and excellent system scripts that can be altered to perform specific conversion tasks. Once all drawings were converted to shapefiles, the process was moved to ArcInfo, where all shapes were converted to coverages and them merged together. Here, ArcInfo has the advantage; the commands to merge and build coverages can be executed in batch mode by writing simple Arc Marco Language (AML) scripts. Once a parcel coverage was created, it was brought back into Arcview for edits and cleanup. There were a variety of datasets used as background including tif images, AutoCAD drawings, coverages and shapefiles and it's quick and easy to set this background and save it in an Arcview project.
Since there was no reference map, each drawing had to be opened to locate a starting point. Then, all maps with parcels in and around the corridor were identified. These maps were brought into Arcview, where all layers that served as parcel boundaries were selected out using the query tool. However, there were a large number of maps to convert, and this method needed speeding up. A custom script was written to expedite the selection of layers, since it was the same on every map. This allowed the user to press one button to highlight all the layers instead of having to build a large query string for every map.
Another problem was how to manipulate the inserts on the AutoCad drawings, since each drawing usually had one or two that needed to be fitted into the final coverage. Some inserts were drawn on different maps as a collection, so each map had to be carefully scanned to find any parcels that were missing, especially those on the corridor. Whether they were on the map as an insert or on a separate drawing, each insert had to be selected out as a separate shapefile and rubbersheeted into the final coverage.
Once all the shapefiles were created, they were converted to coverages and appended into one main tax parcel map for each corridor. In this case, there were more than 50 shapefiles to merge together, therefore, AML's were developed for batch processing. These parcel maps were irregular in shape, because the County's tax districts are not in a grid format but instead follow natural boundaries. The next step was to project the tax map coverages into a known coordinate system, State Plane NAD 83.
Next was the first round of edits. When an attempt was first made to project the AutoCad drawings, some did not transform correctly. Figure 3 shows how most of the data looked at the intersection of two drawings.

Figure 3
These drawings, later in shapefile format, had to be rubbersheeted into the tax map coverage. Control points were laid down in Arcview and then warped in Arc/Info using the adjust command. Even though most drawings projected correctly, they still did not line up closely enough to build a coverage without minor adjustments. Once these edits were made, all of the inserts had to be placed before any topology was created. Once again, each insert required the placement of control points and then to be warped into the main coverage.
With all inserts placed, the arcs were built into polygons. Unfortunately, only about 50-60 percent of them actually closed the first time around. More editing was required to snap lines or bring them closer together to be picked up by the snapping tolerance. After a few more building and editing sessions, all the parcels within the corridor zone were closed polygons. The next step was the attribution of each parcel.
Each tax parcel in Sussex County has a tax identification number comprised of three parts: the tax district, map number and lot number. In order to spend as little time as possible attributing one parcel at a time, other spatial analyses were developed. The most successful method was a script designed to intersect the parcel shapefile with a text coverage containing all of the lot numbers. A new field was then placed into the parcel shapefile containing the lot number which intersected with a particular parcel. Then, the three parts were strung together using Arcview's calculate function. This script was quite successful at capturing the lot number for about 75 percent of the parcels. However, a downfall of this method was that many large parcels captured the lot numbers of smaller adjacent parcels due to the use of callouts for parcel labeling. Thus, attributing the tax ID proved to be the most time-consuming part of the parcel conversion.
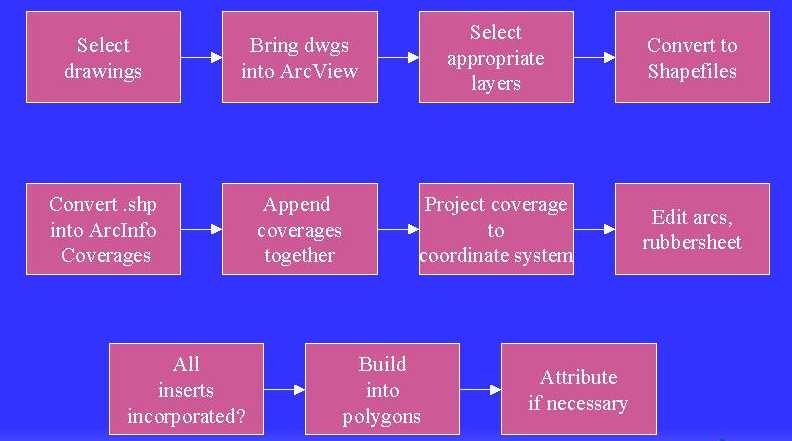
Figure 4 Parcel Conversion Workflow
All work performed by Gannett Fleming is constantly monitored and reviewed for quality improvement. This process was very successful at converting over 75 drawings into one dataset. It efficiently uses the strengths of ArcInfo and Arcview and avoids the pitfalls of being tied to one piece of software to manage a complex procedure. The workflow shown in Figure 4 was submitted as an opportunity for improvement under the company's Continuous Quality Improvement program so that other employees may use the process as a guide in any large-scale conversion projects
Mapping Urban Sprawl
Another aspect of the CCPP was to show the change of land use over the last decade, specifically, the increase in residential and commercial areas and the decrease of agricultural lands. Obvious to anyone driving along either of the corridors in Delaware, there is a lot of development along these highways. Along Route 13 driving from Dover south to the State line, one cannot go more than a few miles without coming upon a crossroad, a town or some other type of development. In a state with little interstate grade highways, maintaining the current carrying capacity of the State's major highways is extremely important.
Data on land use showing changes from 1984 to 1997 was received from the Delaware Department of Planning. Using a similar workflow developed for parcel conversion, data was brought in from ArcInfo export files into ArcView, cleaned up and divided into three classes: Residential, Commercial and Agricultural. To best show the increase in development along the corridors, residential and commercial land uses were combined together. However, looking at total acreage along each highway, the majority of land was still classified as agricultural but the amount of acreage of non-farm lands nearly doubled. The area in red in Figure 5 represents Residential and Commercial land use in and around the Town of Seaford in 1984 and Figure 6 shows the same area in 1997.

Figure 5

Figure 6
As in many other areas around the country, Delaware is seeing its fair share of growth. Urban sprawl is evident in and around each of the municipalities along both corridors and lends evidence of the necessity to preserve the carrying capacity of the State's highways in order to avoid costly new construction.
Classifying Parcels within a Corridor
The CCPP divides the land adjacent to the highways into two classifications: "A" Areas and "B" Areas. The former describes low-density land between municipalities with an emphasis to preserve open space, agricultural resources and environmental features (Figure 7), while the later focuses on land in and around towns with existing development or areas with plans for development (Figure 8). One of the purposes for creating the parcel layer for Sussex County is to show those parcels along Route 13 and 113 that have access to the highways. A data layer was created to show each "Area" along each of the corridors in the study (actually, a line coverage with two instances, "A" or "B", for a certain length traced over the highway centerline).

Figure 7 "A" Area

Figure 8 "B" Area
Field studies were conducted to find all access points on each corridor, including all intersections, driveways or other egress points. Using this data, a coverage was created showing each access point as a line drawn from the road centerline to the interior of each parcel. These lines were later used in a spatial query to find all parcels with access points along each corridor. Using the zoning classification of each parcel, several queries were made of the datasets. Some examples are:
With a complete dataset joined to County tax database tables, these and many other queries were made and statistical data compiled which can give insight to those properties that might be candidates for action with the CCPP. A typical example is shown in Figure 9, which sums the area of each zoning class for parcels along Route 113 in Sussex County.

Figure 9
Data Requests
Under the CCPP, many requests for GIS related data and products have been made. Most of them fall under three general categories:
Officials within DelDOT have made frequent requests for data, mostly in the form of maps. Some of the maps delivered show all zoning classes for those parcels adjacent to the corridor, or show all "A" and "B" areas with ortho-photography and parcel lines on large 8 foot maps. Others show individual parcels with important information such as current zoning, acreage, wetlands, owner and address. Some requests are for statistics, as shown in the previous section.

Figure 10 Sample Map
As the general public becomes familiar with the CCPP, requests have been received from individual owners for maps of their land. Most are interested in how their property could be affected by the program and whether or not their developmental rights could be changed to limit growth. Some people wish to see how much of their property is delineated as wetlands.
One of the ways DelDOT informs the citizens about the CCPP is through public meetings at the county and township level. At each meeting, those in attendance from DelDOT want maps showing the corridors, "A" and "B" areas, parcel lines and the ortho-photography in the background, along with other data and statistics for whatever area they are in.
Conclusion
GIS has played a major role in this project. From data conversion, development and analysis to map production and website design, all the facets of the field have been touched upon. The CCPP is an excellent example of the integration of GIS into the engineering and planning fields. It's more than merely having AutoCAD maps or engineering drawings as a backdrop, but rather consists of integrating information management and expert mapping techniques. Gannett Fleming's approach in developing a process of data conversion focusing on the strengths of ArcInfo and Arcview met with success and gave our planners valuable information. This process has also been used on other projects since its creation and it continues to provide a solid course of action in the production of geographic data sets.
Timothy P. Ledet
GIS Analyst
Gannett Fleming
www.gannettfleming.com www.geodecisions.com 11818 Rock Landing Rd, Suite 101Newport News, VA 23606
Phone: 757-873-0768
Fax: 757-873-6868
tledet@gfnet.comAlicia M. Cignatta
GIS Analyst
www.geodecisions.com 4701 Mount Hope DriveSeton Business Park
Baltimore, MD 21215
Phone: 410-585-1460
Fax: 410-585-1470
acignatta@gfnet.com